Article Text

Abstract
Life expectancy globally increased in the last decades: the number of people aged 65 or older is consequently projected to grow, and healthcare demand will increase as well. In the recent years, the number of patients visiting the hospital emergency departments (EDs) rocked in almost all countries of the world. These departments are crucial in all healthcare systems and play a critical role in providing an efficient assistance to all patients. A systematic literature review covering PubMed, Scopus and the Cochrane Library was performed from 2009 to 2019. Of the 718 references found in the literature research, more than 25 studies were included in the current review. Different predictors were associated with the quality of EDs care, which may help to define and implement preventive strategies in the near future. There is no harmonisation in efficiency measurements reflecting the performance in the ED setting. The identification of consistent measures of efficiency is crucial to build an evidence base for future initiatives. The aim of this study is to review the literature on the problems encountered in the efficiency of EDs around the world in order to identify an organisational model or guidelines that can be implemented in EDs to fill inefficiencies and ensure access optimal treatment both in terms of resources and timing. This review will support policy makers to improve the quality of health facilities, and, consequently of the entire healthcare systems.
- emergency department
- performance measures
- healthcare quality improvement
Data availability statement
All data relevant to the study are included in the article or uploaded as supplementary information.
This is an open access article distributed in accordance with the Creative Commons Attribution Non Commercial (CC BY-NC 4.0) license, which permits others to distribute, remix, adapt, build upon this work non-commercially, and license their derivative works on different terms, provided the original work is properly cited, appropriate credit is given, any changes made indicated, and the use is non-commercial. See: http://creativecommons.org/licenses/by-nc/4.0/.
Statistics from Altmetric.com
Introduction
Worldwide, in the last 150 years, human life expectancy has rapidly increased, doubling from around 45 years to 80 years, in many industrialised countries. Driven by increases in life expectancy, the world’s population is ageing, and this growth is projected to accelerate in the coming decades. The number of people aged 65 or older, accounts for 21% of the global population; however, over the next 30 years, the number of older persons is projected to increase to 33%, in 2050 (WHO, ISTAT Geodemo—2017). These extra years of life and demographic shifts have profound implications for health systems and the societies in general, since ageing is a well‐established risk factor also for the development of several multiple chronic diseases, including cardiovascular disease, stroke, cancer, osteoarticular and neurological diseases. The exponential increase of chronical disease due to the ageing world population leaded consequently to increase of healthcare demand. Older people generally have more complex problems, requiring more investigations, admissions and critical care. It is also worth noting that elderly patients have considerable comorbidities, seem increasingly to be sent to emergency departments (EDs). In the recent years, the number of patients visiting the hospital EDs rocked in almost all countries of the world. These departments are crucial in all healthcare systems and play a critical role in providing an efficient assistance to all patients, especially for elderly with chronic and multichronic conditions. Inefficiency EDs are an ongoing issue for hospital staff, healthcare administrators, policy makers and patients. With increasing patient demands on these services and constricting budgets, administrators are in search of practical and implementable solutions to optimise patient flow and increase throughput.1
Over the last decades, the role of EDs has evolved and EDs have become providers of not only acute emergency services, but also of care for patients needing in general, of primary healthcare,2 trying always to provide an efficient and quality service to all patients.3
The increase in our ageing population presents many opportunities and several public health challenges that we need to prepare for. The most important challenge for healthcare systems is to provide assistance, improving efficiency, productivity, and the appropriateness and quality of care and its departments and for this aim, various tools and approaches have been proposed in the literature so far in different healthcare settings and for different objectives aimed at improving the quality of the provided services.4–9 However, no objective and officially parameters that can assess the true efficiency and quality of these EDs were recognised. This study aims to review the literature on the issues encountered in the efficiency of EDs worldwide.
Methods
The review of the literature, following Sashi et al10 methodology, adopts three steps as summarised below:
Papers selection:
A selected set of keywords was used to find the articles.
A definition of the inclusion/exclusion criteria was carried out in the selected articles.
Descriptive analysis:
A descriptive analysis and classification of the articles was developed on the selected articles.
Theoretical and content analysis of the selected papers:
A theoretical and content analysis was described in the articles selected according to their theoretical reference model.
Additionally, citation and cocitation analyses have been conducted to identify historiography results, clusters of main contributions and authors in the field, as well as analysis of clusters. Finally, all contributions have been divided into thematic areas to have a complete overview on the subject.
Papers selection
A systematic literature review was conducted to describe and analyse the world’s EDs in order to select efficiency measures of EDs. Searches of three electronic database (PubMed, Scopus and Cochrane Library) were performed from 2009 to 2019, using the following keywords: ‘emergency’ AND ‘department’ AND ‘efficiency’.
To be included in the present review, articles were required to fulfil the following criteria:
The inclusion criteria were as follows: original research (ie, clinical study, clinical trial, comparative study, observational study) regarding the efficiency of EDs for human admitted patients, published in the last 10 years and written in English or Italian.
The exclusion criteria were as follows: systematic reviews previously published; abstracts, poster presentations, case reports, letters, comments, editorials, and review papers (not published as full papers), studies not quoting outcome in the result section and studies related to specific diseases and departments or specific subgroup of patient.
Descriptive analysis
For each included study, we extracted the following data using a standardised form: author and year of publication, country of study, aim and design, study setting, data source, number of included patients and year of data collection, intervention, type of outcome, results, limitation and conclusion.
The title and abstract of primary results were examined and potentially relevant articles were reviewed in full text, and only articles that fulfilled the inclusion criteria were considered for final appraisal.
Theoretical and content analysis of the selected papers
References were checked automatically and manually to identify and remove duplicates.
Titles and abstracts were examined by three members of the review team (DDL, GS, FC). Disagreement between the three reviewers was resolved by consensus of a third party (LSD).
Potentially relevant articles were reviewed in full text, and only articles that fulfilled the inclusion criteria were considered for final appraisal.
Results
The literature search of the selected databases yielded 718 references. Fifty-four redundant papers were removed using the auto-searched method, and the remaining articles (664 papers) were screened. Starting from the titles, 251 articles were excluded. The remaining 413 articles were analysed reading the abstract and 344 were excluded. Among the 69 selected full text, 28 studies were included in the current review. The selection process through the different phases of the review is depicted in figure 1.
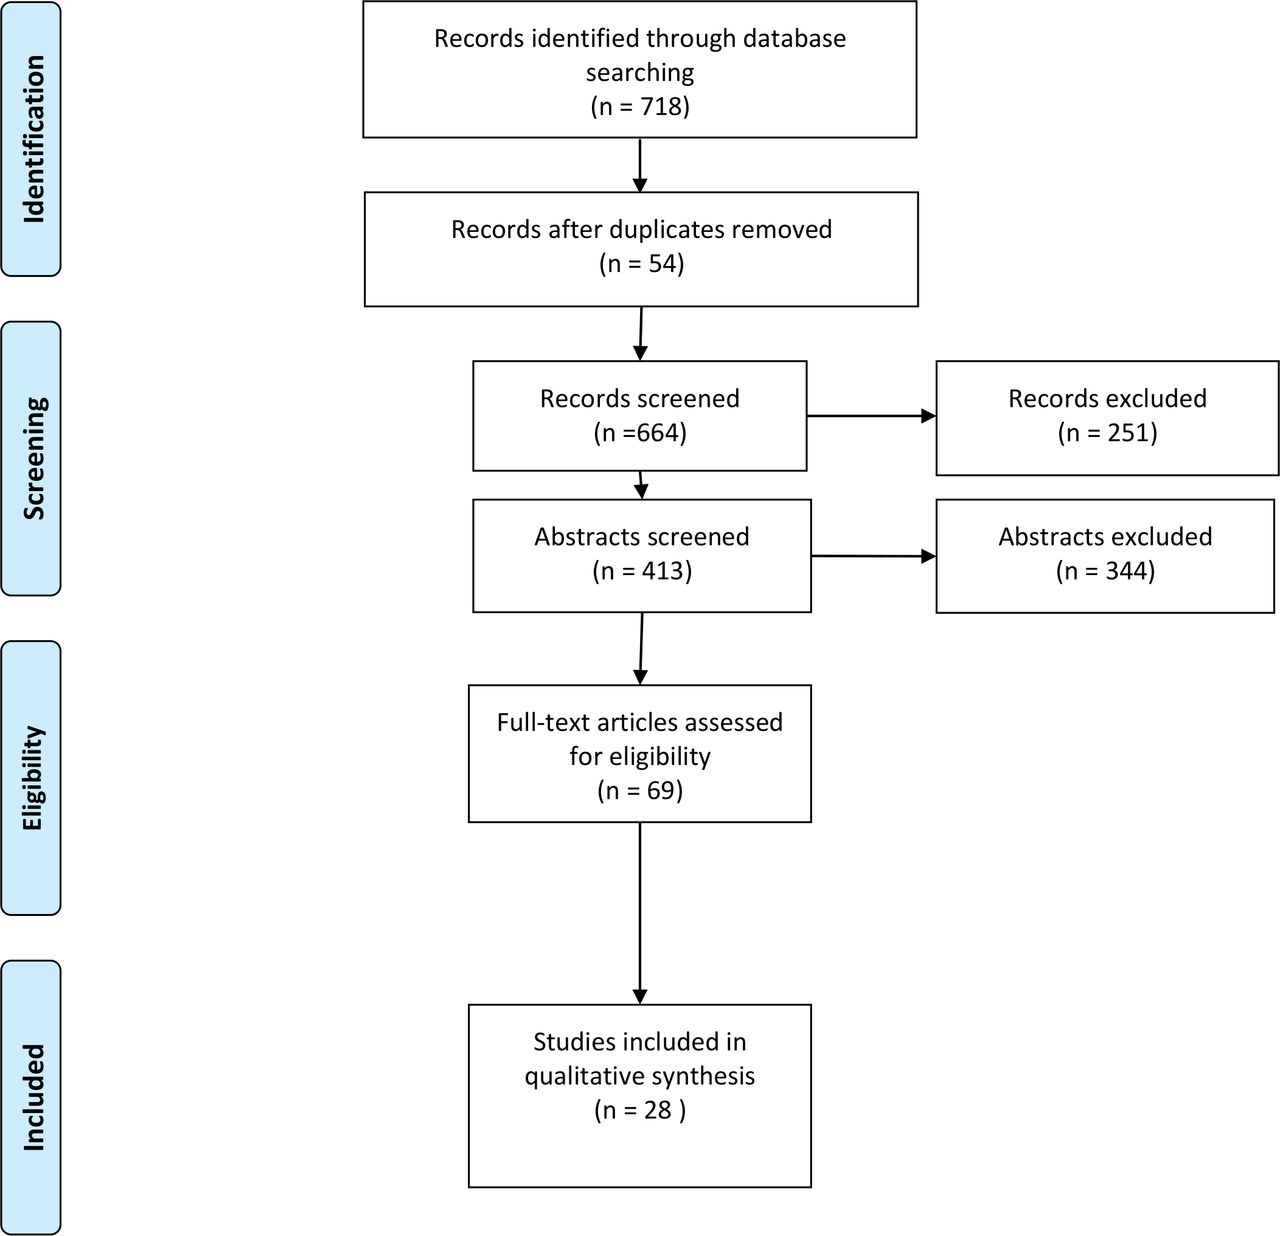
PRISMA 2009 flow Diagram. Adapted from Moher et al44.
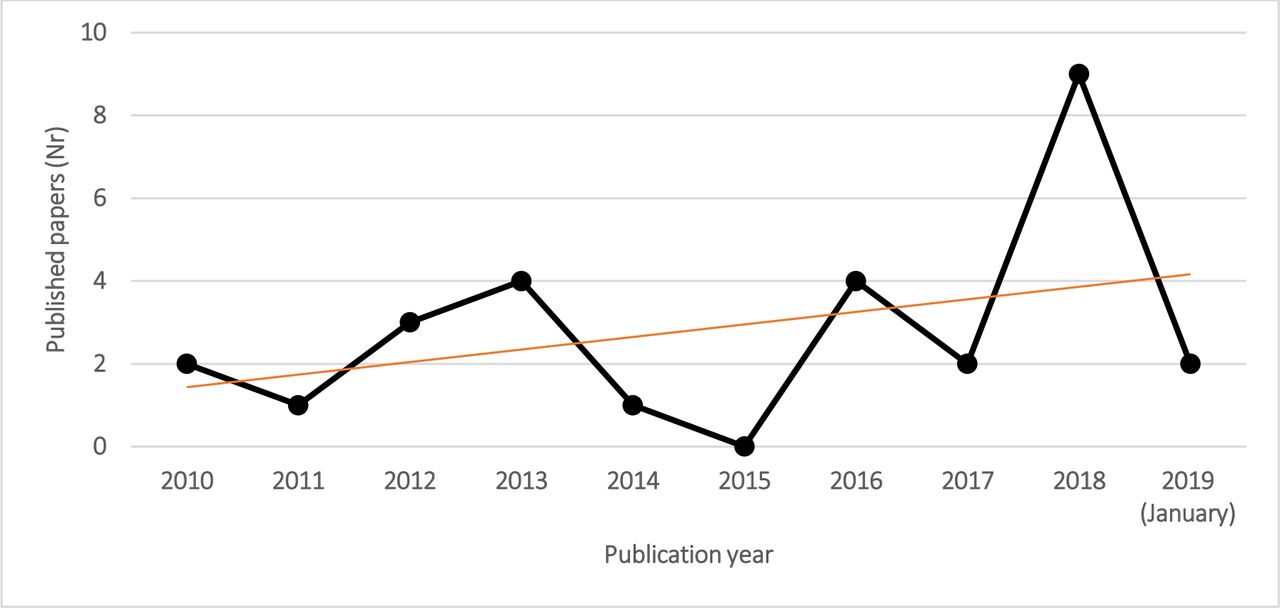
Of the 28 articles analysed: 9 were conducted in the USA, 6 in Australia, 3 in Canada, 2 in China, 2 in France, 1 in Italy, 1 in Portugal, 1 in Sweden, 1 in the Netherlands, 1 in Germany and 1 in UK. Figure 2, over the period of systematic literature review (January 2010–2019), showed an increase in the number of published papers, on hospital EDs. The number of published papers increased from 2 in 2010 to 11 papers in 2018 in first month of 2019. The greatest increase in the number of published papers was reported from 2014 (figure 2).

Number of selected papers over publication years.
Among the 28 studies, 12 aimed to evaluate the impact of resources implementation, 9 to evaluate already existing resources, 5 to describe models or simulations and 4 to compare performance measures over levels of urgency, between two or more hospitals. Overall, 75% of included studies were retrospective or prospective observational, 18% were modelling studies, 7% was designed as quasiexperimental study and pragmatic cluster randomised trial.
The quasiexperimental study was conducted with an uncontrolled, interrupted time series analysis, since the random allocation was not feasible, to investigate the impact of national healthcare reforms on ED time-based process outcomes. The randomised-controlled trial performed from Cheng et al assessed the impact of a physician (MD)–nurse (RN) supplementary team at triage (MDRNSTAT) on ED. During the study, patients were randomly assigned to intervention or the control group, using a computer-generated algorithm.
Concerning research setting, we classified hospital EDs according to the number of visits per patient per year or availability of hospital beds. Thirteen studies were performed in hospitals with <70 000 ED patients/year, seven in hospital with 70 000–100 000 ED patients/year and six studies were about hospital with more than 100 000 ED patients/year. The number of ED patients/year ranged from a minimum of 28 000 to a maximum of >300 000. Two studies provided information on hospital capacities only in terms of bed numbers, reporting 74 and 495 beds as study settings, respectively. The most frequent types of data source were electronic medical records systems (68%), administrative databases (25%), in-hospital physician contacts and real world data from clinical practice (7%).
The patient sample size in the modelling analysis ranged from 30 to 33 710, except for one study that did not report the number of simulated patients.
The observational studies included in this review varied in sample with a minimum of 599 to a maximum of 5.8 million patients, excluding one study with missing information. Over the 11-year period 2006–2016, the quasiexperimental study reported 13 241 509 ED presentations in 34 Victorian hospitals. The study conducted by Cheng et al randomised 3137 patients to intervention group and 3163 to control group.11 Other details on characteristics of included studies were summarised in online supplemental table 1.
Supplemental material
Efficiency measures
Overall, the studies showed mixed performance measures associated with the quality of ED care. The most frequently used measures of ED efficiency: length of stay (LOS), process waiting times, indirect quality indicators in order to evaluate the impact of overcrowding or resource allocation (ie, Left Before Visit Complete (LBVC), left without being seen (LWBS), left without being seen by a physician (LWSP) or performance in the EDs (number of visits or patient admitted) and mortality.
Length of stay
LOS has been suggested as a quality measure in 15 of 28 studies (53.6%) and it was generally defined as the difference between ED arrival and the time that the patient left the ED for discharge or admission. LOS was recognised as an outcome of efficiency measure and a useful tool to evaluate ED processes, performance and quality of care in older and more recent studies .12 13 Long LOS in ED could represent the stress of overburdened healthcare systems. Efficient and effective patient flow in the ED could be quality outcomes as well as patient safety and satisfaction and care optimisation.14 The results of the studies agreed that reduced LOS resulted in greater patient satisfaction in patients with mild and serious illnesses seen in ED’s who needed immediate treatments or fast assistance flow.15 All included studies except one16 have demonstrated significant reductions in patient LOS after implementation of interventions to improve ED department performance; however, key differences exist as well, concerning study setting, differences existing in ED patient populations, intervention, hospitals structure and setup (eg, public or private funding, tertiary or non-tertiary). Studies agreed that skilled, timely care17 18 is crucial.19 The largest magnitude of improvement in ED performance was reported from McHugh et al,20 who evaluated the impact on LOS of the ED Telehealth Express Care Service: a combination of new technology, informed consumers, patient-centred care based on a ‘virtual visit’ with a board-certified emergency medicine attending physician located remotely, in the USA. One thousand and three hundred patients who present to the ED with minor complaints after triage and medical screening evaluation have been treated with care service and experienced decreased LOS leading to an overall 24% decrease in ED LOS (2.5 hours to 38 min) and increased satisfaction. Less recently, Baumlin et al21 redesigned the patient work flow in a tertiary academic with a separate department of emergency medicine hospital of New York City: a fully integrated ED information system with patient tracking computerised charting and order entry. This process expedites rapid triage and allows orders to be entered and carried out within minutes of patient arrival. The ED LOS for all patients decreased by 29%, from 6.69 hours pre intervention to 4.75 hours post intervention, patient satisfaction has improved as well. Strom Verloost et al compared LOS16 over levels of urgency before and after the implementation of the Manchester Triage System (MTS), based on a flowchart with five triage categories according to level of urgency and waiting time, in Netherlands University teaching hospital. Regardless of the effectiveness of the implementation of the MTS, the authors associated the LOS and waiting times to efficiency and quality of EDs.
Time intervals
Door to provider, to order time, to disposition and to physician were identified as other significant study outcomes. Li et al22 defined door-to-order time and door-to-disposition time as the time interval between patient registration and the prescription of the first order by the EP or the completion of patient disposition by the EP, respectively. Other studies13 23 calculated the door-to-doctor time as mean time to see a physician, from patient registration to documented time of physician encounter for all patients. Welch and Dalto24 defined the door-to-doctor time as the time interval between when a patient was recognised as an ED encounter and physically present in the department to the time when a physician entered the patient care room. Baumlin et al defined door to doctor time as triage time to the time the attending physician signed up for the patient.21 In these studies, selected outcomes were used to evaluate EP efficiency and important criteria for bench marking ED operational performance and a quality measure for the ED.24 They were correlated with patient satisfaction and clinical quality.22–24 Interest for these outcomes has recently increased and officially recognised.25
Wiler et al, conducted a retrospective observational pre–post intervention comparison study and described the development and the implementation of a novel process design in a large academy urban ED with 75 000 ED annual visit, in the USA. It was a split flow model consisted of deployment of a novel intake model, implementation of a 16 bed clinic decision unit, expanded point of care testing and dedicated ED transportation services. During the 6 months pre and post implementation periods, these processes resulted in: a 30 min decrease in door-to-physician time (from 54 to 15 min), a 45 min decrease in LOS (from 220 to 175 min) and improved patient satisfaction by 7% (average score 77.9 vs 83.4). The authors showed that the improvement in door-to-physician time was strongly correlate with LOS improvement, patient satisfaction, as well as to correlate with quality and safety outcomes (Boudreaux et al26). Recently, around the world ‘the 4-hour target’ has been proposed as a new measure of the ED performance. More exactly, it is the as the percentage of admitted patients that had spent less than 4 hour in the ED or that were treated and discharged (to home or to ward) within 4 hours.27–31
In Sweden, Muntlin et al announced that visiting times in the ED had to be shortened, for quality and safety reasons and reported that the performance target had to be met for 80% and 100%, by the end of the first 6 month and 1-year period, respectively.30
The other two papers included in this review reported the percentage of presenting patients that left the ED within 4 hour as National Emergency Access Target (NEAT).27 28 The studies were conducted in Australia: Woodward et al studied multiple models of care in an effort to improve different performance indicators of ED, including total number of ED presentations; number of admissions by specialty; and NEAT performance; total ambulance ramping time; total in-hospital mortality; ED 30 day representations; number of patients who did not wait to be seen.27
Khanna et al identified optimal inpatient discharge time targets to help hospitals reduce crowding, improve patient flow through the ED and balance staff workload28 Casalino et al31 in France determined the association between ED quality and input, throughput and output associated variables. The authors determined the daily percentage of patients leaving the ED in <4 hours as ED quality and performance indicator, in 1-year prospective observational cohort study. The results of this study indicated that the daily percentage of patients leaving the ED in <4 hours is associated with ED operating characteristics measuring input to the ED, ED and hospital variables measuring throughput and ED and hospital dependent variables measuring output. In this study, it is a useful tool to evaluate nursing teams performance in the process of care, and it probably reflects the work dynamics of all nursing teams.
Left without being seen
The percentage of patients leaving the ED without being seen by a doctor (LWBS) was considered an indicator of ED efficiency in eight articles, independently of the duration of the study. Duration of studies ranged from 16 days32 to 3 years.29 The studies evaluated: introduction of a team of doctors with specific training in emergency medicine working full time in the ED,33 the addition of a physician assistant acting as a triage liason providers,32 the addition of a physician–nurse supplementary triage assistance team,11 the redesigned of the ED operational nursing leadership,29 the impact of a multifaceted ED work flow redesign,23 the application of Lean principles of the Toyota production system13 and three reliability tools and strategies,24 the impact of nine flow designed models obtained by the combination of three ED flow models a three ED physical design typologies.12
Ninety per cent of the studies showed an improvement of LWBS rate. The value is correlated with patient care29 and medical attention [Ding et al34; Baker35].
Wiler et al’s study is the only study that has calculated besides LWBS, also the outcome LBVC defined as the percentage of patients left before visit complete.23
Only Ramos and Paiva, which evaluated the pre and post period after the introduction of a team of doctors with specific training in emergency medicine working full time in the ED, did not present the same trend of improvement, proving an initial worsening of LWBS rate. According to the author, this result is probably due to the introduction of a new triage system in the same time of the study ‘which may have led to an increase in dropouts in the less severe visits, which account for a high share of the ED’s volume [CRRNEU36; Martins37]
Mortality
Mortality was considered as an ED quality measure in four articles.11 22 33 38 In a pre–post design study, Ramos and Paiva33 compared two different organisational models of delivering emergency care in the same hospital: the first one in 2002 with doctors from various departments taking turns in the ED, and the second one in 2005–2006 with a dedicated team with specific emergency competences. The overall mortality rate was 0.4% in 2002, 0.6% in 2005 due to an influenza epidemic in Portugal and 0.5% in 2006. The study notices no relevant improvement of the mortality rate before and after the new model.
Claret et al38 in France conducted a before–after study analysing as a primary outcome the inpatient all-cause mortality rate of all patients admitted from ED before and after a new ED organisation and segmentation structure. In the before period, the overall mortality rate was 1.5% during winter 2011, 1.5% during summer 2011, 1.8% during winter 2012, while after the new ED layout, the mortality rate decreased to 1.3% during summer 2012.
The study shows that the mortality rate decrease was related to LOS and first medical contact (FMC) time reduction, and it reinforces the idea that the restructuring of ED has led to an improvement in patient’s outcome.
In a retrospective 1-year cohort study conducted in three different EDs in Taiwan, Li et al22 used mortality rate as an outcome to evaluate quality of care related to emergency physicians seniority. Mortality rate was defined as the number of deaths within the ED divided by the total number of ED patients. EPs were divided into three groups according to the seniority and the study showed a lower mortality rate of 0.02% in the senior EPs group than did the other two groups with a rate of 0.1% among non-urgent patients. After adjusting for patient’s age, sex, disease acuity and medical setting, the junior and intermediate EPs showed higher patient ED mortality rates than did the senior EPs (aOR ¼1.5, 95% CI: 1.02 to 2.20 and aOR ¼1.6, 95% CI: 1.04 to 2.43, respectively). A lower rate was observed among urgent patients with 2.9% for the senior group and respectively 4.3% and 4.5% for the other two groups. This finding indicates that the lower ED patient mortality rate that was observed among patients treated by the senior EPs might have been related to the clinical experience of these EPs and less related to an ED efficiency criteria.
Over a 26-week period, Cheng et al11 conducted a cluster, randomised-control trial evaluating the impact of a physician–nurse supplementary triage: one of the secondary outcomes observed was a 7-day mortality rate of 0.16% in the control group, 0.8% in the EP group, 0% in MDRNSTAT group and 0.06% in the combined group (EP +MDRNSTAT).
However, this study was not powered to detect mortality differences.
Waiting times
In studies where the waiting time was evaluated, different definitions were reported.7 11 16 17 30 31 39 The majority of included studies reported waiting times over levels of urgency, based on triage system for each ED.7 11 16 17 39 Waiting time to treatment was defined as, the time between a patient’s arrival at the ED or the commencement of their clinical care and measured in minutes.17 However, all studies evaluated the waiting time as a performance indicator of the EDs. Improta et al evaluated the efficacy of a lean thinking on ED, in Italy. The authors chose parameters, as ED performance measurements, primarily related to waiting times and service delivery depending on the triage colour code.11 They evaluated the time from the patient’s arrival at the ER until the patient leaves the ER. The authors reported, according to colour codes: the percentage of patients with green code not hospitalised with stay times ≤4 hour or examined within 1 hour, the percentage of patients sent to hospitalisation with stay times ≤8 hour, and percentage of patients with a yellow code examined within 30 min. Prang et al17 evaluated the waiting time to treatment, in different types of ED (major/large/medium/small hospitals), pre and post the application of government national healthcare reforms. The outcomes were observed across five triage categories and hospital peer groups. Waiting time to treatment was defined as the time elapsed between triage and the commencement of assessment and treatment. In another study conducted in Australia, the length of time patients wait to be treated after presenting at an ED was routinely used to measure ED performance, according to triage categories.38 In Netherland, Storm-Versloot et al compared waiting time, according to new MTS. The authors also identified five levels of urgency (red, orange, yellow, green and blue) with different timing of care, ranging from immediately to 4 hour).16 Casalino et al31 evaluated different time interval metrics as ED quality and performance indicator and determined the daily percentage of patients in the ED in <4 hours.
Other efficiency outcomes
Other outcomes of interest in selected papers were access block27 40 (ED LOS longer than 8 hours for an admitted patient), ambulance ramping27 and the delay to FMC.20 These outcomes were recognised as indicators of overcrowding. ED occupancy rate,28 40 readmission rate22 (patients who returned to the ED within the 72 hours after discharge), discharge rate22 33 (patients discharged home after being attended to in the ED divided by the total number of ED patients) and the bed utilisation rate11 (patients seen in an ED room in 24 hours) were served as an index of ED operational measures and quality indicators.33
The number of patient movements (number of movements a patient makes between ED locations of either waiting area or treatment space) was included as a balancing measure to account for patients' desire for resources to come to them rather than moving repeatedly, from Easter et al.12 Other papers reported outcomes that reflected a patient’s access to care. They were the level three escalation (patient on stretcher time greater than 30 min),27 the elapsed time between when the patient is ready to move to when the patient physically occupies a clean bed,41 waiting time to treatment or test,11 16 21 treatment within recommended time.17
Less frequently, other patient related outcomes have been studied, that is, satisfaction (patient) score13 20 42 and ED productivity and costs.33
Discussion
Overcrowding at the ED has become a serious problem in public health. The causes of overcrowding in EDs are multiple and intertwined. Increased delays in care have a major impact on ED flow.41 43 To analyse this issue, important variables, recognised as indicators of overcrowding, must be analyse to understand how to improve outcomes for ED patients.21 27
Indicators measure of the performance of the ED could support managing patients and decisions process. Time intervals measuring the work dynamics of medical and nursing teams are particularly important in measuring overall ED functioning.30
The LOS of the ED, door to provider and LWBS rate were the most common outcomes for measuring the EDs efficiency. Others outcomes applied for measuring efficiency were waiting time to assessment and discharge rates. Some studies showed how it is possible to make the ED more efficient through better management of the patient’s stay time. The length of time patients wait to be treated after presenting at an ED is routinely used to measure ED performance; however, triage waiting times need to take into account the mix of patients and the mix of hospitals. Waiting times could differ according to hospital, depending on not only the size of the hospital and the number of annual visitors, but also on the patient’s management capacity and the various structured and implemented processes analysed internally by the ED.
From our research, we concluded that it would be possible to increase the efficiency of services, reduce waste in terms of waiting times and improve the quality of the working environment for both patients and operators.9
A standard set applicable in the different EDs, of ED performance metrics could be uniformly implemented. However, these measures could be adopted in each country, establishing specific threshold levels as quality indicators.
The quality assessment of included studies in this review was not performed; however, this review aimed to evaluate the efficacy measures of ED departments. Based on our knowledge, this is the first review developed in Italy on ED efficiency and its major contribution to the scientific literature of surely having defined a mapping of the various indicators to evaluate the efficiency of EDs. In the future, it is indeed necessary to give uniform regulation and establish threshold values in order to make the ED more efficient.
A noteworthy element is given by the fact that the peaks of overcrowding in the emergency room (ER) determine undesirable and very significant consequences in terms of quality of care and safety for patients and operators.
These negative effects can manifest themselves in various ways; in particular, on patients:
Reduced efficiency of the evaluation and treatment processes.
Increase in waiting times.
Reduction of the protection of confidentiality.
Reduction of the level of satisfaction on the part of the patient.
Increase in the phenomenon of expulsion from the ER before the completion of the clinical course.
The effects on the operators can be summarised as follows:
Reduction of motivation and gratification.
Increase in the incidence of the burn-out phenomenon.
Increase in episodes of violence by users.
The analysis shows that in order to ensure that the problem is taken on board and allow for an adequate response to the needs of citizens who turn to the ER, a common commitment is required of all the institutional levels involved, the Company Strategic Departments and the Departments of the Hospital and Department, as well as of the various services that interact in the hospital setting and in the interface between the hospital and the territorial/home context. This is because the phenomenon cannot be considered an event exclusively pertaining to the ED, and therefore requires a multiplicity of systemic and local interventions, aimed at the correct planning of intrahospital care pathways.
In light of the above, it is quite clear that the management of the phenomenon of overcrowding in the ER does not represent a burden only for theER, but for the entire hospital and assistance system. Therefore, as part of health planning activities, provisions should be formulated to ensure the adoption in each healthcare and hospital unit of a plan for the management of overcrowding in the ED. We are convinced that this fulfilment will form a first useful requirement for the purpose of monitoring the degree of achievement of the result objectives assigned to the strategic departments.
Salient elements of the plan in question are:
The identification of indicators for the correct detection of the phenomenon.
The definition of the related criticality thresholds and timely response methods, proportionate to the levels of criticality detected, aimed at favouring/facilitating the process and hospitalisation phases, avoiding incongruous and uncomfortable stationing of patients in the ED.
The methods of ‘measurement’ of the phenomenon must be uniform in all ERs and be based on a set of static and dynamic indicators, the detection of which must be carried out promptly and in real time over the entire 24-hour period.
A further development is represented by the calculation of specific mathematical algorithms which, taking into account the same variables, are able to ‘photograph’ the current level of overcrowding.
All the aspects analysed in our study imply that, despite a clear view of the main issues of the ED, further research remains necessary to better understand the reasons for the differences in triage practices and the problem of overcrowding in the world, in order to analyse the structured processes within the ED and understand their dynamics.
Data availability statement
All data relevant to the study are included in the article or uploaded as supplementary information.
Ethics statements
Patient consent for publication
Acknowledgments
This article acknowledges the '2nd Sustainable Solutions for Growth SSG 2019 conference' for publishing portions of the work as an abstract in their conference proceedings.
References
Supplementary materials
Supplementary Data
This web only file has been produced by the BMJ Publishing Group from an electronic file supplied by the author(s) and has not been edited for content.
Footnotes
GI and MT contributed equally.
Contributors DDL: conceptualisation, methodology and writing—original draft. LD: methodology, writing—original draft, visualisation. LM: writing—review and editing, supervision. GS: formal analysis, writing—original draft. FC: formal analysis, writing—original draft. IS: resources, writing—original draft. GI: conceptualisation, writing—review and editing, supervision. MT: supervision, project administration.
Funding The authors have not declared a specific grant for this research from any funding agency in the public, commercial or not-for-profit sectors.
Competing interests None declared.
Provenance and peer review Not commissioned; externally peer reviewed.
Supplemental material This content has been supplied by the author(s). It has not been vetted by BMJ Publishing Group Limited (BMJ) and may not have been peer-reviewed. Any opinions or recommendations discussed are solely those of the author(s) and are not endorsed by BMJ. BMJ disclaims all liability and responsibility arising from any reliance placed on the content. Where the content includes any translated material, BMJ does not warrant the accuracy and reliability of the translations (including but not limited to local regulations, clinical guidelines, terminology, drug names and drug dosages), and is not responsible for any error and/or omissions arising from translation and adaptation or otherwise.