Article Text

Abstract
Background Studies assessing institutional performance regarding quality of care are frequently performed using single-level statistical analyses investigating differences between provider averages of various quality indicators. However, such analyses are insufficient as they do not consider patients’ heterogeneity around those averages. Hence, we apply a multilevel analysis of individual-patient heterogeneity that distinguishes between ‘general’ (‘latent quality’ or measures of variance) and ‘specific’ (measures of association) contextual effects. We assess general contextual effects of the hospital departments and the specific contextual effect of a national accreditation programme on adherence to the standard benchmark for albuminuria measurement in Danish patients with diabetes.
Methods From the Danish Adult Diabetes Database, we extracted data on 137 893 patient cases admitted to hospitals between 2010 and 2013. Applying multilevel logistic and probit regression models for every year, we quantified general contextual effects of hospital department by the intraclass correlation coefficient (ICC) and the area under the receiver operating characteristic curve (AUC) values. We evaluated the specific effect of hospital accreditation using the ORs and the change in the department variance.
Results In 2010, the department context had considerable influence on adherence with albuminuria measurement (ICC=21.8%, AUC=0.770), but the general effect attenuated along with the implementation of the national accreditation programme. The ICC value was 16.5% in 2013 and the rate of compliance with albuminuria measurement increased from 91.6% in 2010 to 96% in 2013.
Conclusions Parallel to implementation of the national accreditation programme, departments’ compliance with the standard benchmark for albuminuria measurement increased and the ICC values decreased, but remained high. While those results indicate an overall quality improvement, further intervention focusing on departments with the lowest compliance could be considered.
- accreditation
- statistics
- performance measures
- statistical process control
- diabetes mellitus
This is an open access article distributed in accordance with the Creative Commons Attribution Non Commercial (CC BY-NC 4.0) license, which permits others to distribute, remix, adapt, build upon this work non-commercially, and license their derivative works on different terms, provided the original work is properly cited, appropriate credit is given, any changes made indicated, and the use is non-commercial. See: http://creativecommons.org/licenses/by-nc/4.0/.
Statistics from Altmetric.com
Introduction
In 2000, the Danish state developed the National Indicator Project for monitoring and improving quality of care for a number of chronic conditions.1 By 2010, the National Indicator Project was expanded to include all clinical quality databases under one Secretariat, the Regions’ Clinical Quality Improvement Program (RKKP).1 Parallel to that, hospitals implemented three types of accreditation in different areas of the country between 2002 and 2015.2 All hospitals were accredited by the Danish quality model (DDKM) in 2010–2013 and reaccredited in 2013–2015.2
Literature indicates that diabetes is responsible for, or associated with, a wide range of chronic conditions including cardiovascular diseases.3 According to the Danish Diabetes Association, around 320 545 Danes (5.7% of the population in 2011) were diagnosed with diabetes, which is almost double the rate reported 10 years earlier. In 2004, Danish health authorities established the Adult Diabetes Database or Dansk Voksen Diabetes Database (DVDD) to register, monitor and support the quality of care in patients with diabetes.4 All hospital departments are audited annually against a set of standard benchmarks.4 Data on quality indicators are collected periodically for each hospital and aggregated for further analysis and release every year to the public and healthcare professionals. Hospital performance is compared with the national overall average for each indicator.
One of the mandatory high-volume processes is the albuminuria measurement that accounted for 12.8% of the total amount of diabetes care delivered in Denmark in 2010–2013. Albuminuria is a strong predictor of kidney impairment and cardiovascular disease in patients with both type 1 and type 2 diabetes.5 6 Thus, periodic monitoring of albuminuria is crucial in those patients.7 The DVDD audit commission recommended that hospital departments should measure albuminuria in at least 95% of patients with diabetes. Danish hospitals were audited against that benchmark.4
Several quality oversight schemes, including the National Indicator Project, use conventional single-level analyses for auditing healthcare providers’ performance. This approach does not properly consider the potential correlation of patient observations within the healthcare unit (ie, multilevel structure of data).8 9 Alternatively, multilevel regression analysis accounts for clustering of data while it allows a less biased estimation of uncertainty and leads to more appropriate ranking of healthcare providers.9 Further, in single-level analyses, the size of the contextual (eg, healthcare unit) variance is difficult to interpret as it is quantified in isolation from the total patient variation. In the multilevel regression analysis of individual-patient heterogeneity, the contextual variance is just a component of the total patient variance. The relevance of the healthcare unit variance is, therefore, expressed by the share of the total patient variance that is at the unit level.10 11 This variance partition coefficient or intraclass correlation coefficient (ICC) is fundamental in multilevel regression analysis,12 and it allows us to evaluate the general contextual effect of the healthcare unit10 11 that expresses the existence of both observable and not directly observable influences which conditions adherence (compliance) with clinical standards. The idea of general contextual effect is analogous to the concept of latent healthcare unit quality variable.13 14 An analogous approach was embraced by the committee that set the statistical methods for profiling Medicaid and Medicare services in the USA.15
Besides the formal analysis of components of variance, relevant information on the general contextual effect can also be obtained by using measures of discriminatory accuracy such as the area under the receiver operating characteristic curve (AUC) for the estimation of random (healthcare unit) effects in multilevel regression analysis.11 16 17 This AUC informs to what extent knowledge on a patient’s healthcare provider or department offers accurate information to discriminate between patients who will and those who will not get the desired process or outcome of care.
Processes of care are influenced by the hospital’s general context where the patients are treated. The concept of general contextual effect based on the variance partition coefficient or ICC can be traced to the work by Rodriguez and Goldman in 199518 (p. 74), among others, and it has been implicitly or explicitly applied over the last two decades in the evaluation of healthcare performance,10 11 19–25 but it did not reach a wider application in literature on hospital accreditation. Therefore, we apply multilevel regression analysis of individual-patient heterogeneity, which combines multilevel analyses of variance components with the AUC measure11 to quantify (1) the hospital departments’ general contextual effects and (2) the specific contextual effect of accreditation on adherence to the mandatory standard benchmark for measuring albuminuria in patients with diabetes.
We assumed that the accreditation process should support hospital departments to provide more homogeneous, equitable, high-quality care to all patients with diabetes regardless of gender or age. We hypothesised that accreditation would increase the overall rates of compliance with the albuminuria measurement standard and reduce the general contextual effects (ie, between-department variance) over time.
Population and methods
Danish Adult Diabetes Database (DVDD), population and patient variables
The DVDD audit commission collects information on 16 quality indicators for patients with diabetes.4 See online supplementary appendix SA1 for database inclusion criteria and completeness.
Supplementary file 1
Study data were extracted from the DVDD on 137 893 patient cases admitted to 57 specialised outpatient departments in 32 hospitals between 2010 and 2013. Patients were 18 years or older. Data on albuminuria measurement are coded either as ‘1 for measured’ or ‘0 for not measured’. Confounding factors are not usually a concern in analyses of process indicators that must be recorded for all eligible patients.26 However, to investigate potential inequity in measuring albuminuria, we included gender as a dummy variable and age (in years) entered as a continuous variable in the statistical analyses.
Hospital accreditation variable
Accreditation is a dummy variable with four groups of departments (coded 1–4) categorised by duration and type of accreditation implemented by each hospital in Denmark. All hospitals in Copenhagen were accredited by the Joint Commission International (JCI) Accreditation programme during two different periods (groups 1 and 2). Group 1 included departments at five hospitals with the longest continuous experience with accreditation, as they were accredited by the JCI between 2002 and 2014, then by the mandatory Danish Quality Model (DDKM) between 2012 and 2015. We assigned group 1 as the reference group in comparisons. Group 2 included departments at seven hospitals that were accredited by the JCI between 2011 and 2014, then by DDKM in 2012–2015. Group 3 included departments at four small acute facilities in southern Denmark that were accredited by the British Health Quality Service model (HQS) in 2003/2004. These facilities merged into one larger hospital and were reaccredited by HQS in 2007, followed by DDKM between 2010 and 2015. Hence, groups 1–3 had DDKM as an extra dose of accreditation.2 Group 4 included departments at 19 hospitals accredited for the first time by DDKM in 2010/2011 and in 2015. See online supplementary appendix SA2 for hospital accreditation timeline.
Supplementary file 2
Statistical analyses
We applied multilevel logistic and probit regression analyses of variance25 27 with patient cases with diabetes nested within departments in order to model albuminuria measurement. See online supplementary appendix SA3 for equations, functions, models’ estimation and fit, and statistical notes.
Supplementary file 3
We developed three consecutive models (see below). For every model, we obtained two different measures of general contextual effects: (1) the ICC and (2) the AUC value. The ICC expresses the share of the total patient variation in the underlying propensity of being measured for albuminuria that is at the department level. The AUC is a measure of discriminatory accuracy11 16 25 28 that measures the ability of the model to correctly discriminate between patient cases with or without a measurement for albuminuria.29
As quality profiling is carried out annually, we made separate analyses for every year (2010‒2013).
Model 1: quantifying the general contextual effect (ie, hospital department)
Using hospital department ID codes, we fit model 1 as an empty two-level logistic regression model. Model 1 includes no explanatory variables (fixed effects). In this model, patient observations (albuminuria measurements) at the first level of the model are nested within hospital departments at the second level of the model. The model includes only a random intercept for the department level.
Model 2: quantifying specific contextual effect (ie, accreditation)
Model 2 provides a way to understand the mechanism underlying the observed department general effect in model 1. Therefore, to quantify the specific contextual effect, we added the department variable on accreditation as a fixed effect. In model 2, besides obtaining the ORs for the type of accreditation, we calculated the proportional change in variance as the percentage of department variance in the empty model 1 that was explained by adding accreditation in model 2.
Model 3: investigating potential inequities
In model 3, we wanted to investigate whether, aside from accreditation, the observed department variation in measuring albuminuria could be due to potential inequities (disparities)30 in care induced by patient age or gender. We therefore extended model 2 by adding patient gender and age as fixed effects. To calculate the proportional change in variance between models 1 and 3, the variance of model 3 was rescaled to get an accurate value (see Hox et al,31 p. 136).
We also aimed to determine the value-added of the information on gender and age to accurately classify the patients who will or will not have measured albuminuria over and above the department effects. Thus, we calculated the difference between the AUC values of models 3 and 1.
We performed the analyses using MLwiN V.2.22.32
Ranking of departments
For each year and model, we created a plot ranking departments according to their averages and their 95% CIs in the logarithmic OR scale. Further, we used the information provided by the ICC and the AUC values to interpret the league tables.11 25 33 34
Results
Descriptive statistics
Table 1 shows that, overall, the compliance rate of albuminuria measurement increased between 2010 and 2012, to 96% in 2013. However, comparing 2013 with 2010, this increase was primarily due to the improved compliance in groups 1 and 2 with departments in hospitals accredited by JCI and DDKM.
Descriptive statistics for patient cases with diabetes and hospital departments included in the study (2010–2013) (hospital departments are grouped by type of implemented accreditation)
Group 4 (accredited only by DDKM) maintained a high compliance rate throughout the whole study period. Group 3 (accredited by HQS and DDKM) also had a high compliance rate, but it slightly decreased in 2013.
Most of the patients were from departments that were accredited only by DDKM (group 4). During the study periods, most of the patients were men and the median age was similar in the four groups.
Measures of association
Table 2 shows that there were no substantial gender differences in measuring albuminuria. However, older patients had a slightly higher chance for having an albuminuria test than the younger ones.
Measures of association (fixed effects) obtained by two-level (patient and hospital departments) multilevel logistic regression (models 2 and 3) modelling measurement of albuminuria upon contact with hospital departments by patients with diabetes (values are ORs, 95% confidence intervals)
We observed a clear association between department accreditation status and patient albuminuria measurement (table 2). However, the ORs for department accreditation were dissimilar. In 2010–2011, patients admitted to departments in hospitals accredited by HQS and by DDKM for the first time in 2010 (group 3) had, on average, better chances for having an albuminuria test than patients admitted to departments in hospitals that experienced JCI accreditation since 2002 (reference group 1). On the other hand, in 2012, in comparison with group 1, patients treated at departments in hospitals accredited for the first time by JCI in 2011 and DDKM in 2012 (group 2) had higher odds for albuminuria tests. Finally, in 2013, patients treated at departments in hospitals accredited only by DDKM (group 4) with no previous experience with international accreditation showed a higher OR than patients admitted at departments in group 1. We note that this latter group of departments (group 4) was in hospitals that were either preparing for the second cycle of DDKM accreditation in 2014 or were already reaccredited for the second time by DDKM in 2013.
Measures of variance and discrimination
Table 3 shows that, as expected, the ICClogit values obtained from the multilevel logistic regression models were slightly higher than the values obtained from the probit models (ICCprobit).
Measures of variance (random effects) obtained by two-level (patient and hospital departments) multilevel logistic regression (models 1, 2 and 3) modelling measurement of albuminuria upon contact with hospital departments by patients with diabetes (variance measures are obtained separately using the logit and probit link functions and expressed as median values and 95% credible intervals)
Using the conservative measures of variance obtained from the multilevel probit regression models, we found that the component of the total variance at the department level (ie, the general contextual effect) decreased over time. We observed the largest department general effect in 2010 (ICC 21.8%), and the lowest in 2012 (ICC 12.3%), while there was a slight increase in the department general effect in 2013 (ICC 16.5%).
In 2010, accreditation explained more than one-fourth of between-department variance (proportional change in variance=27.39%). However, between 2011 and 2013, accreditation explained practically none or only a very minor part of the between-department variance (see table 3). In comparison with model 2, which includes only the contextual variable on accreditation, adding patient characteristics (gender and age) in model 3 did not explain much of between-department variance for all years. Rescaling model 3 variance did not substantially change these findings.
Table 4 indicates that the highest values for AUC were observed for 2010 and 2013. As expected, adding accreditation as a contextual variable in model 2 did not improve AUC values in comparison with the empty model 1 which includes only the random intercepts for the department level. These values were almost unchanged when adding information on gender and age in model 3.
Measures of the area under the receiver operating characteristic curve (AUC) along with their corresponding 95% credible intervals
League tables
Figure 1 shows department differences in compliance with albuminuria measurement (2010–2013). The figure also indicates the values of the intraclass (department) correlation for measuring albuminuria (see models 1 and 2 in table 3). We present league tables for models 1 and 2 only, as adding gender and age in model 3 did not explain much of between-department variation.
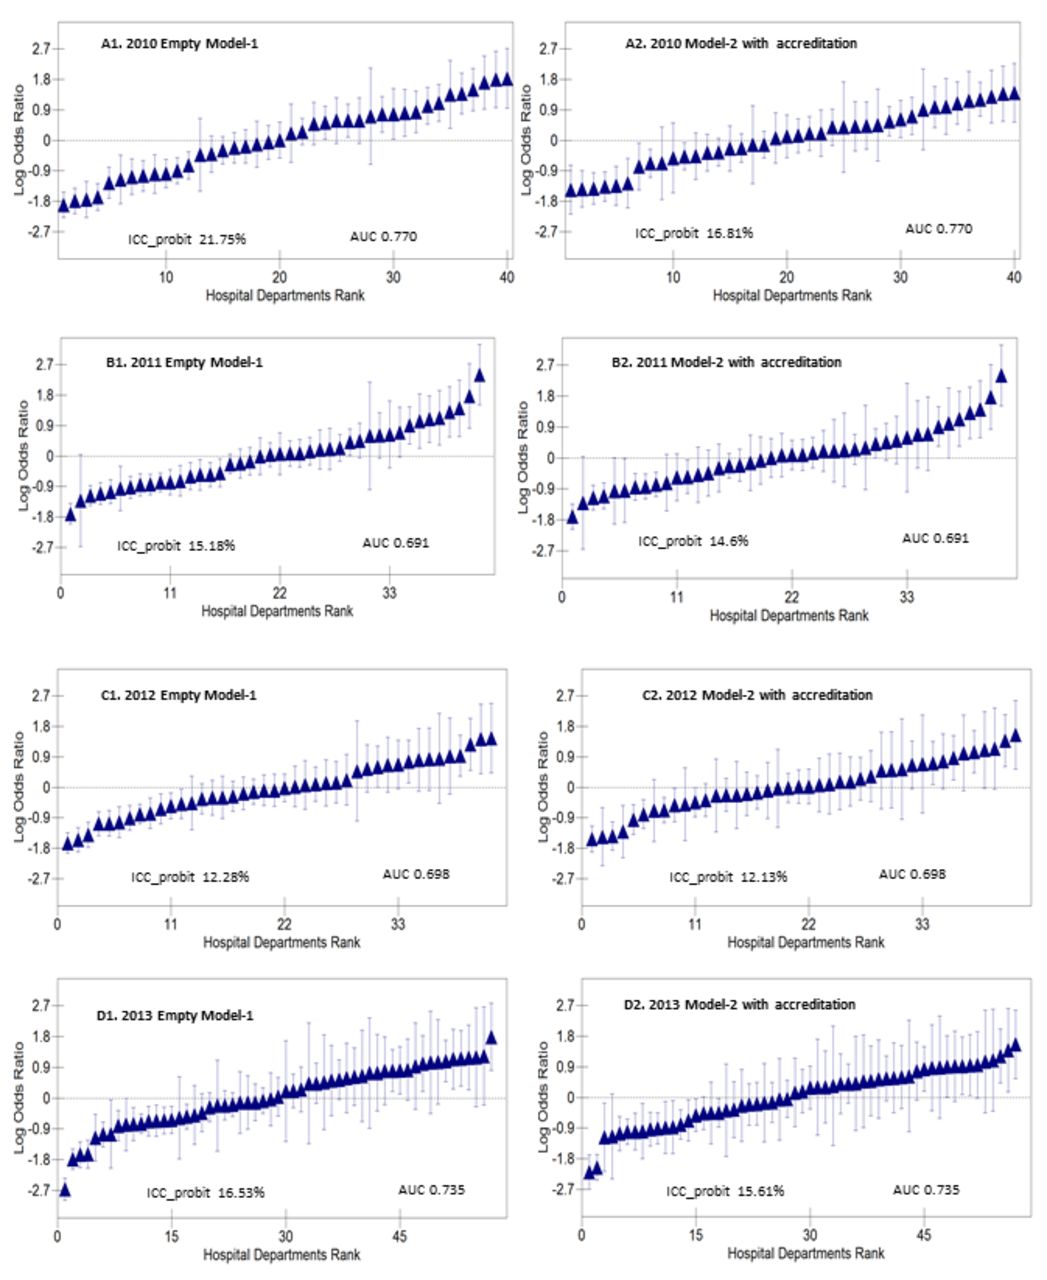
League tables of the hospital departments during the study period (A–D). Hospital departments were ranked by logarithm ORs (ie, shrunken residuals) with 95% confidence intervals (vertical lines) of measuring albuminuria using the overall average (study population’s mean) as reference. AUC, area under the receiver operating characteristic curve; ICC, intraclass correlation coefficient.
Figure 1 shows that between 2010 and 2013 the 95% CI around a number of departments' averages did not overlap the overall mean of patient cases (study population’s mean). However, in 2013, we observed an increased degree of uncertainty of the ranking which expresses itself as large overlapping of the 95% CIs.
Discussion
We quantified both the general contextual effect of the hospitals and the specific contextual effect of accreditation on compliance with guidelines for albuminuria measurement (as per the standard benchmark) between 2010 and 2013. We also quantified the discriminatory accuracy of knowing where the patient was treated (ie, departments) for classifying diabetic patients who were or were not measured for albuminuria. As hypothesised, when national accreditation was progressively implemented, the overall rate of compliance with albuminuria measurement increased and general contextual effect of the department decreased, as indicated by the reduction in ICC and AUC values. These results suggest an improved performance along with an increased homogeneity in quality of care in these departments. However, department general effect remained high at the end of the observation period (ICC=16.5%), suggesting a potential need for further improvement in departments with the lowest compliance rates.
In practice, considering albuminuria measurement, empty multilevel models with no explanatory variables are appropriate for profiling hospital departments as processes of care are under full control of providers. In this case, there is no need to account for patient case-mix as confounding is not a major problem by definition.35 36 The empty model, which includes only patient observations within departments, informs on the ceiling value of the department variance and its related general contextual effect.25 37 If differences in the patient measurements of albuminuria are conditioned by the general context of the level of care (ie, indicated by meaningful ICC and AUC values), then the department care is heterogeneous. This indicates that the patient measurements of albuminuria were dependent on the department where the patient was treated.
In our study, the empty models had a rather good discriminatory ability, in reference to AUC values. Interpreting the ICC and AUC values driven from the empty models jointly with department league tables indicates a substantive department variance. This warrants ranking of departments, so departments with low performance can be identified and targeted for further improvement, such that focused quality interventions might support below-average departments to increase their compliance rates. Hence, the general contextual effect (ie, differences between departments) could be further reduced, making the department performance more homogeneous. This premise is supported by the literature where a low provider variance would indicate a homogeneous clinical practice for a given level of care.10 25 38
The ICC values were highest in 2010, where accreditation explained some amount of between-department variance (proportional change in variance=27.39%). Yet, in 2011–2013, with the decrease in the ICC values, it seems that accreditation could no longer explain much of the department variance.
In 2010, hospital departments in group 3 that experienced two different models of accreditation (HQS and DDKM) showed better compliance rates (OR values) than other departments. This could indicate that the ‘extra dose’ of accreditation contributed to an improved compliance rate by this group of departments. We could speculate that this group of departments could have benefited from their hospitals’ experience with international accreditation (HQS).
In 2010, departments accredited only by DDKM (group 4) showed a better compliance rate (OR values) than departments accredited by JCI and DDKM (groups 1 and 2). It seems that DDKM accreditation activities improved department performance in this group.
Paradoxically, departments at hospitals that experienced accreditation by JCI since 2002 (group 1) did not show any superior performance (OR values) in comparison with other departments. Nevertheless, by 2010, departments in group 1 had already experienced the third accreditation survey by JCI in 2008 and were preparing for the fourth JCI survey in 2011 and the first DDKM survey in 2012. Thus, concerning the albuminuria indicator, these departments might have approached a ceiling level of performance which could not be further improved. Still, the required benchmark (95%), itself, is a ceiling level of compliance. Similar findings reported in literature, a study found that after the third/fourth accreditation cycle, hospital performance tends to stagnate as accreditation activities become less challenging.39
In 2010–2013, the department was a relevant level for understanding differences in a patient’s measurement of albuminuria. However, considering department performance, it seems that accreditation by itself did not play a major (quantifiable) role during 2011–2013 as the proportional change in variance was relatively low. Interpreting only the ORs for the association between the accreditation type and albuminuria measurement for 2011–2013 would give misleading information on the role of accreditation. Yet, there might be a complementary influence for accreditation that could be identified with qualitative evaluations.40 41
Healthcare professionals tend to selectively implement and report elements of care that they perceive as important, but which are not necessarily part of the regulatory or accreditation mandates.41–43 Disparities in care could therefore emerge, which could, in turn, be reflected in hospital performance. Some studies reported that elderly and female patients with diabetes might experience less than optimal care.44–47 However, our results did not reveal any relevant inequities in care. In reference to albuminuria measurement, we can imply that quality improvement activities might have had a collective positive influence that shaped the Danish hospital departments as an equitable system.
Our results agree with previous findings in conventional literature. Several studies reported that accreditation along with audit and feedback have the potential to influence and improve the delivery of clinical activities30 48 49 such as measurement of albuminuria.30 Hinchcliff et al41 reported that accreditation can improve compliance with evidence-based processes of care. Further, an expert consensus report estimated that parallel to implementation of public reporting, feedback and pay for performance, among other strategies,30 most commercial acute facilities in the USA increased compliance rates with a number of mandatory diabetes quality standards (including microalbuminuria) approaching 90%.30
We cannot rule out other influences beyond accreditation which could provide an alternative or complementary explanation for our results. Nevertheless, processes of care, such as the measurement of albuminuria, are under hospital control and hence are assumed to be sensitive to quality improvement interventions that target the hospital system in a given country.49–53 Based on the literature,22 25 41 54 55 it is reasonable to believe that the trend of increased compliance rates parallel to the implementation of the national accreditation (the Danish quality model) might actually reflect a behavioural change in diabetes care (ordering tests for albuminuria) by healthcare professionals.
In essence, the ultimate goal for performance monitoring and accreditation schemes is to encourage and guide providers to comply with evidence-based processes and standards of care to improve quality of clinical services.55 Processes of diabetic care provide needed disease control activities against a set of risk factors30 (eg, high levels of albuminuria) which in turn improve clinical outcomes (eg, prevention of kidney impairment).5 7 Process-based indicators are considered to be direct sensitive performance measures for hospitals.56 Such indicators measure clinical activities delivered to all eligible patients.56 Process measures have direct interpretation, usually do not require risk adjustment and are actionable (ie, used for quality improvement).56 Yet, process indicators could be manipulated and some measures may not be easily linked to patient outcomes.56 However, any potential risk of gaming should be detected through the quality validation and controls routinely carried out by the health authorities to audit hospitals in Denmark.1
It is imperative to recognise that quality systems might be linked to diverse forms of organisational learning curves, non-linear butterfly effects57 or even be confined to a ‘hibernation phase’ before showing any potential effects on processes and outcomes of care.58 59 The hospital (department) variance could decrease, increase or stay the same over different observation periods and for different quality indicators.58 59 Regardless of circumstance, careful assessment of the accreditation effect on hospital performance should be carried out for different conditions, indicators and at different phases of implementation.
A main limitation of our study is the short observation period, as data completeness was deficient before 2010. Nevertheless, we included all departments that handle patients with diabetes and completeness of data on albuminuria measurements is approaching 100% in the database. Yet, our results concern Danish hospitals, so these cannot be directly generalised to other healthcare systems.
Several studies have employed multilevel analyses for evaluating hospital accreditation both in Denmark60–62 and in other countries.63 64 However, those studies consider variance and clustering of patient outcomes within hospitals as a sort of noise that should only be accounted for in the statistical analysis to obtain correct estimations of the SE around the regression coefficients.25 In contrast, we consider variance and clustering as very relevant for assessing institutional performance and the influence of accreditation programmes on patient care. Traditional estimates of specific contextual effects based on average measures of association (eg, ORs for accreditation groups) provide insufficient information if they are not accompanied by measures of general contextual effects (ie, ICC).65 Besides, compared with traditional single-level analyses, our study also provides more accurate department ranking. Our investigation, thus, provides improved information on the effect of accreditation in Denmark than that presented in previous publications.62–64
By applying our analytical approach to real-life evaluations of hospital performance, clinicians and policy-makers can assess whether or not outcomes of care are in compliance with clinical standards. If not, they can use quantitative information on the general contextual effect to plan for either a focused quality strategy targeting inconsistent performance or a compressive quality strategy targeting homogeneous poor performance. Such knowledge cannot be directly attained using traditional profiling models that do not report measures of provider contextual effects.10 25 66 67
Conclusion
Our multilevel approach represents an improved method for evaluating healthcare provider performance and the comparative effectiveness of large-scale interventions. Applying this approach, we analysed compliance with the mandatory standard of measuring albuminuria in patients with diabetes and the comparative effectiveness of hospital accreditation in Denmark on this process indicator. Accreditation appeared to be correlated with an overall improvement in quality expressed by an increased compliance rate across time and increased department performance homogeneity. The general contextual effect at the end of the observation period remained high, which suggests focused interventions targeting departments with the lowest compliance rates.
References
Footnotes
Contributors NG, AF and JM have the initiative of the study. NG acquired the data. NG performed the analyses . NG and JM wrote the original manuscript. NG and AF provided technical information on quality of care and accreditation in Denmark. JM developed the methodology. All the authors have contributed to the design and interpretation of the results and revised the last version of the manuscript.
Funding This work was supported by the School of Health and Medical Sciences, University of Copenhagen ‘Det Sundhedsvidenskabelige Fakultet, Københavns Universitet’—PhD Travel Grant for NG as a PhD candidate and by a grant from the Swedish Research Council (VR) (no. 2013-2484, JM).
Competing interests None declared.
Patient consent Not required.
Ethics approval Researchers applying to access anonymous data from the Danish Clinical Registries Program (RKKP) do not need special ethical approval by the data protection agency in Denmark. Access to the Danish Adult Diabetes Database (DVDD) data was granted after submission of a request to the secretariat of RKKP. The RKKP constructed the research database and delivered it to the first author (NG) without the personal identification numbers to ensure the anonymity of the patients.
Provenance and peer review Not commissioned; externally peer reviewed.
Data sharing statement No additional data are available.