Article Text

Abstract
Background and objectives Structured and systematised checklists have been shown to prevent complications and improve patient care. We evaluated the implementation of systematic safety checklists in our neurocritical care unit (NCCU) and assessed its effect on patient outcomes.
Design/methods This quality improvement project followed a Plan–Do–Study–Act (PDSA) methodology. A checklist for medication reconciliation, thromboembolic prophylaxis, glycaemic control, daily spontaneous awakening, breathing trial, diet, catheter/lines duration monitoring and antibiotics de-escalation was implemented during daily patient rounds. Main outcomes included the rate of new infections, mortality and NCCU-length of stay (LOS). Intervened patients were compared with historical controls after propensity score and Euclidean distance matching to balance baseline covariates.
Results After several PDSA iterations, we applied checklists to 411 patients; the overall average age was 61.34 (17.39). The main reason for admission included tumour resection (31.39%), ischaemic stroke (26.76%) and intracerebral haemorrhage (10.95%); the mean Sequential Organ Failure Assessment (SOFA) score was 2.58 (2.68). At the end of the study, the checklist compliance rate throughout the full NCCU stays reached 97.11%. After controlling for SOFA score, age, sex and primary admitting diagnosis, the implementation of systematic checklists significantly correlated with a reduced LOS (ß=−0.15, 95% CI −0.24 to −0.06), reduced rate of any new infections (OR 0.59, 95% CI 0.40 to 0.87) and reduced urinary tract infections (UTIs) (OR 0.23, 95% CI 0.09 to 0.55). Propensity score and Euclidean distance matching yielded 382 and 338 pairs with excellent covariate balance. After matching, outcomes remained significant.
Discussion The implementation of safety checklists in the NCCU proved feasible, easy to incorporate into the NCCU workflow, and a helpful tool to improve adherence to practice guidelines and quality of care measurements. Furthermore, our intervention resulted in a reduced NCCU-LOS, rate of new infections and rate of UTIs compared with propensity score and Euclidean distance matched historical controls.
- quality improvement
- health services research
- checklists
- critical care
Data availability statement
Data are available on reasonable request. Anonymised data as well as the statistical plan and R coding, not published within this article will be made available by request from any investigator.
This is an open access article distributed in accordance with the Creative Commons Attribution Non Commercial (CC BY-NC 4.0) license, which permits others to distribute, remix, adapt, build upon this work non-commercially, and license their derivative works on different terms, provided the original work is properly cited, appropriate credit is given, any changes made indicated, and the use is non-commercial. See: http://creativecommons.org/licenses/by-nc/4.0/.
Statistics from Altmetric.com
WHAT IS ALREADY KNOWN ON THIS TOPIC
Systematic checklists have proven useful in several healthcare areas. Nonetheless, there is scant evidence in the neurocritical care field.
WHAT THIS STUDY ADDS
This study demonstrated that implementing systematic checklists in a neurocritical care unit reduced the length of stay and infection rate of patients compared with propensity score and Euclidean distance-matched controls.
HOW THIS STUDY MIGHT AFFECT RESEARCH, PRACTICE OR POLICY
Using systematic checklists in the neurocritical care daily workflow is a safe, feasible and cost-effective intervention that improves patient outcomes and might reduce costs.
Introduction
Dedicated neurocritical care units (NCCU) have improved outcomes in acutely ill patients with life-threatening neurological diseases.1–4 This is due to optimisation of patient care through a subspecialised multidisciplinary team, standardised intensive care unit (ICU) processes of care and the implementation of advanced neuromonitoring.5–7
The management of NCC patients is complex. It requires a careful balance and monitoring of the brain and other multisystemic organ functions, thus warranting a structured and systematised delivery of care to improve patient safety and clinical outcomes.8
Systematic checklists have been shown to reduce complications and errors in various fields such as aeronautics, engineering, manufacturing and the construction industries.9 In healthcare, systematic checklists are widespread across several specialties, predominantly in the surgical field.10–16
In the ICU setting, daily rounding safety checklists have been associated with increased adherence to guidelines, higher compliance with prophylactic measures, reduced rates of central line-associated bloodstream infections (CLABSI) and decreased ventilator days.17 Nonetheless, most of these studies have been developed in medical, surgical and trauma ICUs.17–19 Therefore, we conducted a quality improvement (QI) project aimed primarily to evaluate the implementation of a structured, standardised daily rounding checklist in our NCCU over 1 year. Furthermore, we assessed the effect of this intervention on patient length of stay (LOS), infection rates and mortality.
Methods
This QI project followed a Plan–Do–Study–Act (PDSA) approach,20 a measurement-driven process widely accepted in healthcare21 22; and the report followed the Revised Standards for QI Reporting Excellence guidelines.23
The project was carried out at a tertiary referral-based academic centre from 18 November 2019 to 31 August 2020. All patients admitted to the NCCU during the established period were eligible for enrollment. The NCCU is a dedicated 20-bed ‘closed’ ICU for patients with high acuity critical neurological diseases. It is staffed daily with a board-certified neurointensivist that leads a team of NCC fellows, neurology and neurosurgery residents, NCCU-trained nurse practitioners and nurses, pharmacists, and other supporting clinical and research staff. The patients in this QI study were not concomitantly enrolled in any other clinical trial, nor were other QI initiatives implemented while this QI project was conducted. Patients admitted to the NCCU included those requiring medical, surgical and a combination of both therapeutic approaches. Our hospital maintains a database for all NCCU admissions that comprises baseline demographics, medical history, laboratory evaluations, imaging data, rate of infections, NCCU-LOS, hospital-LOS, disposition and mortality. From this database, we selected all consecutive patients from the prior year (from 1 October 2018 to 31 October 2019) as historical controls.
A checklist that included core elements of good intensive care was implemented during daily patient rounds, and its completion was attested in the daily clinical note. The items included in the safety checklist (online supplemental appendix 1) were discussed and agreed on a consensus among four neurointensivists, two NCC fellows, two neurology residents and one NCC research fellow. They were based on checklists already established for critical care patients.24 25 During the initial phases of the study, when the checklists were being actively modified before settling with the final version, everyone in the team (ie, NCCU nurses, nurse practitioners and clinical pharmacists, among others) provided feedback concerning the items included in the checklists and the logistics of incorporating them into the daily workflow. A template for our clinical checklist was incorporated into the electronic medical record (EMR) and added as a daily note by the NCC fellows during rounds. The checklist was completed in real time in the presence of the NCC team, which collaborated on identifying and addressing any unattended healthcare issues with patient care. The research team reviewed the NCCU census list daily and verified the completion of the safety checklists notes in the patients’ charts.
Supplemental material
As part of our PDSA approach, our study included a preliminary ‘pilot period’ (from 18 November 2019 to 15 December 2019) to evaluate the feasibility of routinely implementing the checklists during daily rounds. Additionally, this period served to encourage stakeholders involved (ie, attendings, fellows, residents and nurses) to participate in applying the checklists and to dedicate time to run them carefully and to attest their completion in the chart. During the initial phases of the PDSA process and to standardise this procedure, the NCC fellows were trained to fill and register the checklist in the EMR adequately. During the pilot period, the development of the checklists began with a checklist predominantly based on good general ICU care parameters. However, during each PDSA iteration (first every week and later monthly), every Monday, we would reassess the checklist and include items that better suited our specific patient population needs. At the same time, some items could have been included but did not pertain to our NCCU patients and therefore were removed. The checklist was then used during the week and reassessed the contents the following Monday. By the end of the pilot period, all of the NCCU team involved were satisfied with the checklist (see online supplemental appendix 1) and agreed to use this final version for the rest of the study.
We evaluated the completion percentage of the safety checklists weekly during the pilot period and reviewed potential issues that precluded full compliance. We implemented strategies to improve adherence and update the checklist items continuously during this period. This process was iterated multiple times, resulting in the final version of the checklist later implemented in the rest of the trial.
As COVID-19 cases increased in our institution, by the end of August 2020, our NCCU was transformed into a COVID-19 unit; at which time, we halted any further study enrolment to prevent potential confounding and did not include any patients with COVID-19 in this study. We compared the study outcomes with those obtained from historical controls that had not been exposed to the implementation of the safety checklists.
Our QI project aimed primarily to evaluate the feasibility of incorporating a structured, systematised safety checklist into the NCCU workflow. Hence, our primary outcome measure was the checklist implementation compliance rate. Our secondary outcome measures were NCCU-LOS, infections and mortality rates as the quality of ICU-care indicators.1 3 4 To assess the completeness and accuracy of the data, an independent research team was responsible for verifying that all checklist documentation accurately reflected patient care in the EMR note.
Statistical analysis
We used descriptive statistics to summarise patient demographics and clinical characteristics. For continuous variables, we reported means and SD in parentheses and medians with their respective 25th and 75th percentiles. Absolute frequencies of categorical variables were reported as percentages. To compare groups (historical controls vs intervention group), we used an unpaired Student’s t-test with unequal variances and Wilcoxon-Mann-Whitney to compare means and medians. We used Fisher’s exact test for comparing proportions between the two groups.
Outcomes assessed in this study included checklist compliance, NCCU-LOS, rate of infections (categorised as overall new infections, urinary tract infections (UTI), pneumonia, CLABSI, catheter-associated UTI (CAUTI), other new infections (that included unidentified sources)) and mortality. We reported the unadjusted and adjusted outcome differences. We fitted a negative binomial generalised linear regression model for the adjusted analyses to account for overdispersion in NCCU-LOS (ie, variance>mean). This model evaluated the effect of the intervention on NCCU-LOS while controlling for disease severity (as indexed by the Sequential Organ Failure Assessment (SOFA) score), age, sex and reason for admission (ie, primary admitting diagnosis). Similarly, we fitted logistic regression models for each category of infection and mortality rates, using the treatment group as the focus of analysis while adjusting for SOFA score, age, sex and primary admitting diagnosis. According to the type of regression model, we reported adjusted regression coefficients and ORs and their respective 95% CIs. We checked for possible interactions and collinearity among the covariates for both types of models. Significance for all statistical tests was established at a two-sided α level of 0.05.
Matching of patients and controls
We conducted sensitivity analyses to assess the robustness of the results obtained in the adjusted analyses. Given the non-randomised nature of our study design and the fact that our intervened patients were compared with historical controls from data already collected from previous years, we applied propensity score and Euclidean distance matching methods to find the best control matched pair for each treated patient. A matching assessment was conducted while blinded to the outcomes to reduce bias when selecting the best matching method and used a standardised mean difference (SMD) (ie, the difference in means in units of SD) threshold of 0.1026 to establish adequate covariate balance after matching.
Propensity score matching
To estimate propensity scores, we used logistic regression to regress treatment status (checklist vs non-checklist) on the measured baseline covariates (ie, age, sex and primary admitting diagnosis), followed by matching on the propensity score using the nearest neighbour matching approach without replacement and specifying a calliper distance restriction of 0.25.27 28 Other methods for propensity score matching were attempted, including genetic and optimal propensity score matching29 that failed to provide adequate covariate balance.
Euclidean distance matching
For each category of primary diagnosis, we performed Euclidean matching of nearest neighbours in terms of a two-dimension space distance of age and SOFA score.30 31 A linear sum assignment problem (LSAP) algorithm, also known as Munkres algorithm,32 was employed as it gives consistently lower overall distances between matched pairs. As suggested by Tukey, a threshold to identify outliers was calculated based on quartiles.33 Matched pairs with distances greater than this threshold were eliminated. Online supplemental figure 1 and online supplemental tables 3−5 compare matching methods.
Once excellent balance had been achieved after matching, the analysts (GT-A and PM) were unblinded to the outcomes. These were compared while accounting for the reduced variance of the matched samples. We used paired t-test and Wilcoxon-signed rank test to compare the mean and median of LOS, respectively. For categorical outcomes (ie, infection rates and mortality), we reported the absolute risk difference (ARD), relative risk (RR), RR reduction (RRR) and number needed to treat (NNT) along with the McNemar’s test for the significance of the comparison between matched group proportions.
Missing data
Both case and control groups presented varying proportions of missing data, only observed across variables required for SOFA score calculation and mainly involving bilirubin levels (online supplemental figure 2). Except for bilirubin, all other variables had <5% of missing values. We assumed missing data were not at random (MNAR) as patients with increased severity of disease more often had complete data to estimate the SOFA score. Thus, we employed the MNAR version of the multivariate imputation by chained equations (miceMNAR () in R) that generates multiple imputations for incomplete multivariate data.34 Imputation of data used a random forest method for each variable. After imputation, we visually confirmed the similarity of the original distributions versus the imputed data (online supplemental figure 3).
All statistical analyses were conducted in R (R Foundation for Statistical Computing, Vienna, Austria, V.4.1.1).
Patient and public involvement
Patients and the public were not involved in this research’s design, conduct, reporting or dissemination plans.
Results
Primary outcome
Four hundred and eleven case patients with 651 controls were included. No significant differences were observed in the average age of the controls (61.25 (17.57) years) when compared with the intervened (61.34 (17.39) years) patients, and close to 50% were males in both groups. Statistically significant differences were seen when comparing the main reasons for admission, which included tumour resection (14.13% and 31.39%, p≤0.001), ischaemic stroke (33.64% and 26.76%, p=0.02), and intracerebral haemorrhage (ICH) (16.74% and 10.95%, p=0.009) for control and intervention groups, respectively. No significant differences resulted from the comparison of the mean SOFA score in the controls (2.84 (2.78)) versus the intervention group (2.58 (2.68)). Table 1 summarises all the comparisons made across baseline characteristics between groups.
Comparison of baseline characteristics between control and intervention groups
The checklist was modified five times during the pilot period before agreeing on the final version (online supplemental appendix 1). Throughout the whole study, strategies to facilitate the implementation of the checklists were continuously discussed among the NCC team; those found to improve better compliance included:
The application of the checklists by the NCC fellows with an immediate verification for completion made by the NCC residents. In addition, any required orders would be placed for the interventions to comply with the checklists.
Daily verification of the attested checklists according to the NCCU daily census, done by the NCC research fellow.
A weekly evaluation of the overall workflow and checklist compliance performed by the NCCU on-service attending and the nursing staff.
These strategies allowed us to accomplish a checklist compliance rate that remained above 95% throughout the study, including the pilot period, and an overall daily average compliance rate of 97.11%.
Secondary outcomes
Prematching outcome comparison
The mean (SD) NCCU-LOS was significantly shorter in the intervention group when compared with controls (4.23 (3.93) vs 5.12 (4.65), p=0.001). Likewise, the intervention group showed a significant reduction in the overall new infection (19.66% vs 12.65%, p=0.003) and UTI rates (5.38% vs 1.46%, p=0.001) (figure 1). There were no significant differences between groups when comparing other categories of infections or mortality rates (figure 1). After adjusting for severity of disease (as indexed by SOFA score), age, sex and primary admitting diagnosis, the implementation of systematic checklists remained significantly associated with a reduced NCCU-LOS (ß=−0.15, 95% CI −0.24 to −0.06), reduced overall new infection rate (OR 0.59, 95% CI 0.40 to 0.87) and reduced UTI rate (OR 0.23, 95% CI 0.09 to 0.55). See online supplemental tables 6−11 and online supplemental figures 4−6) for model specification and summary of results.

Summary of secondary outcomes before matching cases with controls. Significant differences were observed between groups when comparing NCCU LOS (5.12 (4.65) vs 4.23 (3.93), p=0.001) and the eduction in the overall new infection rate (19.66% vs 12.65%, p=0.003) and UTI rate (5.28% vs 1.46%, p=0.001). ARD, absolute risk difference; CAUTI, catheter-associated urinary tract infection; CLABSI, central line-associated bloodstream infections; LOS, length of stay; NNT, number needed to treat; NS, non-significant; RR, relative risk; RRR, relative risk reduction; UTI, urinary tract infection.
Postmatching outcome comparison
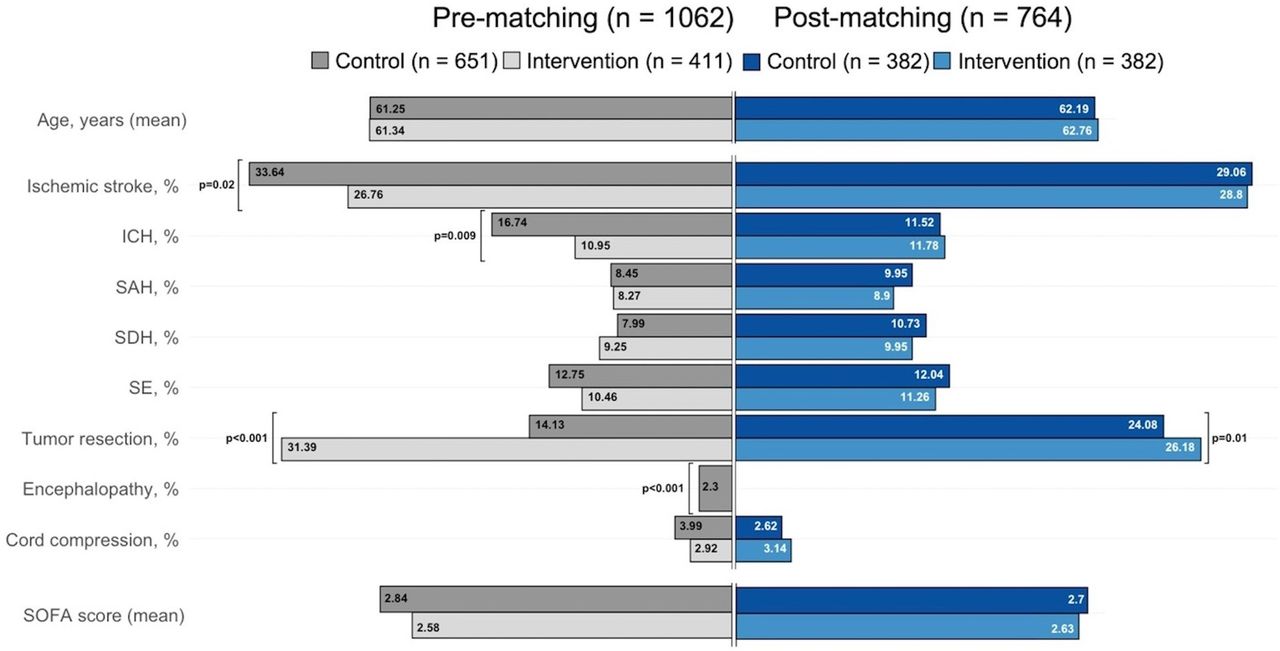
Propensity score matching without replacement yielded 382 matched pairs in each group. Online supplemental table 12 summarises group characteristics after matching. Online supplemental table 15 compares matched versus unmatched treated patients, despite achieving adequate balance as described by SMDs <0.1 across baseline covariates (online supplemental table 1); within the category of admission for tumour resection, the control group had significantly fewer patients than the intervened group (24.08% vs 26.18%, p=0.01) (figure 2). After matching, the intervention group still evidenced a significantly shorter mean (SD) NCCU-LOS (4.32 (4.02) vs 5.32 (4.98), p=0.002) and a significantly reduced rate of overall new infections (12.83% vs 20.42%, p=0.007) and new UTIs (1.57% vs 6.02%, p=0.003), when compared with the control group (figure 3).

Summary of baseline characteristics after matching with nearest neighbor propensity score, without replacement and caliper of 0.25. Significant differences were observed within the tumour resection category after matching. ICH, intracerebral haemorrhage; SAH, subarachnoid haemorrhage; SDH, subdural haemorrhage; SE, status epilepticus; SOFA, Sequential OrganFailure Assessment.
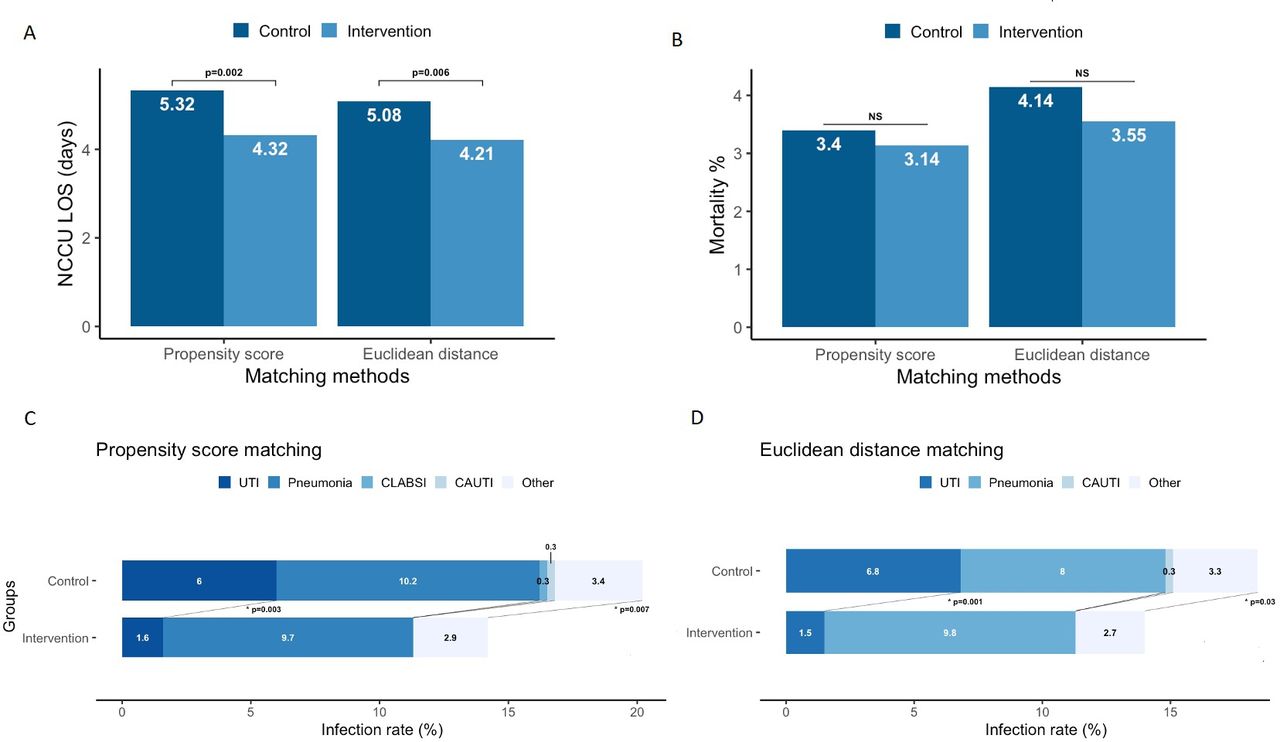
Summary of secondary outcomes after propensity score and Euclidean distance matching. After matching, the reduction of NCCU-LOS and the rate of overall new infections and UTIs remained significant for both matching methods. ARD, absolute risk difference; CAUTI, catheter-associated urinary tract infection; CLABSI, central line-associated bloodstream infections; LOS, length of stay; NNT, number needed to treat; NS, non-significant; RR, relative risk; RRR, relative risk reduction; UTI, urinary tract infection.
Euclidean matching with LSAP and excluding 73 (17.76%) pairs with extreme distances yielded 338 well-matched pairs. Online supplemental table 13 summarises group characteristics after matching, and online supplemental table 16 compares matched versus unmatched treated patients. All SMDs for the covariates were below 0.1, indicating an excellent balance between matched groups (online supplemental table 2 and figure 4). After matching, the intervention group presented a significantly shorter mean (SD) NCCU-LOS (4.21 (3.83) vs 5.08 (4.85), p=0.006) together with a significantly reduced overall new infections rate (18.93% vs 12.72%, p=0.03) and new UTIs (6.80% vs 1.48%, p=0.001) (figure 3).

Summary of baseline characteristics after matching with the Euclidean distance LSAP algorithm. All covariates showed excellent balance. ICH, intracerebral haemorrhage; SAH, subarachnoid haemorrhage; SDH, subdural haemorrhage; SE, status epilepticus; SOFA, Sequential Organ Failure Assessment.
After performing both types of matching, we did not find significant differences between groups when comparing other categories of infections or mortality rates.
Online supplemental table 14 summarises other effect measures to compare outcome variables across groups. After implementing systematic checklists, the ARD between groups ranged from 6.21 to 7.59 percentage points (p.p.) and 3.92 to 5.33 p.p. for the overall new infection and new UTI rates, respectively. In like manner, the RR and RRR for having any new infection ranged from 0.63%–0.67% to 32.81%–37.18%, and for UTIs, 0.22%–0.27% to 72.85%–78.26%, respectively. Finally, the NNT to reduce a new infection was 13–16, and to reduce a new UTI was 19–26 patients.
Discussion
In this QI project, we successfully implemented a standardised process into the NCCU workflow, incorporating a structured checklist into the daily rounding documentation. All patients admitted to our NCCU were enrolled during the study period, accounting for 411. We achieved an overall average daily compliance rate of 97.11% while maintaining a monthly compliance rate above 95% throughout the trial. Prior studies have reported checklist compliance rates ranging from 86% to 93%.35–37
This QI project followed a PDSA methodology that is summarised in online supplemental figure 7. In brief, the project started with the plan for incorporating into the daily clinical workflow a new workflow for improved monitoring and documentation of core elements of good intensive care. A checklist was developed and implemented by NCCU clinical and research staff members. While doing the project, feedback from the NCCU team members was sought concerning the feasibility and effort required for including the checklist in the daily clinical workflow. Furthermore, additional items were considered for inclusion in the checklist. After a given period of implementation of the documentation, we studied the database from inception for missing data and checklist compliance evaluation. Findings were summarised and compared with initial predictions. The final step (Act) of the PDSA cycle involved determining what modifications needed to be introduced to the workflow and regrouping with the research and the clinical staff to describe changes to the plan for the following implementation period. The project had an initial pilot period where each PDSA cycle took approximately 1 week to execute. After this period, each cycle was reiterated every month. Through the iteration of several PDSA cycles, we were able to identify QI key drivers and scenarios that enabled us to accomplish our primary outcome (online supplemental figure 8). First, our NCCU is part of an academic tertiary care hospital with multilayered quality monitoring and improvement mechanisms in place. Second, a multidisciplinary team with experience in QI implementation (as part of our awarded grant) provided guidance and counselling on every PDSA cycle. Third, weekly meetings were conducted in the early stages of the project that helped identify and anticipate potential issues and overcome barriers with compliance. Fourth, we incorporated a SmartPhrase template into our EMR, facilitating charting while decreasing documentation burden and errors. Lastly, introducing an organised daily approach to patient care encouraged stakeholders and positively influenced the team’s overall performance.
We observed differences in the frequencies of the primary admitting diagnoses, where historical controls from a previous year evidenced a greater proportion of admissions due to ischaemic stroke and ICH. In contrast, our treatment group had a higher frequency of hospitalisations for tumour resection. Even though we did not include patients with COVID-19 in any group, part of our study was conducted during the beginning of the COVID-19 pandemic. It thus reflected the restrictions imposed during that time, where only emergent cases (ie, life-threatening illnesses that alter mortality within 6 months) were admitted. Hence, brain tumours were operated on more in the intervention group. Furthermore, nationally, there was a reduction in the overall stroke admission rate during the COVID-19 pandemic, which is also reflected in our data.38 39
As part of our secondary outcomes, we tested our intervention’s effect on ICU quality indicators (ie, ICU-LOS, rates of infections and mortality1 3 4). We conducted statistical analyses first, including all historical controls and treated patients, and again after running propensity score and Euclidean distance matching to account for possible known and unknown confounders. In both sets of analyses, the intervention group demonstrated a significantly shorter NCCU-LOS and an overall reduced rate of new infections and, specifically, a lower number of UTIs when compared with historical controls. There were no significant differences when comparing in-unit mortality between groups.
A randomised controlled trial that enrolled critically ill patients of general ICUs in Brazil, and implemented a multifaceted goal setting and clinician prompting QI intervention, demonstrated improved adherence to ICU care processes (ie, increased utilisation of low tidal volumes and decreased use of heavy sedatives and central venous catheters), as well as enhancing the perception of a ‘safe climate’; despite not reducing in-hospital mortality.35 Likewise, another multicentre international QI study in general and surgical ICUs showed that implementing a checklist for early recognition and treatment of acute illness and injury was associated with reduced non-adherence to care processes and a shorter ICU-LOS.40
In our historical controls and before implementing the checklists, we had an overall infection rate of 19.6%, with UTIs and pneumonia accounting for a 5.38% and 9.22%, respectively. Other ICU-based studies have reported an overall infection rate ranging from 11.9% to 48%.41–45 UTIs and pneumonia are among the most common sites of infection, with varying rates of 4.3%–8.7% and 11.7%–15%, respectively.41 42 After the implementation period, we could bring the overall infection rate down to 12.83%, mainly driven by a significant reduction of UTIs to 1.57%, as the incidence of pneumonia and other infections remained unchanged. Throughout this QI study, the daily rounding with checklists allowed for preventing and removing unnecessary urinary catheters, partially contributing to the significant reduction observed in the UTI rate. Our results are consistent with previous literature documenting success in reducing nosocomial UTIs after the implementation of similar nurse-driven prevention strategies.46 47 Although we did not evaluate costs of NCCU stay, the implementation of checklists resulted in an average LOS reduction of 1 day and an estimated RR and RRR for having any new infection of 0.63%–0.67% and 32.81%–37.18% and for UTI 0.22%–0.27% and 72.85%–78.26%, respectively; with an NNT to reduce a new infection of 13–16 and to reduce a new UTI of 19–26 patients. Therefore, besides improving patient care, these results might reduce costs related to patients’ overall care in the ICU. It is also important to note that we achieved these metrics at the beginning of the pandemic when we started facing a consistent shortage of personnel and various hospital resources.
Prior studies implementing checklists specifically in the NCC setting have focused on improving transfer processes from NCCUs to regular hospital wards.36 37 A prospective study evaluated the implementation of a standardised transfer handoff that decreased the number of patients transferred with unnecessary urinary catheters and more patients transferred with complete medication reconciliation, eventually influencing the overall transition of care.36 Similarly, another study that evaluated the effect of a transfer checklist to standardise the workflow of handoff communication in patients with ischaemic stroke transferring out of the NCCU and to the hospital wards achieved a decreased hospital LOS and an enhanced provider perception of transfer efficiency and patient safety.37 Our study adds to the existing evidence and confirms that the implementation of checklists in the NCC setting is safe and feasible, not only as part of the patient transfer processes but also as effectively incorporated into the daily rounding workflow.
Limitations
We recognise that our QI study was limited by several factors, including but not limited to that this is a single-centre experience and in an academic environment where NCCU care is already well organised and established. Implementing this intervention in a less organised setting would seem harder, thus limiting our findings’ generalisability. However, we observed that when applying our daily checklists, it organised and oriented our daily discussions further than we already had. Moreover, even though this intervention was proven to improve outcomes in our specific NCCU setting, our NCCU follows a model in academic centres of high-income countries where board-certified neuro intensivists lead the team that organises patient care while training dedicated NCC fellows and residents. Additionally, care is provided at a centre fully staffed by trained NCC nurses, clinical pharmacists and dietitians. We have previously established how varied the NCCU models of care and patient populations are across the globe48 49; and are undoubtedly aware that our NCCU model, our patient population and the results obtained in this study do not fully reflect the diversity and heterogeneity of NCCU care worldwide.
Our study adds to the growing literature that checklists are feasible to implement as they promote a better optimisation of care within other specialties. In addition, our constant reminders for applying the checklists and the NCCU team being aware of their work being monitored as part of a QI study might have introduced performance bias, resulting in increased efforts to enhance care and reduce errors. We addressed this issue through two matching algorithms that allowed us to confirm our findings while controlling for known and unknown confounders. While propensity score matching has been used in several settings, a drawback of this approach and cautionary statements about its use have been suggested in any but the very large databases.30 50 Moreover, while propensity score matching aims to reduce bias, bias may increase.51 The current study may also be criticised for relying on missing values imputation. However, for imputing missing data, we undertook a more conservative ‘missing not at random’ multiple imputations through a ‘random forest’ method and further visually verified that the original and post imputation distributions were similar.
Finally, our study was planned to be conducted for 1 year. However, it was interrupted earlier when COVID-19 patients were admitted to our NCCU, reducing the overall study time to approximately 9 months and avoiding the implementation of the checklists on COVID-19 patients, thus, limiting the generalisability of our findings to this critical population.
Conclusions
We demonstrated that implementing a daily checklist in an NCCU is feasible and improves patient outcomes without affecting clinical workflow. Our results add to the literature confirming the positive role of checklists in other medical and surgical scenarios. We have continued running the checklists as part of our NCCU protocol; while monitoring patient outcomes and modifying the checklists as needed. We strongly encourage the application of systematic checklists in other settings while tailoring each checklist to the specific needs and characteristics of patient populations and institutions.
Data availability statement
Data are available on reasonable request. Anonymised data as well as the statistical plan and R coding, not published within this article will be made available by request from any investigator.
Ethics statements
Patient consent for publication
Ethics approval
The prospective portion of our study that involved implementing the checklists in the NCCU qualified as a QI activity and therefore was exempt from institutional review board (IRB) oversight as it was not intended to test a hypothesis or to establish a clinical practice standard but to evaluate and potentially improve NCCU processes of care. The project posed no risk to patients as all the data was anonymised and codified. Information obtained from historical controls was already incorporated in our ongoing IRB-approved NCCU database.
Acknowledgments
We gratefully acknowledge the staff at the BSLMC NCCU that applied the systematic checklists as part of the routine medical care: Drs. Aaron Desai, Ivan Cuesta, Khawja Siddiqui and Muhammad Ubaid Hafeez.
References
Supplementary materials
Supplementary Data
This web only file has been produced by the BMJ Publishing Group from an electronic file supplied by the author(s) and has not been edited for content.
Footnotes
CEE-O and GT-A are joint first authors.
Twitter @DrGabrielNeuro, @Pitch_Mandava
CEE-O and GT-A contributed equally.
Contributors CEE-O, GT-A, CPVR and RD designed the quality improvement project, seek funding, collected and interpreted the data, and drafted the manuscript. GT-A and PM performed statistical analyses and produced the graphs. MSQ and BG-F collected the data and drafted the manuscript. EB and MH implemented intervention, collected data and drafted the manuscript. All authors contributed to the interim drafts and reviewed the final manuscript. GT-A and CEE-O are
responsible for the overall content as guarantors.
Funding This project was funded by Baylor College of Medicine Advancing Clinical Excellence (ACE) in Health Care Delivery Systems Trainee Grant.
Competing interests None declared.
Patient and public involvement Patients and/or the public were not involved in the design, or conduct, or reporting, or dissemination plans of this research.
Provenance and peer review Not commissioned; externally peer reviewed.
Supplemental material This content has been supplied by the author(s). It has not been vetted by BMJ Publishing Group Limited (BMJ) and may not have been peer-reviewed. Any opinions or recommendations discussed are solely those of the author(s) and are not endorsed by BMJ. BMJ disclaims all liability and responsibility arising from any reliance placed on the content. Where the content includes any translated material, BMJ does not warrant the accuracy and reliability of the translations (including but not limited to local regulations, clinical guidelines, terminology, drug names and drug dosages), and is not responsible for any error and/or omissions arising from translation and adaptation or otherwise.