Article Text

Abstract
Background Cancer survival in the UK has doubled in the last 40 years; however, 1-year and 5-year survival rates are still lower than other countries. One cause may be a delay between referral into secondary care and subsequent investigation. We set out to evaluate the impact of a straight to test pathway (STTP) on time to diagnosis for upper gastrointestinal (UGI) cancer.
Methods Six hospital Trusts across the East Midlands Clinical Network introduced a STTP enabling general practitioners to refer patients with suspected UGI cancer (oesophageal/gastric) for immediate investigation, without the need to see a hospital specialist first. Data were collected for all patients referred between 2013 and 2015 with suspected UGI cancer and stratified by STTP or traditional referral pathway. Overall time from referral to diagnosis was compared. Data from two Trusts who did not implement STTP acted as control.
Results 340 patients followed the STTP pathway and 495 followed the traditional route. STTP saved a mean of 7 days from referral to treatment (with a 95% CI of 3 to 11 days, p<0.008) and a mean of 16 days from referral to diagnosis, when compared with a traditional referral pathway. The number of diagnostic tests performed using STTP or traditional referral pathways were similar.
Conclusion A STTP is associated with an overall reduction of 1 week from referral to treatment for UGI cancer. The approach is feasible and did not require more resource. Larger studies are required to assess whether this time saving translates into improved cancer outcomes.
- evaluation methodology
- healthcare quality improvement
- health services research
- performance measures
- statistics
This is an open access article distributed in accordance with the Creative Commons Attribution Non Commercial (CC BY-NC 4.0) license, which permits others to distribute, remix, adapt, build upon this work non-commercially, and license their derivative works on different terms, provided the original work is properly cited, appropriate credit is given, any changes made indicated, and the use is non-commercial. See: http://creativecommons.org/licenses/by-nc/4.0/.
Statistics from Altmetric.com
- evaluation methodology
- healthcare quality improvement
- health services research
- performance measures
- statistics
Introduction
The UK has a significant burden of upper gastrointestinal (UGI) cancer (comprising oesophageal and gastric cancer) and poor survival figures. In 2013, the UK was the third worst performing nation in the world for oesophageal cancer with 12.74 deaths per 100 000 population.1 Patients with UGI cancer have a poor prognosis compared with other cancers, and in England, UGI cancers have the fourth (for males) and fifth (for females) lowest 1-year survival rate of all cancers.2
Within England, the East Midlands is one of worst performing regions for UGI cancer. In the East Midlands between 1990 and 2013, the annual percentage change in oesophageal cancer deaths per 100 000 people was a 1.16% increase, compared with 1.08% increase in Yorkshire & Humber and a 0.81% decrease in the Greater London region. There were 607 new cases of oesophageal cancer in the East Midlands in 2014 and 423 new cases of gastric cancer.3 In 2014, 521 patients died of oesophageal cancer and 289 patients died of gastric cancer in the East Midlands.4
The crude incidence rate (per 100 000 people) for oesophageal cancer in the East Midlands in 2014 was 19.95 diagnoses identified per 100 000 people for males and 9.85 for females. The crude incidence rates for gastric cancer were 14.01 and 6.76 for males and females, respectively.5 The East Midlands region had the highest crude rate (per 100 000 people) of gastric cancer for males over 65 years old in England in 2013.5
There is evidence that early detection of cancer can increase the chances for successful treatment.6 In order to identify potential delays in the care pathway, The International Cancer Benchmarking Partnership (ICBP) study explored differences in how general practitioners (GPs) manage patients with symptoms. GPs in England, Northern Ireland and Wales consistently reported a lower readiness to refer or investigate patients with potential cancer symptoms compared with Australia, Canada, Sweden, Norway and Denmark. The results suggested that differences in how GPs access diagnostic tests and interact with different services within the local health economy may impact on patient management.7
In an attempt to improve access to cancer care and reduce cancer related mortality, NHS England (supported by Cancer Research UK and Macmillan Cancer Support) set up the ACE Programme (Accelerate, Coordinate, Evaluate). ACE focuses on addressing system delays identified by available research and includes the development and evaluation of new streamlined diagnostic pathways.
As part of the ACE programme, the East Midlands Clinical Cancer Network focused on UGI cancer. Hospital Trusts in the region introduced the ‘Straight To Test Pathway’ (STTP) whereby GPs are able to refer patients with suspected UGI cancer directly for a diagnostic test (oesophagogastroduodenoscopy), bypassing the traditional initial hospital outpatient appointment.
The STT approach is reliant on high-quality GP referrals, based on the use of clinical decision support tools that facilitate appropriate referral of patients onto the UGI diagnostic pathway. This requires strong collaboration across the primary and secondary interface to agree the appropriate referral criteria aligned to the NICE 2015 guidance (NG12), educate GPs in how to understand and apply the criteria and use any required technology such as electronic referral and booking systems to streamline the referral processes.8
We set out to establish the impact of the upper GI STTP in the East Midlands.
Methods
STTP was introduced in Derby Hospitals Foundation Trust, Nottingham University Hospitals and University Hospitals of Leicester Trust following the release of the ‘Direct access to diagnostic tests for cancer: best practice referral pathways for general practitioners’ document by the Department of Health in April 2012.9
Data were captured for patients referred between 01/01/2013 and 31/12/2015 with suspected upper GI cancer, that went on to be diagnosed with cancer for each Trust in this evaluation. Data items captured were:
Referral received date: the date on which a decision was made to refer the patient to Secondary Care with suspected cancer.
First seen date: the date where the patient saw an appropriate specialist for cancer care. This was defined as either: (1) the first outpatient appointment with an appropriate cancer specialist or (2) the first diagnostic procedure. The first diagnostic date was defined as the first imaging or radio-diagnostic event date or clinical intervention date.
Whichever of (1) and (2) occurred first was coded.
Clinical diagnosis date: either the date the cancer was confirmed or the diagnosis was agreed. This was normally the date of the authorised Pathology Laboratory Service Report confirming the cancer or the date of the Multidisciplinary Team Meeting.
Treatment start date: the date of the first cancer treatment. If the cancer treatment modality was coded as surgery, the treatment start date for cancer was the start date of the related surgical admission.10
Data were captured using each Trust’s individual cancer information systems (Infoflex and Somerset Cancer Registry). Data were captured on STTP patients and patients that followed the traditional pathway (ie, attended an outpatient appointment as their initial secondary care contact before investigation) to compare cohorts. Data were aggregated on an East Midlands wide level.
STTP was instituted at a primary care level, so Trusts could receive patients on both pathways (ie, STTP and traditional). Primary care providers referring into United Lincolnshire Hospitals and Northampton General Hospital did not implement STTP at the time; these Trusts data were captured and aggregated together to form a control cohort.
Analysis was performed comparing STTP against traditional pathway and control patients, measuring mean days between:
Date of receipt of referral to date the patient was first seen in secondary care.
Date of receipt of referral to date of clinical diagnosis.
Date of clinical diagnosis to the date the decision to treat was made.
Date of receipt of referral to date the decision to treat was made.
Results
Table 1 shows the number of referrals broken down by Trust, pathway and gender.
Number of referrals by Trust, pathway and gender
There was significant reduction in referral to treatment time between patients on the STTP and traditional pathway. The traditional pathway times were similar to those in the control group (see table 2).
Mean number of days (and 95% CI) for each step in referral pathway by group
Figure 1 shows the distribution of patients on the pathway by the number of days between referral and diagnosis. There is a spike in the STTP line early on in the days from referral to diagnosis (groups of 10 days) axis with 55% of patients referred via STTP being diagnosed within 10–20 days. The traditional pathway line is more evenly distributed with the peak being 29% being diagnosed within 20–30 days.

Days from referral to diagnosis. Shows the length of time patients waited between referral and diagnosis in blocks of 10 days by STT, traditional and control pathway. STT, straight to test.
The STTP was associated with a longer time between diagnosis and treatment, negating some of the impact of the faster initial diagnosis. Table 2 shows the mean average number of days between diagnosis and treatment and suggests that traditional pathway patients waited a shorter amount of time between the diagnoses to treatment period compared with patients on the STTP.
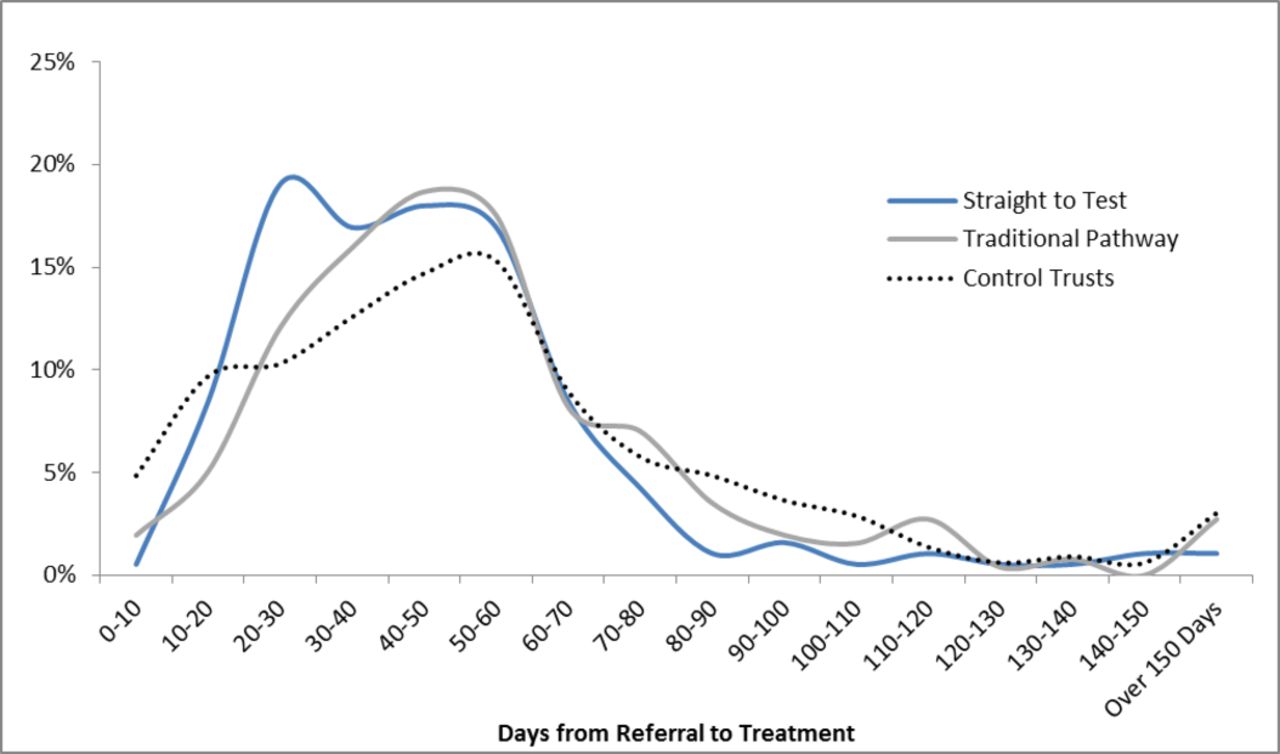
In figure 2, each line represents the number of patients on the pathway against the number of days between referral and treatment. There is a slight spike in the STTP line early on with 19% of patients referred via STTP being treated within 20–30 days of referral. The traditional pathway line is slightly more evenly distributed with the peak being 19% being treated within 40–50 days.
Days from referral to treatment. Shows the length of time patients waited between referral and treatment in blocks of 10 days by STT, traditional and control pathway. STT, straight to test.
Number of requested endoscopies
To establish the effect of STTP on the number of endoscopies requested, the total number of endoscopies performed in Trusts in the East Midlands for the same time frame as the data used in this evaluation was captured and is shown in table 3. These data show that the number of endoscopies performed overall in the region did not increase during the evaluation timeframe.
Number of endoscopies performed by year, Trust and pathway
Conclusion
The UK has seen an improvement in cancer survival rates. However the outlook for UGI cancers is still poor; the age-standardised 1-year net survival (%) for men (aged 15–99 years) between 2011 and 2015 was 46% and 47% for oesophageal and stomach cancers, respectively2; figures are similar for women and both cancers are in the bottom tertile in England for survival. There is evidence to suggest that poor survival data may relate to differences in access and availability for common diagnostic tests, in particular UGI endoscopy.
Against this background, and in order to try and reduce time between initial presentation and diagnostic imaging, we introduced and assessed a STTP for UGI cancer in the East Midlands. This was an ambitious and pragmatic project that used both Clinical Networks and the East Midlands Academic Health Sciences Network. The initial results are impressive. When compared with a traditional referral pathway, STTP saved on average 16 days from referral to diagnosis. This was achieved without a corresponding increase in diagnostic test requests suggesting that GPs can appropriately identify at risk patients in the community.
Although the effect on time to diagnosis was our primary outcome, there will be hidden benefits that were not captured. A difference of 16 days between the time taken from referral to diagnosis may result in improved health outcomes in patients without cancer too, particularly with a reduction in stress and concern as regards potential diagnoses. In patients without cancer, it will also allow the treating clinician to move onto other potential causes of the presenting symptoms and hypothetically result in earlier diagnosis.
There are caveats. Although the STTP had a shorter time from referral to treatment, the time from diagnosis to treatment was longer when compared with the traditional pathway. This may be due to case mix, with treatment decision potentially being quicker in patients who required best supportive care; however, the time from diagnosis to treatment in STTP was the same when compared with the control trusts.
Larger studies are needed to assess whether this reduction of 1 week results in an improvement in cancer survival. Like all pragmatic studies of health interventions, our study also has weaknesses. The introduction of STTP may have highlighted UGI cancer as a potential diagnosis to GPs participating in the scheme, although the fact that requested endoscopies did not increase (except in Derby which reflects a planned expansion in their service) and was similar to national figures, suggests this was not a major factor. UGI cancer may have been identified incidentally on endoscopies requested for non-cancer related indications (such as gastro-oesophageal reflux). These data were not captured. We also did not collect survival data as this was outside the funding scope of our project.
Our data showed that there was no increase in requested endoscopies; however, it is possible that the STTP may result in increased requested referrals, leading to increasing pressure on the diagnostic pathway. Using the NICE referral criteria should mitigate this risk.
Overall a simple change in the way diagnostic tests are requested in UGI cancer results in a significant reduction in the time taken from referral to diagnosis. This is likely to have several health-related benefits and was achieved without an increase in the number of tests requested. This simple change is feasible, scalable and cost neutral. Larger studies are required to assess impact on cancer survival but given the simplicity of the intervention we suggest this should be copied across the UK.
Footnotes
Contributors JAJ gathered and analysed the data, analysis and co-wrote the first draft. He is also guarantor for the paper. JC was co-clinical lead and helped design the project. GH provided analytical support for the results section. PL was the co-clinical lead and helped design and run the project. LB provided regional support. JH provided further analytical support for the results section. DES supported the analysis and co-wrote the first draft.
Funding This study was part of the Accelerate Communicate Evaluate (ACE) programme which was funded by Cancer Research UK.
Competing interests None declared.
Provenance and peer review Not commissioned; externally peer reviewed.