
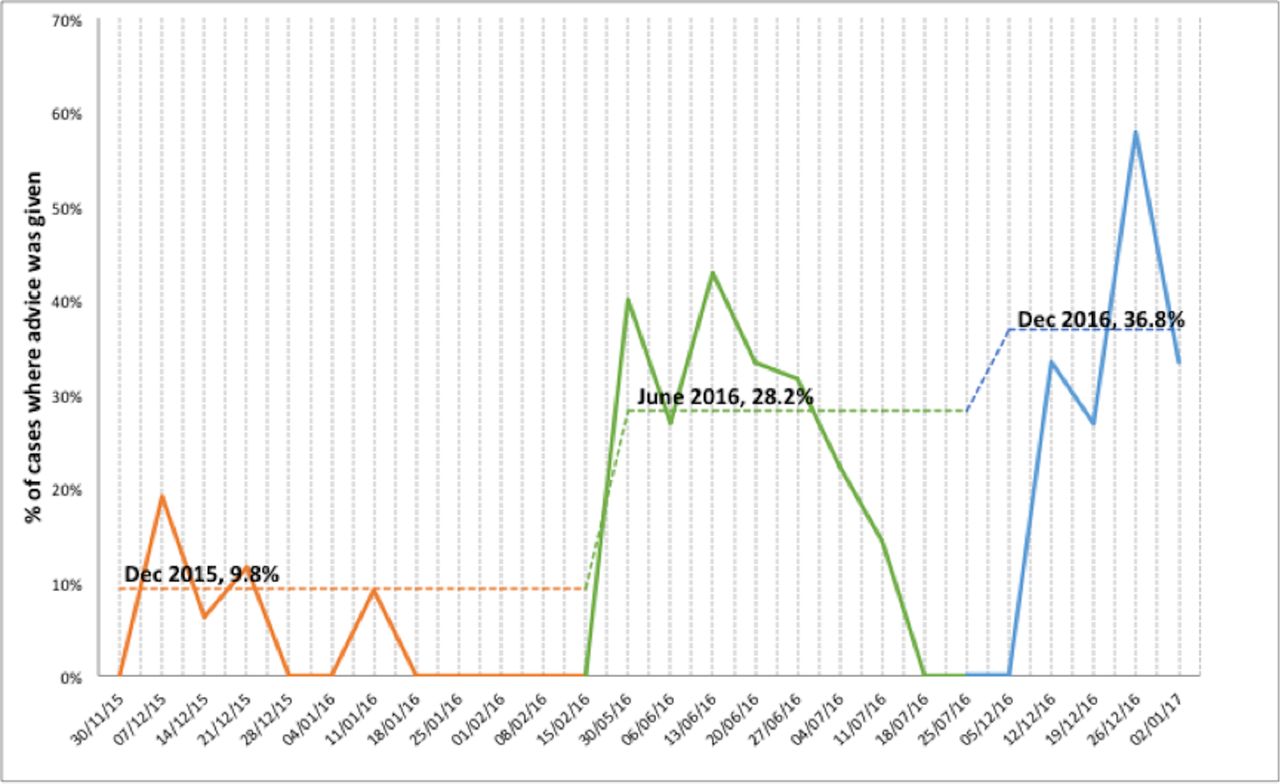
Figure 1
Statistical process U-control chart displaying sustainable increase in driving advice provision over the course of 1 year.
Vol 13 Issue 2
Table of Contents

Share this article
Click the icon of the social media platform on which you would like to share this article.


Email this article to a friend
Respond to this article