Article Text

Abstract
Clostridium difficile causes nearly 500 000 annual infections in the USA. A total of 15 000–30 000 US deaths annually and greater than US$4.8 billion dollars are related to Clostridium difficile infection (CDI). Length of hospital stay is 2.8 –5.5 additional days and inpatient costs are estimated at US$3000–US$15 400 per episode. One major cause of CDI is misuse and overuse of antibiotics. The Centers for Disease Control and Prevention reports that 30%–50% of antibiotics prescribed in hospitals are unnecessary or inappropriate. Patients with unexplained or three or greater unformed stools in 24 hours are candidates for testing of CDI.
Prior to implementation, an analysis at the local level was conducted to determine possible causes of CDI influence. Chart auditing at this urban hospital revealed that 1 out of 23 (4%) providers were treating UTIs according to hospital protocol (A. Richmond, personal communication, 6 March 2018). The standardized infection ratio in 2017, which compares the predicted to the actual infection rate, at this hospital was 1.266 for CDI. Having a solid antibiotic stewardship in place is imperative to limit antibiotic related and resistant infections. During an observational study, only one out of nine (11%) staff followed contact precaution policies at this hospital.
- Infection control
- Patient safety
- Quality improvement
Data availability statement
All data relevant to the study are included in the article or uploaded as online supplemental information. N/A.
This is an open access article distributed in accordance with the Creative Commons Attribution Non Commercial (CC BY-NC 4.0) license, which permits others to distribute, remix, adapt, build upon this work non-commercially, and license their derivative works on different terms, provided the original work is properly cited, appropriate credit is given, any changes made indicated, and the use is non-commercial. See: http://creativecommons.org/licenses/by-nc/4.0/.
Statistics from Altmetric.com
WHAT IS ALREADY KNOWN ON THIS TOPIC
Prior to this study, research demonstrated the impact Clostridium difficile infection (CDI) had on US death rates, healthcare cost and the primary cause. Despite this research and information published by the Centers for Disease Control and Prevention, the published standardized infection rate, at this urban hospital, was known by the stakeholders and the basis for this study.
WHAT THIS STUDY ADDS
This study provides data that supports the implementation of change. We now know the areas that have impacted the standardized infection rate at this hospital.
HOW THIS STUDY MIGHT AFFECT RESEARCH, PRACTICE OR POLICY
The information from this study can be disseminated to other hospitals to improve outcomes and standardize care in the prevention of infection. Weaknesses in the system can provide valuable data that will support and strengthen change to practice and policy.
Available knowledge
Evidence has shown that Clostridium difficile infection (CDI) has a strong correlation to antibiotic use, and the implementation of an antibiotic stewardship is a recommendation for best practices.1 Antibiotic stewardships provide a map for treatment and prevention of CDI by ensuring antibiotics are used appropriately. Having a solid antibiotic stewardship in place is imperative to limit antibiotic related and resistant infections.2 Length of hospital stay for CDI is 2.8 to 5.5 additional days and inpatient costs are estimated at US$3000-US$15400 per episode.2 One major cause of CDI is misuse and overuse of antibiotics. The Center for Disease Control (CDC) reports that 30%-50% of antibiotics prescribed in hospitals are unnecessary or inappropriate.3 Transmission of CDI can occur through improper hand hygiene and improper cleaning of equipment. The Standardized Infection Ratio (SIR) in 2017, which compares the predicted to the actual infection rate, at this urban hospital was 1.266 for CDI.4 In 2012, hospital-acquired infections (HAI) of Clostridium difficile were defined as positive cultures 72 hours after admission.5 Clostridium difficile spores are shed onto surrounding surfaces, and when short cuts are taken, HAIs occur.6 Handwashing, patient isolation, terminal cleaning, rapid CDI testing, antibiotic stewardship and staff education are proven ways to decrease HAI-CDI.5 When planning QI methods, the providers and organisations should be considered as they have a direct effect on the success of the QI project.7 Using infection prevention and control is a means to prevent outbreaks of CDI and is most effective with a multidisciplinary approach.8
Rationale
A multidisciplinary approach required the participation of leadership, employees and providers. The Infectious Disease Society of America (IDSA) and Society for Healthcare Epidemiology of America clinical guidelines were chosen. This guideline provided recommendations to improve the diagnosis and management of CDI, which are outlined systematically with quality of evidence. Measurement tools selected were based on each area of the guideline. The aim was to increase CDI prevention by 25% over 90 days by promoting the use of an antibiotic stewardship protocol by providers, correct use of contact precautions by staff, and promoting patient education regarding disease treatment and prevention.
Methods
This urban hospital in North Carolina is a 162-bed facility located in an urban area along the Carolina Coast and accredited by The Joint Commission. There are more than 100 providers covering greater than 25 specialties with progressive patient care. Meeting National Patient Safety Goals, established by the Joint Commission, drove this topic. Prevention of HAI with a focus on decreasing CDI became the initiative behind the change. Baseline data were collected in each of the four areas that supported planned improvement change. Four Plan-Do-Study-Act (PDSA) cycles were designed for antimicrobial stewardship, patient engagement, contact precautions and team engagement. Each PDSA was mapped out with supporting research. A meeting with the QI team was held and a cause and effect diagram identified possible contributing factors. Research and implementation took 456 hours to complete.
Interventions
Antimicrobial stewardship was prompted with visual reminders for providers to use the urinary tract infection (UTI) protocol and to choose antibiotic treatments wisely. A transparency chart audit was completed weekly for use of five best practices in the treatment of UTIs as outlined by the IDSA guideline.9 Each best practice received a numerical value and visual reminders consisted of laminated posters (figure 1).
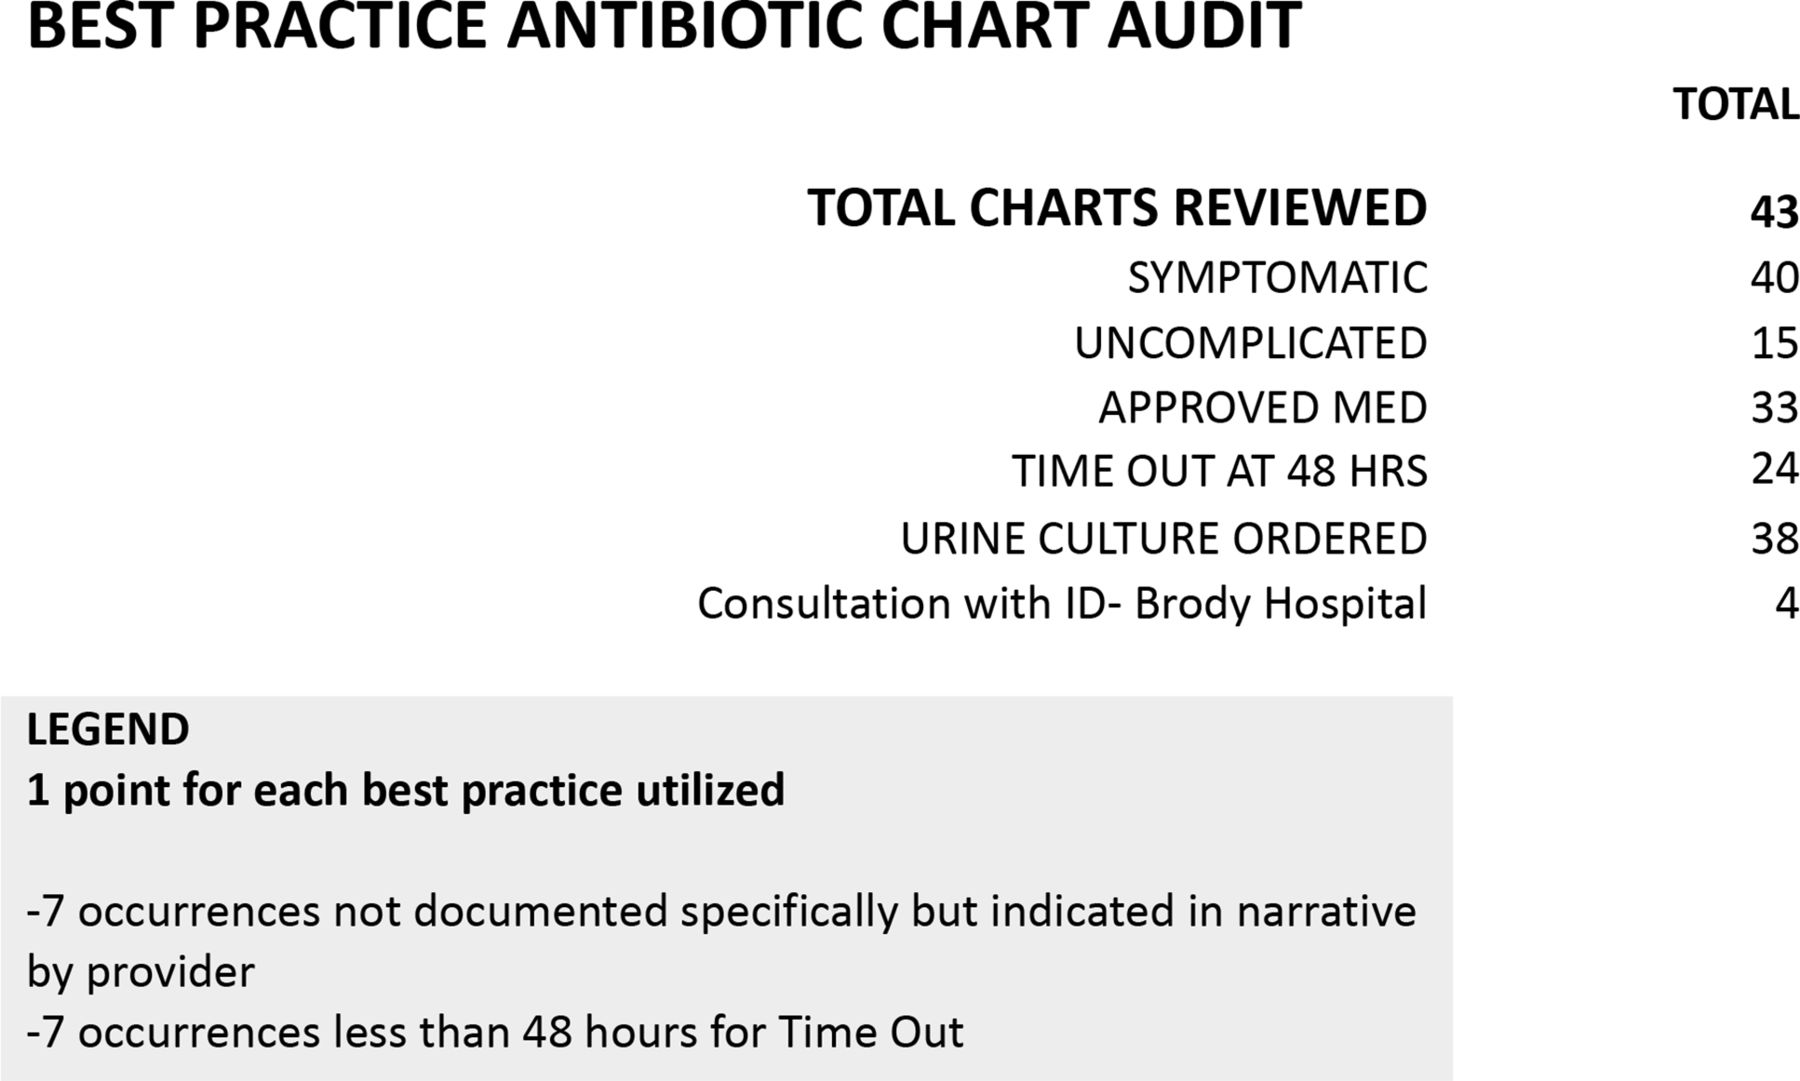
Antimicrobial best practice chart audit.
Patient engagement measured gaps in discharge instructions. Patients discharged were interviewed and asked six questions based on a point system. Supporting research that focused on improving patient comprehension was referenced for safety perspective and quality assessment with discharge instructions (figure 2).
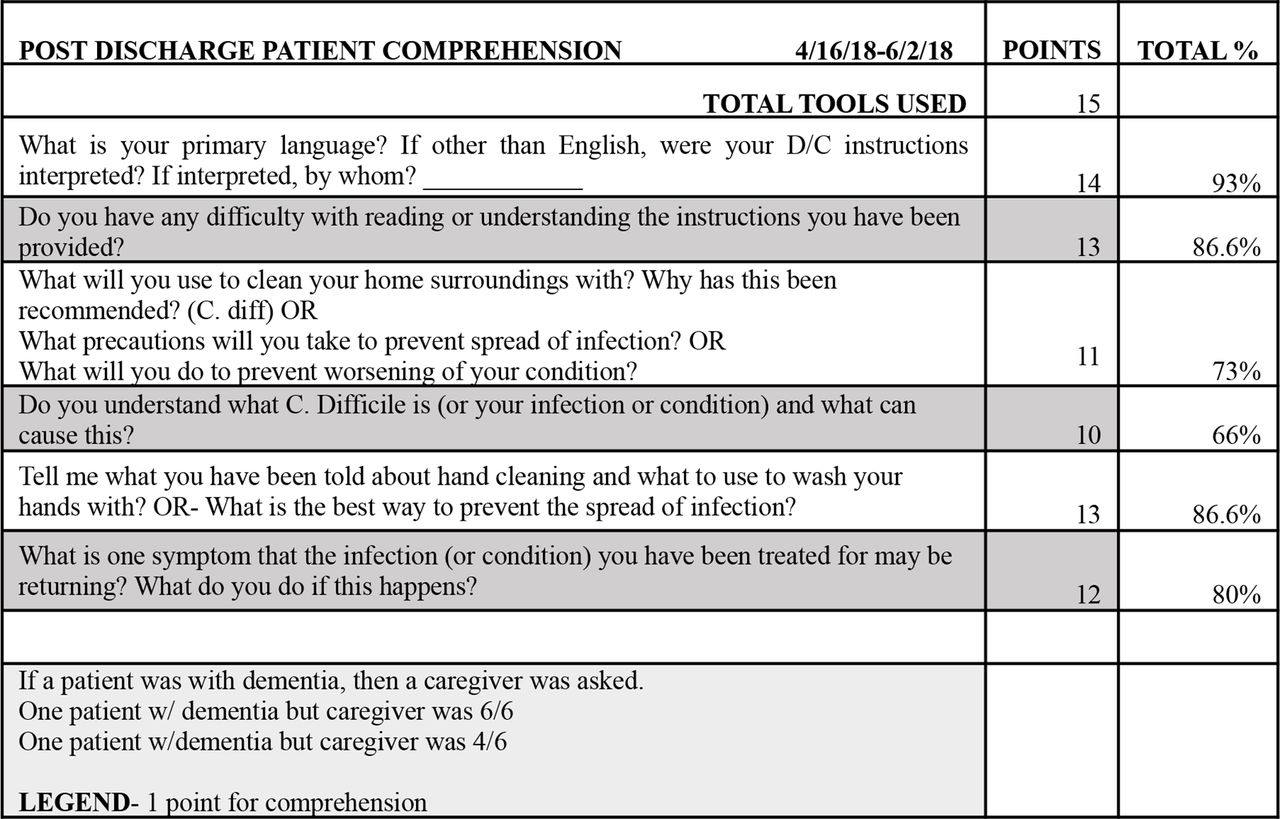
Postdischarge patient comprehension tool.
Contact precautions were measured using a tool published by the Agency for Healthcare Research and Quality.10 Observation of compliance with contact precautions and hospital policy for handwashing were recorded (table 1).
Plan-Do-Study-Act (PDSA) test of change
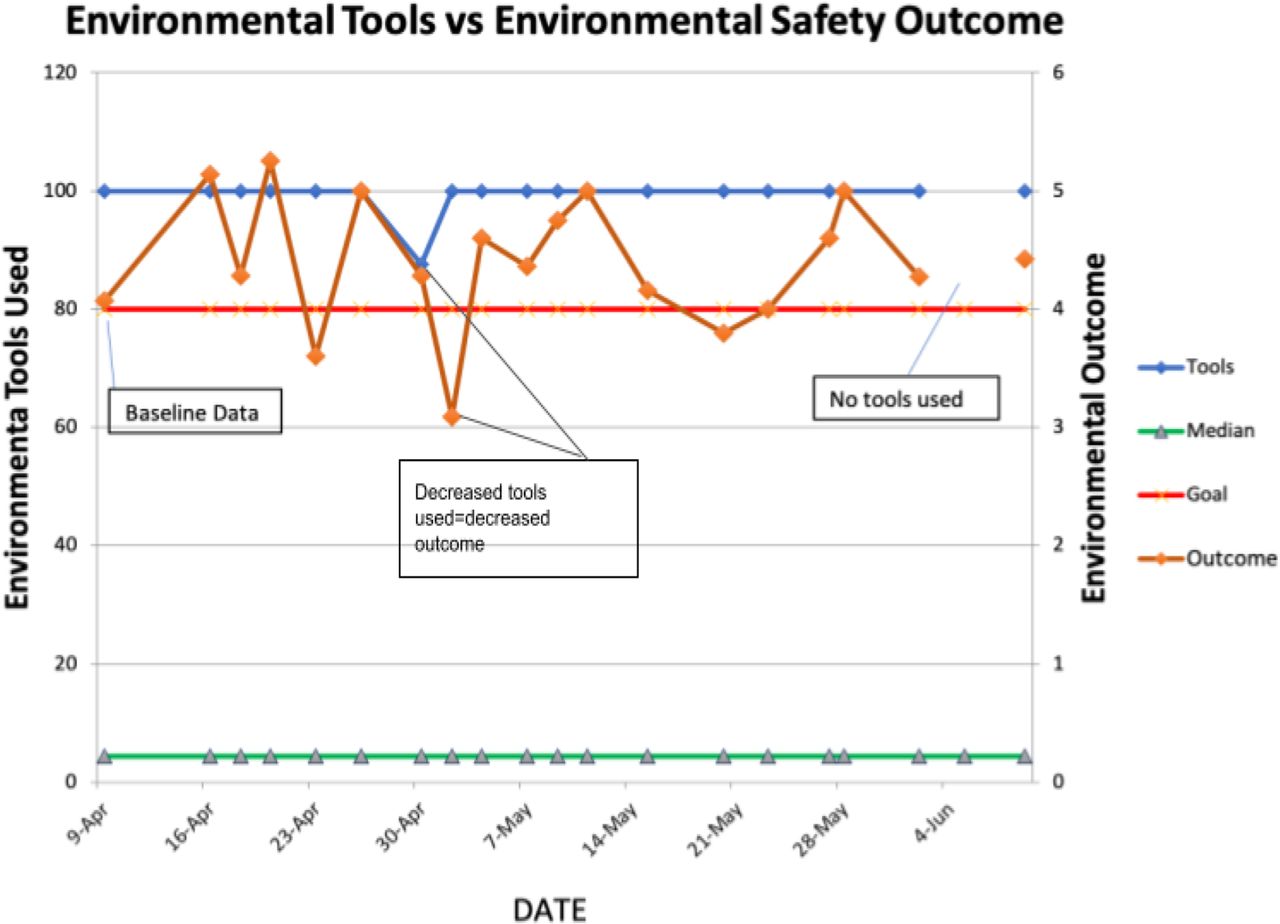
Each tool recorded a score of compliance divided by total tools used to calculate an average compliance rate (figure 3).
Process and outcome run chart. Outcome reflects best practices used for contact precautions using tools by the Agency for Healthcare Resarch and Quality (AHRQ). Total points equaled 6 due to non-disposable thermometers in use.
Team engagement consisted of a competition between two shifts on one unit. Weekly questions distributed to each employee tested morale using research from a published Gallup poll and application of CDI knowledge with patient care. A Likert scale was used to measure responses, and at the end of two weeks, the shift with the most responses received an edible reward (table 1).
Study of interventions
Chart auditing for best practices with antimicrobial stewardship measured effectiveness of visual aids. Using a tool to observe and score compliance with contact precautions and handwashing identified breaks in the system and gaps in patient comprehension. As information was disseminated, run charts provided a visual cue for modification with tests of change (TOC) and displayed data in timed intervals, providing insight about current and future functions.11 Using a second data collection spreadsheet provided aggregate data for contents of a specific TOC (figures 1 and 2).
During each PDSA cycle, a Likert score for employee engagement questions reflected professional satisfaction and application of knowledge with patients diagnosed with CDI. Tracking scores provided additional information on trends that lead to TOC.
Measures
The data transparency audit tool measured the mean score of best practices used. Patient discharge comprehension audits measured the mean score of comprehension, based on number of completed surveys. The observation survey tool measured the mean score of contact precautions used after calculating the number of tools completed. Weekly team challenges measured the mean score of safety and morale, by dividing the number of responses by the number of participants. Measures chosen were based on recommended guidelines and baseline data collected. Supportive research was used for each measure conducted. Operational definitions were evaluated for percent of successful outcomes, and project hours were tracked during the planning and implementation phase for the balancing measure. These actions reinforced reliability and validity of data collection (table 2).
Measurements and results
Analysis
A mean score for each outcome was calculated and plotted on run charts and a secondary chart, which provided aggregate data. Run charts displayed process and outcome data based on the specific intervention used for each TOC. Common cause variations, shifts and trends were identified and used to implement new measures. Analysing this information on a run chart provided a visual reference for proposing further TOC (table 2). The outcome summarised a mean score for each core intervention and was reflected when calculating the project aim.
Results
The overall improvement of all safety measures evaluated was 13.97%.
Antimicrobial stewardship
Antimicrobial stewardship provides guidelines and procedures for the prevention of antibiotic misuse and/or overuse. With this understanding, implementing a transparency chart audit captured providers using recommended medication treatment for UTIs. The focus of UTIs was chosen due to the frequent diagnosis within the hospital setting. Out of 43 charts reviewed, 76.74% of providers prescribed protocol medications. Getting providers on board was hypothesised to be the greatest challenge, but resulted in the greatest influence across all PDSA cycles. To address the use of antimicrobial stewardship, visual posters were strategically placed where providers typically completed electronic orders, generating positive comments by providers. During the final PDSA cycle, information was shared from a provider meeting in which, despite these positive findings, providers were still unaware of where to locate the hospital’s UTI protocol. Steps to find the UTI protocol were then posted to each computer and nurses were in-serviced to assist providers when needed. There were many steps to locate this protocol and likely the reason the protocol was not being used. In the final week of chart auditing, one provider documented in the patient chart that he had used the hospital protocol (figure 1). The results were then shared with key stakeholders including the IT department who could potentially streamline the steps involved, encouraging greater utilization of the antimicrobial stewardship.
This project also took place at a time when the hospital launched their Antimicrobial Stewardship and made available an Infection Control Consultant from Brody School of Medicine for this transition.
Postdischarge patient comprehension
Patient comprehension was queried to identify if accurate information was being provided to the patients prior to hospital discharge. Lack of understanding prevention only leads to further infection in the community environment. There were 15 patient encounters that assessed for gaps in comprehension of discharge instructions. Comprehension gaps included lack of understanding about prevention of infection at home (21%), understanding diagnosis (29%) and return precautions to the emergency department (14%). This tool, while used as postdischarge debriefing, identified comprehension gaps that are imperative in the prevention of infection and reinforcement of a disease process. During the final week, two questions that were consistently answered by all patients were omitted from the questionnaire. Results were piloted by one QI leader and displayed potential for spread (figure 2). Gaps in comprehension also led to a TOC for contact precautions.
Contact precautions audit tool
Assessing contact precautions was the main objective for prevention of CDI. Designing this tool captured the most common areas that encouraged the spread of CDI. The researcher completed observations of staff, visitors and providers conducting daily routines within the room of a patient on contact precautions. Out of 124 completed tools, (44%) demonstrated adherence to recommended guidelines and hospital policy. There were 29 licensed staff/providers and 19 visitors observed disregarding contact precautions. Enteric precautions were the initial focus, but this limited data collection. For PDSA 2, all contact and enteric precautions were included in data collection. Compliance with personal protective equipment and handwashing were observed and measured, on day and night shifts, using an environmental audit tool. Use of non-disposable instruments resulted in an automatic loss of points since guidelines recommended disposable thermometers. A data chart was used so contributors of non-compliance could easily be identified (figure 3) and was shared with administration. When there were observations of visitors not following contact precautions, the researcher questioned if the patients had an understanding of why they were in isolation.Through observation, and to assess gaps in comprehension, patients were then surveyed on their understanding about contact precautions. This second survey became the TOC during the final PDSA cycle. Fifty per cent (50%) of patients interviewed did not have a clear understanding about contact precautions and did not feel comfortable asking their visitors to comply with policy.
Employee engagement
Employee engagement is vital to the success of any change or modification in the prevention of infection in the hospital environment. A questionnaire was designed to query how employee’s feel about their involvement with change, and their value as a participant to this change was captured. Out of 177 employee responses, 112 employees indicated their morale or application of knowledge was supported in their work environment. Likert scale results were posted for employees after all data were collected. Even though the presence of a QI specialist on the unit dictated how many employee responses were collected, this project would not have been possible without employee involvement.
Discussion
Staff and providers at this urban hospital attained 13.97% utilization of safety measures in the prevention of Clostridium difficile. The antimicrobial stewardship uncovered important information that directly related to influences surrounding improvement processes. Gaps in patient comprehension highlighted areas of needed improvement. The contact precaution audit tool used to capture policy compliance not only identified groups requiring additional in-service, but was able to dig deeper into patient understanding regarding contact precautions. Challenges in staff morale were identified through the active participation of the unit.
Interpretation
Encouraging the use of specific antibiotic processes required understanding the actual process involved and addressing specific areas of concern. Examining ease or difficulty of access and availability are important aspects in process utilization. In this case, providers had to take numerous steps to find a protocol, and this was a barrier to compliance. Systems in place that are hospital wide should be assessed for these limitations and adjusted to make accessing protocols more efficient. Assessing effectiveness of policies and procedures can provide valuable information for improvement outcomes.
One of the strongest impacts was the identification of gaps in patient’s levels of comprehension. In a system engineered with available technology and supported by evidenced based research, we continue to forget the importance of a patient’s perspective. When a patient states that they felt like they had leprosy when placed on contact precautions, a more sensitive environment is required. When a patient states they do not understand their chronic diagnosis, improved education is needed. A patient’s understanding and comprehension of their discharge instructions can be challenging.12 Certain conditions, such as low literacy or health literacy rate, or environmental distractions, can have a direct effect on patient comprehension. Patient comprehension was assessed during postdischarge and contact precaution interviews. The use of these auditing tools drove quality, supplied structure and provided feedback that otherwise would have been non-existent.
Staff involvement was dependent on the presence of the QI specialist, despite encouragement with food rewards or recognition for participation. Data were also collected during night shift to show a presence and support their involvement. Lack of participation may be a direct reflection of morale or the unfamiliar territory with project implementation. Testing of employee morale provided important information about how employees rate their work environment. How supported and valued they felt, or not, uncovered some sensitive results and may have caused a sense of despondence. Having strong leadership is vital to a successful team. When employees feel unsupported, their reactions can affect their performance. Marcus Varner makes some valid and important points about employee morale in How Are You Measuring Employee Morale? 4 Things You Can Do To Get Better. Gain insight into problems before employees leave. If you collect data, act on the results before it’s too late.13 Poor morale can ultimately affect the patient and the hospital experience. Staff did not always feel supported and this can affect performance and patient interaction. Varner recommends employers ask the right questions to obtain valuable information about how a unit is effectively managed because this is directly related to productivity and client satisfaction.13 Discharge instructions can have a direct impact on patient outcome and satisfaction and are heavily dependent on staff involvement.12 The sustainability of quality improvement initiatives may be strongly dependent on factors that require an assessment of the environment on a much deeper level.
Limitations
Several limitations were noted during this project. Total unit staff was an estimate and may not have been an accurate count. Identifying patients being treated for UTIs was done using the admitting diagnosis. If a patient was admitted under a different diagnosis, UTI-related treatments were missed during the chart audit process. Access to infection control reports were only available if the Infection Prevention Department generated them daily, making the likelihood of overlooking rooms probable. Finally, spread was not supported during rapid cycles, questioning further available data and supporting sustainability throughout the hospital.
Conclusions
The overall improvement of all safety measures evaluated was 13.97%. These findings provided valuable information for administration and are directly associated with patient satisfaction. Evaluating an antibiotic treatment protocol and bringing awareness of this to others, may have been the most valuable action needed. Ensuring patients comprehend the basis of their care and their diagnosis takes time, but can improve knowledge and dignity. Quality improvement involves a team effort and adjusting processes on a deeper level may be the key to patient satisfaction and improvement.
Data availability statement
All data relevant to the study are included in the article or uploaded as online supplemental information. N/A.
Ethics statements
Patient consent for publication
Ethics approval
This doctorate project was excused from review by the Institutional Review Board at Frontier Nursing University because it does not qualify as human subject research and meets federal requirements for quality improvement. No outside funding was received for this project.
Acknowledgments
The authors would like to thank this urban hospital and the participating employees for allowing us to conduct this research for their Quality Improvment department. We would also like to acknowlege the patient participation that permitted us to gain greater insight into the needs of patients.
Footnotes
Contributors RL data collection. JM data collection. AR data collection. CB data collection. RC data collection. GP data collection. DV data collection. CD Copy Editor. ED accepts full responsibility for the work and the conduct of the study, had access to the data, and controlled the decision to publish.
Funding The authors have not declared a specific grant for this research from any funding agency in the public, commercial or not-for-profit sectors.
Competing interests None declared.
Patient and public involvement Patients and/or the public were not involved in the design, or conduct, or reporting, or dissemination plans of this research.
Provenance and peer review Not commissioned; externally peer reviewed.