Article Text

Abstract
Purpose To evaluate the effectiveness of a multifaceted, hospital-wide glycaemic control quality improvement programme.
Methods The quality improvement intervention comprised three components, derived through root cause analysis: standardising and simplifying care (including evidence-based order sets), increasing visibility (through provider access to clinical data and direct feedback) and educational outreach (directed at the entire institution). Effectiveness was determined at a single urban acute care hospital through time-series analysis with statistical process control charts. Primary outcomes included rate of hyperglycaemia and rate of hypoglycaemia.
Results The study included 70 992 hospital admissions for 50 404 patients, with 3 35 645 patient days. The hyperglycaemia ratio decreased 25.2% from 14.1% to 10.5% (95% CI 3.3 to 3.9 percentage points, p<0.001). The ratio of patient days with highly elevated blood glucose (>299 mg/dL) decreased 31.8% from 4.8% to 3.3% (95% CI 1.4 to 1.7 percentage points, p<0.001). Hypoglycaemia ratio decreased from 5.2% to 4.6% (95% CI 0.27 to 0.89 percentage points, p<0.001) in patients with diabetes, but increased in patients without diabetes from 1.2% to 1.7% (95% CI 0.46 to 0.70 percentage points, p<0.001).
Conclusions We demonstrate improved hospital-wide glycaemic control after a multifaceted quality improvement intervention in the context of strong institutional commitment, national mentorship and Lean management
- hospital medicine
- quality improvement
- lean management
This is an Open Access article distributed in accordance with the Creative Commons Attribution Non Commercial (CC BY-NC 4.0) license, which permits others to distribute, remix, adapt, build upon this work non-commercially, and license their derivative works on different terms, provided the original work is properly cited and the use is non-commercial. See: http://creativecommons.org/licenses/by-nc/4.0/
Statistics from Altmetric.com
Problem
In 2010, our data on nationally reported medical1 and surgical2 benchmarks for glycaemic control revealed an opportunity for improved performance. The initial trigger for this work was an institutional score on the national Surgical Care Improvement Project (SCIP-4) metric below national averages. In exploring the reasons for this unacceptable performance, we identified that the problems identified for SCIP-4 were actually related to challenges in preventing hyperglycaemia across our hospitalised patients. Accordingly, we undertook a hospital-wide quality improvement initiative to address glycaemic control. This was formalised as an overall organisational goal in 2012.
To improve glycaemic control in hospitalised patients at our single institution, we initiated a multifaceted glycaemic control quality improvement intervention using Lean management principles while participating in the Society of Hospital Medicine Glycemic Control Mentored Implementation (SHM-GCMI) programme.3 The objective of the current study was to assess the effectiveness of this project.
Background
In the US adults, 9.3% of the population (28.9 million individuals) have diabetes and 37% (86 million individuals) have impaired glucose tolerance. Diabetes affects 12% of the US hospitalised adults,4 5 with up to 46% of critical care and 32% of other hospital patients being hyperglycaemic.6 In 2012, the total cost of diabetes in the USA was US$245 billion, US$176 billion being for direct medical costs.4 New hyperglycaemia, without a known diagnosis of diabetes, is associated with a higher rate of in-hospital death, two and a missed diabetes diagnosis is associated with an increased risk of readmission (30.6% vs 9.4%).7
There are a number of diabetes and hyperglycaemia consensus guidelines.3 8 However, these guidelines omit detail about some important clinical scenarios. For example, while evidence for care of hospitalised patients with diabetes is rapidly emerging, specific guidance on treatment of patients with hyperglycaemia without known diabetes is lacking, despite worse clinical outcomes.5 9
Professional society guidelines and results of clinical trials also contain conflicting information, particularly regarding exact numeric targets for ideal glycaemic control.9 The large number of available insulin analogues further complicates the multiple guidelines.
Previous reports also detail multiple interventions to improve glycaemic control, including inpatient rounding teams,10 11 educational efforts,12–19 standardised order sets12 20–22 and automated data reporting.19 23 For example, Munoz et al developed a hospital-wide glycaemic control programme focused on provider, nursing and pharmacy education, coupled with clinical decision aids to standardise care.12 Although they achieved downward trends in number of days with hyperglycaemia, their results did not achieve statistical significance. Other prior studies have demonstrated that educational modules are effective in improving providers’ knowledge base, but it remains less clear if education alone changes behaviour.13–15 However, an improved knowledge base when combined with other interventions, such as effective feedback, can prove to be beneficial.14 Furthermore, appropriate education has been shown to enhance belief in the effectiveness of glycaemic control.16 Lean tools have been reported previously as applied to glycaemic control, but only on a limited basis. Martinez et al demonstrated application of Lean towards improving glycaemic control in cardiac perioperative patients.20 However, neither generalisation to the rest of the hospital, nor sustained results after the intervention period were reported. Provider feedback has also been tried previously with mixed success. Schnipper et al reported a before and after trial of standardised insulin order sets and provider education on non-ICU hospital inpatients with some improvement in glycaemic control.21 Reed et al has previously described feedback through real-time blood glucose reports, with improvement in glycaemic control in a single hospital unit.19 23 However, they also reported a statistically significant increase in mild hypoglycaemia. Finally, Rogers et al described the SHM-GCMI programme in a paper in 20143 detailing highly variable success, and including preliminary results from our institution, which identified us a top-achiever in this group.
However, despite focused attention on care for patients with hyperglycaemia, many hospitals have struggled to achieve widespread adoption of standardised, high-quality, effective care for these patients.3
Baseline measurement
Our initial baseline measurement was the nationally reported SCIP-4 measure in 2010, on which we received an unacceptable score. This prompted us to begin to track in real time our performance hospital wide in achieving appropriate glycaemic control. We included all adult (aged ≥18 years) inpatients on general and critical care nursing units admitted after 1 January 2010, excluding emergency department, outpatient observation unit and inpatient rehabilitation unit patients. The primary outcomes were rate of hyperglycaemia, extracted from the Electronic Health Record (EHR), and defined as the per cent of total patient days with mean blood glucose ≥180 mg/dL, and rate of hypoglycaemic events, defined as the per cent of patient days with a hypoglycaemic event (one or more blood glucose values of <70 mg/dL). These metrics were selected to allow benchmarking through the SHM-GCMI programme. We also determined the rate of patient days with highly elevated blood glucose, defined as any daily measurement of >299 mg/dL. Outcomes were tracked on statistical process control charts (see figure 1).

Elevated blood glucose vs time. Statistical process control p-chart of the proportion of diabetic patient days with elevated mean glucose (≥180 mg/dL) by month, comparing before, during and after the intervention (maintenance).
Design
The site was a single urban 336-bed acute care community-based teaching hospital, with 70 000 annual admissions, 60 hospitalists and residency programme. The institution deploys an adaptation of Lean manufacturing methods to healthcare as its management method.
Lean is a systematic approach to eliminate waste and inefficiency in healthcare delivery, and provided the framework for the multiple quality improvement events in this glycaemic control intervention.24 25
Initially, we identified underlying causes for dysglycaemia through examination of our benchmarking data, patient safety data and through root cause analysis. Lean methods to determine root cause included value stream mapping (graphic displays of each step in the care process with identification of underlying causes for any potential errors), Ishikawa diagrams, direct observation of the care process on the hospital ward and the technique of asking ‘why’ five times.25 26 With guidance from the SHM-GCMI programme, we prioritised areas which impact a large number of patients, and issues deemed high risk. These priorities led us to interventions in three inter-related areas:
Standardising and simplifying care
Making the problem visible, transparency
Educational outreach
To improve care in these areas, we performed a series of 2-day to 5-day Lean quality improvement events, and multiple plan-study-do-act (PDSA) cycles over the time frame of 1 April 1 2012 to 31 August 2013. Table 1 lists the individual improvement event and PDSA cycle dates and targets. There was extensive overlap of the events, PDSA cycles and implementation throughout the intervention time frame. Measurement of outcomes was continuous through this period.
Summary of glycaemic control quality improvement intervention and PDSA cycles: from 1 August 2012 to 31 August 2013
Strategy
The quality improvement work in the three areas were implemented over the time frame of 1 April 2012 to 31 August 2013. Details of the individual events are provided in table 1.
Standardising and simplifying care
Early on, we identified early wide variation in our processes and inadequate adherence to best practices. Use of standardised order sets has been successful at our institution for other care processes,27 and is supported by the medical literature to improve compliance with standardised, evidence-based protocols.28 29 Accordingly, to standardise and simplify care, we developed user-friendly, evidence-based order sets, annotated with references and associated policies and protocols. Our initial work targeted subcutaneous insulin order sets, chosen because of impact on the greatest number of patients. This work led us to transition a single subcutaneous insulin order set organised by time of administration to multiple diagnosis-based order sets arranged into basal and bolus subcutaneous therapy.8 30 31 Overall, the order sets encompassed the spectrum of hospital clinical scenarios to aid providers to select the most appropriate regimen for each patient. For example, we developed three insulin infusion order sets, with one specific to diabetic ketoacidosis with hyperosmolar hyperglycaemic state. The order set includes insulin and the associated evaluation (ie, labs, studies), fluids and adjunct therapies (ie, electrolytes). Additional order sets simplified the insulin infusion titration calculations, and optimised presurgery diabetes instructions for point-of-care testing. We also standardised anaesthesiologists’ insulin management of surgery patients using an embedded treatment grid incorporating diabetes type, home medical regimen, antidiabetic medication in the prior 24 hours and admission blood glucose.
Making the problem visible, transparency
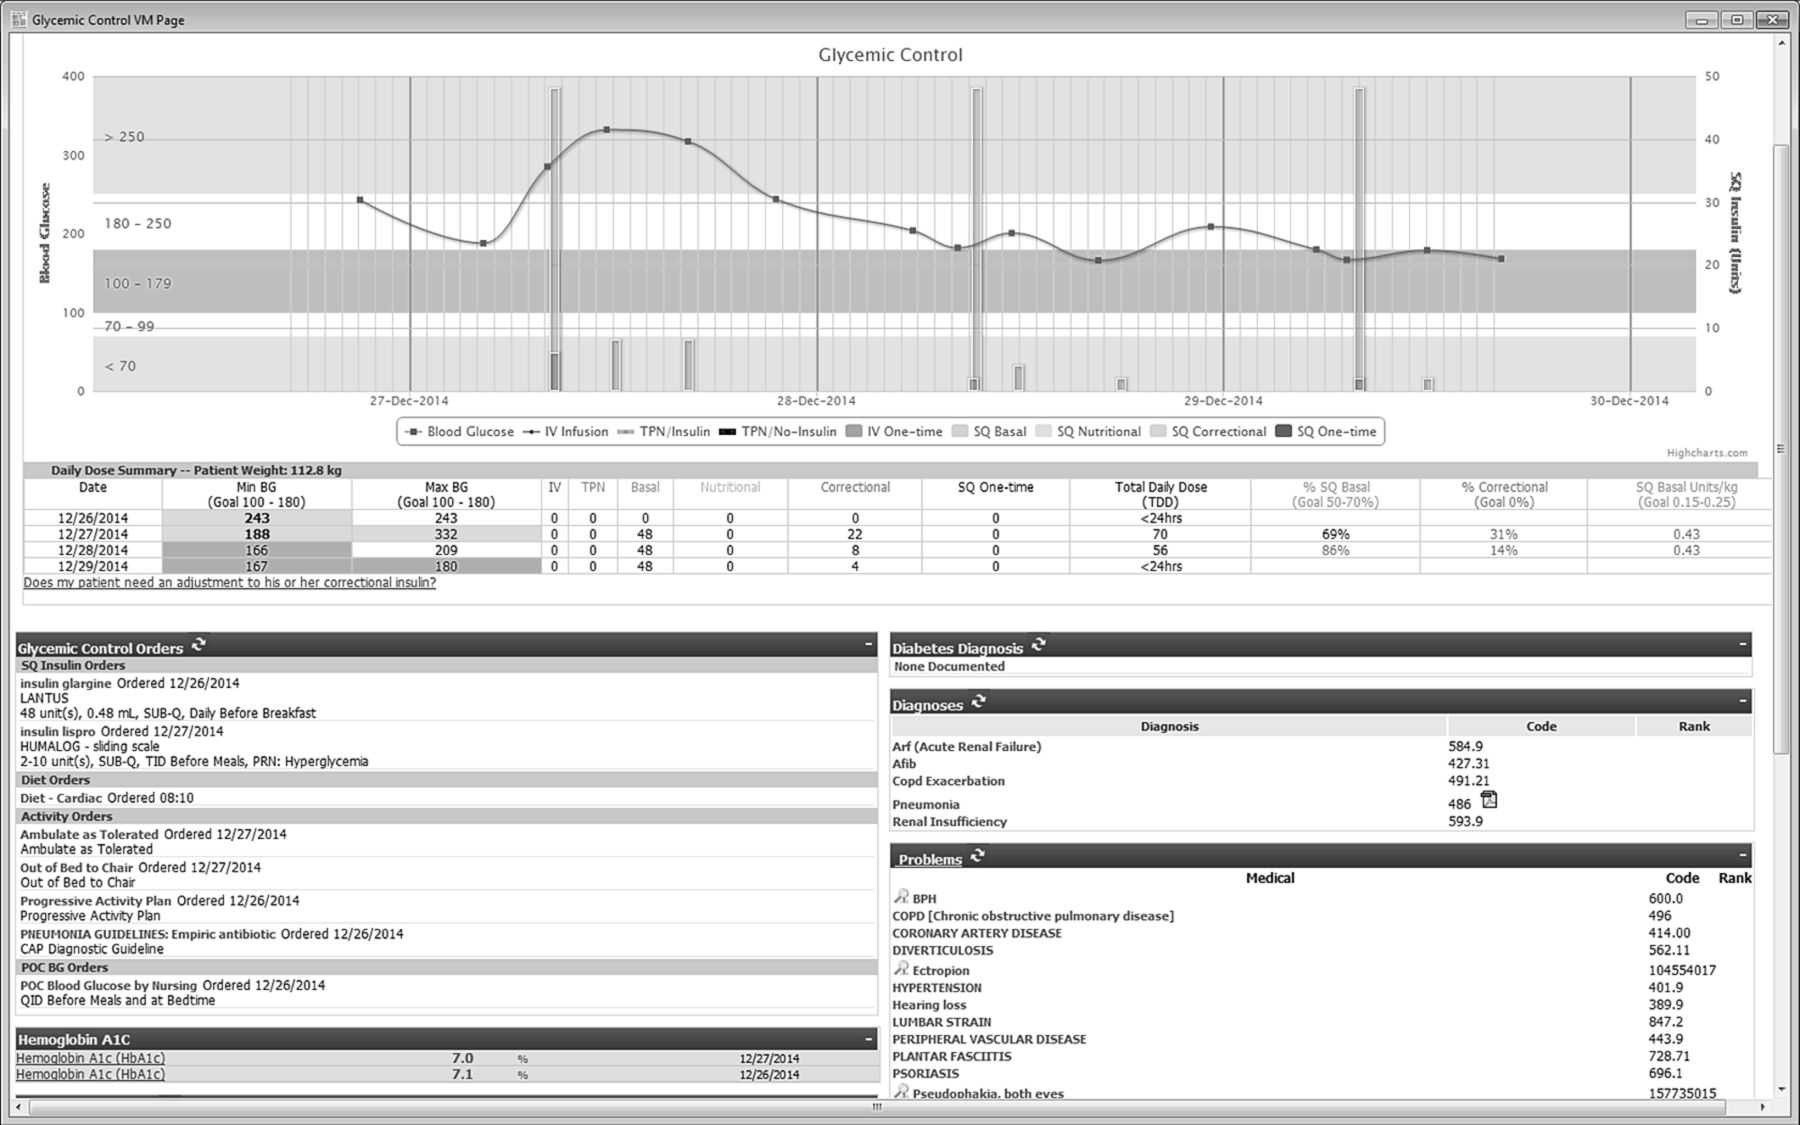
The glycaemic control transparency work encompassed both improving provider access to clinical data to support appropriate glycaemic control therapy, and providing direct feedback to the entire team on success of glycaemic control. First, to decrease provider time for information gathering, we developed a comprehensive yet concise visual summary of patient glycaemic control clinical data available through a hyperlink within the Cerner (Cerner, North Kansas City, Missouri, USA) EHR. This visual summary linked to robust evidence-based5 30 insulin order sets (figure 2). Data include diagnosis, haemoglobin A1c level, orders (diet, insulin and point of care testing) and a graphical representation of units and time of insulin administrations and blood glucose values.

Glycaemic control clinical chart. Comprehensive visual summary of patient glycaemic control clinical data within the Electronic Health Record with links to evidence-based insulin order sets. Visible patient data included: diagnosis, haemoglobin A1c (HbA1c) level, diet orders, insulin orders, point of care testing orders and a graphical representation of units and time of insulin administrations and blood glucose values.
Second, to improve group situational awareness, we implemented a colour-coded (green, yellow, red) indicator (called an andon) within the EHR that was viewable from multiple links in the patient chart. The andon was controlled by a computer-based algorithm within the EHR that examined insulin orders, diagnosis and blood glucose levels in real time, and alerted when insulin orders appeared inconsistent with institutional care protocols based on actual patient clinical data and orders. Through quality improvement events, we developed standardised responses for nurses, pharmacists and physicians to the andon alerts. Pharmacists performed daily assessments of andon alerts, assessing applicability and consistency with the patient’s care goals and collaborating with nurses to develop and communicate recommendations to the managing physician team. Pharmacists also provided feedback on the andon algorithms to refine patient alerting criteria.
In addition to real-time feedback, we reported ward-level rates of hyperglycaemia, and hypoglycaemia to staff on a weekly basis, with benchmarking data from the SHM. More recently, we have been tracking provider level data, used by the hospital quality assurance committee as a peer-reviewed metric for hospital-based providers.
Educational outreach
We launched a large-scale educational campaign starting with institutional grand rounds to increase awareness about glycaemic control and urgency. Subsequently, guiding team members delivered numerous (>70) didactic sessions to institutional provider groups. All providers were required to complete an online dysglycaemia learning module annually for credentialing. Pharmacists were trained in glycaemic control through educational sessions and complex case reviews with a physician champion. We also offered an annual continuing medical/nursing education course on glycaemic control, and developed a group of nursing champions to serve as leaders and experts in standardising and improving dysglycaemia care. A multidisciplinary group representing nursing, physicians, pharmacy and patient safety specialists met every 6 weeks, and reviewed clinical scenarios and local performance data. In addition, we held weekly multidisciplinary insulin safety rounds to review complex cases that resulted in patient safety alerts. Finally, we created an intranet website for physician, pharmacist and nurse reference, including helpful tools such as an insulin-dictionary, and links to clinical guidelines and trials.
Results
To evaluate the effectiveness of the intervention, we performed a single institution time series quality improvement study. The metrics from the baseline measures were continued through 31 December 2014. The intervention was implemented from 1 April 2012 to 31 August 2013. For the analysis, we compared the preintervention period (1 January 2010 to 31 March 2012), the intervention period itself and the postintervention sustainability period (1 September 2013 to 31 December 2014). The data were assessed graphically using statistical process control charts, and analysed with segmented time series regression with Prais-Winsten correction for autocorrelation.
Outcomes before and after the intervention were compared using the t-test for means and Χ2 for proportions. All statistical analyses were performed with STATA V.12.0 (College Station, Texas, USA). This investigation was performed as a quality improvement project with waiver from the Institutional Review Board.
Results
There were 70 992 hospital admissions for 50 404 unique patients during the study time frame, accounting for 3 35 645 patient days. Overall, 26.5% (18 799/70 922) of hospitalisations were for patients with diabetes, accounting for 33.1% (111 187/335 645) of patient days. Neither patient age, proportion with diabetes nor length of stay changed significantly during the study time frame. There were small changes in the gender distribution, and proportion who underwent surgical procedures (table 2).
Demographics by hospital visit, for patients with lab values between 1 January 2010 and 31 December 2014, and discharge between 1 January 2010 and 31 January 2015; n=70 922 hospital visits (admits).
Overall, the rate of hyperglycaemia decreased 25.2%, from 14.1% (19 766/140 409) to 10.5% (10 144/96 717) between the preintervention and sustainability periods (absolute risk reduction 3.6 percentage points, 95% CI 3.3 to 3.9, p<0.001). Subanalysis in patients with a discharge diagnosis code of diabetes identified 21% improvement, from 32.3% (15 453/47 783) preintervention to 25.6% (7932/31 061) postintervention (absolute risk reduction 6.8 percentage points, 95% CI 6.2 to 7.5, p<0.001). The proportion of patient days with highly elevated blood glucose (>299) decreased 31.8% from 4.8% (6702/140 409) to 3.3% (3146/96 717, absolute risk reduction 1.5 percentage points, 95% CI 1.4 to 1.7, p<0.001).
We also identified a decrease in hypoglycaemic episodes from 5.2 (2474/47 783) to 4.6% (1429/31 061, absolute risk reduction 0.58 percentage points, 95% CI 0.27 to 0.89, p<0.001) in patients with diabetes that was balanced by an increase in hypoglycaemic events in patients without diabetes from 1.2 (1075/92 626) to 1.7% (1142/65 656, absolute risk increase 0.58 percentage points, 95% CI 0.46 to 0.70, p<0.001) (table 3).
Glucose lab values by patient days, before, during and after the intervention; n=3 35 645 days
Statistical process control charts demonstrated decrease in the rate of hyperglycaemia corresponding temporally to the intervention, and sustained through 15 months of follow-up (figure 1). The time series regression revealed no significant temporal trend in glycaemic control independent of the intervention (absolute risk reduction 0.04 percentage points/month, 95% CI −0.1 to 0.07, p=0.48). Similar decreases temporally related to the intervention are also evident for the number of days for patients with diabetes with highly elevated blood glucose, and hypoglycaemic episodes (data not shown).
Lessons and limitations
Discussion
In this report, we detail a unique comprehensive (and effective) hospital-wide glycaemic control programme deploying a multifaceted approach encompassing standardisation and simplification of care, transparency and educational outreach. The intervention occurred in the context of three foundational pillars: strong institutional commitment, national mentorship and systematic use of Lean management tools. Institutional commitment was critical as interventions affected a large number of patients cared for by a variety of providers. Leadership provided a consistent message promoting a shared mental model of care, and allocated resources to create the tools, develop the programme and focus the effort to create change. The SHM-GCMI mentorship programme supported collaboration with improvement teams at other institutions, including shared order sets, and provided benchmarking data on intervention effectiveness. Although the SHM-GCMI programme has had variable success in supporting glycaemic control programme,3 at our institution we identified significant value from this mentorship and collaboration approach. The third pillar of our programme was the application of Lean principles, including standard work, visual control and elimination of waste. This Lean management approach has been associated with improved quality in inpatient32 and outpatient clinical settings,27 33 34 and encompassing specific clinical problems, such as back pain35 and care processes, including medication administration.36 We believe that the combination of these three foundational pillars enabled our success in improving glycaemic control across the hospital.
Even with these foundational elements in place, improving glycaemic control across the hospital was challenging. Standardising and subsequently improving care required consensus on best practices, made difficult by the conflicts between the multiple guidelines. In addition, defining and capturing an appropriate metric for dysglycaemia was difficult. Although blood glucose is a discrete value, extracting these data from the EHR with the appropriate relevant clinical information was technically complex. Also, our inability to establish a direct link to clinical outcomes, although not surprising,37 increased the challenge of obtaining buy-in from providers and staff. Finally, some of our interventions required changes in the EHR or other information technology input. Early in the work, this was a source of substantial delay. Subsequently, we included IT staff on the event teams, which facilitated these changes. In addition, our institution prioritises IT resources to work that derives from Lean quality improvement events.
Although we cannot determine which aspects of our intervention contribute most to the results, our increased success may relate to the comprehensive integration of multiple tools (education, order sets and feedback) into the EHR and into provider work flow. Our work built on previously published educational interventions12–19 in directly targeting physicians, pharmacists, nurses and patient safety specialists. Unlike other programme, however, the educational component of our intervention did not require a certified diabetes educator or dedicated advanced nurse practitioner, which may be due to our access to the robust resources provided by the SHM-GCMI. Like other prior reports, we incorporated evidence-based order sets.12 20–22 However, our programme differed through our focus on transparency (including visual summaries of individual patient clinical data), on enhanced group situational awareness of all patients on a nursing unit, and on providing direct feedback to staff members on individual performance.
Limitations
There are limitations to our study that warrant consideration. First, our project was a series of interventions, and we cannot determine which components were most effective. Second, we are unable to parse out confounding factors, including the Hawthorne effect, although this may be minimised due to the long time frame. We were able to control for temporal trend through time series analysis, increasing strength of causal inference. Although our interventions did provide real-time feedback and clinical decision support, our analysis is retrospective. We attempted to use objective measures, but were not able to blind the investigators. Third, generalisability outside our institution may be limited. Although the SHM-GCMI is open to any institution, our institution has distinguishing features that contributed to successful implementation of these improvement efforts. Our institution is a single hospital with employee physicians and strong central governance, which may facilitate institutional buy-in. We also have a long history with Lean methods, so this method of process improvement is well established. We were also early adopters of the EHR, and so have extensive experience in customising order sets and collecting data. Many aspects of our interventions were highly technical in nature and may be difficult for institutions with less experience using an EHR, or using a less customisable EHR. Nonetheless, we believe our interventions could be equally successful at other institutions with appropriate executive leadership and technical resources. Finally, we were not able to directly measure the cost of the interventions, as they were integrated into our standard care processes. Thus, we cannot provide an estimate of any cost savings.
Hypoglycaemia in patients with no diabetes was an unexpected rare event that was not uncovered until the retrospective analysis for this manuscript. However, because it is immediately threatening to life and health, we have initiated additional quality improvement work to eliminate what may be a real increase. This work is ongoing, and initiated beyond the time frame of the current analysis. However, all the work around making glycaemic control visible and standardising multidisciplinary review of performance and safety data described in this paper is enabling to this further quality improvement work.
Conclusion
In summary, implementation of improvements directed at care standardisation, transparency and educational outreach, supported by institutional commitment, Lean methodology and content resources from the SHM-GCMI, were associated with improved hospital glycaemic control. Adaptation of this approach to other settings may contribute to improved glycaemic control, potentially decreasing inpatient morbidity and mortality.
References
Footnotes
Contributors All authors participated in the design of the quality improvement work, the project evaluation design and analysis, the manuscript writing and editing and approved the final submission.
Competing interests None declared.
Ethics approval This investigation was performed as a quality improvement project with waiver from the institutional review board.
Provenance and peer review Not commissioned; externally peer reviewed.