Article Text

Abstract
Inefficient clinic systems leading to prolonged wait times at primary care clinics are a source of frustration for patients, physicians, staff and administration. Measuring and shortening cycle time has the potential to improve patient experience, staff satisfaction and patient access by moving more patients through in a shorter cycle time. Limited studies have demonstrated that improvements can be made to cycle time and may result in improved patient satisfaction. Most of these studies have focused their efforts on improving efficiency at the front end of the cycle. Our aim was to improve cycle time for the whole visit to less than 60 min within 1 year by engaging our team in brainstorming solutions, presenting regular measurements to our team for review and holding regular meetings to plan rapid improvement cycles. Over the course of 1 year (2017), we were able to reduce cycle time by 12% from 71 to 65 min and to improve patient satisfaction with care. Despite the reduction in cycle time, we maintained high satisfaction scores from patients who felt that the doctor spent enough time with them. We learnt the value of engaging our team, frequent measurement for reporting, adequate staffing at the beginning of clinic, and the value of MA staff acting in a flow coordinator role. We have not only maintained this improvement but also made further small gains over the subsequent 2 years, and by April 2019, our cycle time is at 60 min, despite a marked increase in patient volume. Additional work on the time after the patient is roomed and waiting for a doctor, and further analysis of the physician workflow would be important next steps to drive further improvement.
- continuous quality improvement
- teams
- primary care
This is an open access article distributed in accordance with the Creative Commons Attribution Non Commercial (CC BY-NC 4.0) license, which permits others to distribute, remix, adapt, build upon this work non-commercially, and license their derivative works on different terms, provided the original work is properly cited, appropriate credit is given, any changes made indicated, and the use is non-commercial. See: http://creativecommons.org/licenses/by-nc/4.0/.
Statistics from Altmetric.com
Problem
Extended patient wait time detracts from patient experience and system productivity. Long cycle times negatively impact patient, physician and staff satisfaction as clinics run late, and staff have to manage dissatisfied patients and incur overtime and missed breaks. Much of the time the patient spends in the clinic is not spent with the physician but is spent waiting for them and is therefore not value added and wasteful for the patient. Additionally, inefficient patient flow limits the number of patients that can be seen each day, negatively impacting access to care as well as clinic productivity.
Our family medicine clinic is located on the campus of Keck Medical Centre of University of Southern California (USC), a large health system affiliated with the Keck School of Medicine at the University of Southern California in Los Angeles. We serve a medically complex and ethnically diverse patient population and provide a wide range of primary care services, including acute and chronic illness care as well as preventive services to children and adults. The family medicine clinic is part of a multispecialty group practice. Our family medicine team consists of physicians, physician assistants, nursing staff and registration and discharge staff who see approximately 15 000 patient visits per year. The clinic is managed through a partnership between hospital administration and family medicine faculty leadership and has experienced significant growth with an average of 20% new patients per year, which has put pressure on the system to improve its efficiency.
Our aim therefore was to decrease cycle time to 60 min or less from a baseline of 71 min within 12 months of starting our project, and to improve patient satisfaction with wait time while maintaining satisfaction with the quality of care provided.
Background
Access to care is a critical measure in determining the capacity of a healthcare system to provide for the needs of new and existing patients. Barriers to access, including inefficiencies that lead to wait times at clinic visits, are not well studied, and data on quality improvement efforts to improve the efficiency of care are minimal. The vast majority of work in this area has been done on the wait time to get an appointment.1 The few studies that exist on waiting time in the clinic have demonstrated that wait times detract from patient satisfaction and negatively impact the likelihood that patients will recommend the practice to others.2 3 A team from a federally qualified health centre4 5 used the Dartmouth microsystem improvement curriculum framework and plan–do–study–act (PDSA) cycles to drive change. Their work involved engaging everyone in the clinic (the microsystem) in continuous process improvement, using data to track change, and establishing an understanding of positive and productive connections with other parts of the healthcare system, while running rapid improvement cycles. Interventions tried, focused on improving front-end operations associated with registration and showed minimal improvements in wait time with no improvement in patient satisfaction.4 5 Comprehensive strategies, including optimising scheduling by eliminating overbooking, improving staff communication, patient education and quarterly physician reports, were tested without significant improvements in turnaround time in a chronic diabetes clinic,6 although patient and staff satisfaction improved. Operational improvements at discharge and payment were seen. Lean and Six Sigma process flow mapping and spaghetti charts were used to document opportunities for process improvement in a paediatric clinic with modest gains, showing improvement in cycle time from 113 to 90 min and improvement in patient satisfaction from 88% to 95%.7 The overarching principles of visit planning, colocation of key staff, office design, streamlining check-in, standardising exam rooms, using documentation short cuts and streamlining checkouts have been described as areas to work on to improve visit cycle time.8 All of the aforementioned studies found significant delays at the beginning of the process and during the time with the physician. While minimal improvements were made, sustained improvement over time has not been documented in any of the previous studies.
Measurement
We measured cycle time and patient satisfaction and looked at balancing measures as we made changes to ensure that improving efficiency did not negatively impact experience of care. We specifically looked to see if patients felt rushed, or that there had been inadequate time spent during the visit.
Cycle time is defined as the time from check-in at registration to check-out at discharge and is captured through automatic time stamps documented in our electronic health record when certain tasks are completed. This time was subdivided into ‘time from check in completed’ to ‘seen by nurse’ and then ‘seen by nurse’ to ‘seen by physician’. We measured patient satisfaction on Group Consumer Assessment of Healthcare Providers and Systems' (CGCAPS) surveys: ‘see my provider within 15 min’ metric. Additionally, and as part of our improvement work, we started to collect self-reported point of care patient satisfaction at checkout, asking patients to rate their overall experience, and more specifically whether or not they felt rushed during the appointment, and their impression that ‘my doctor takes time to hear what I have to say’. At baseline in October 2016, family medicine total average cycle time was 71 min, comprising 18 min from check-in to seen by nurse, and 53 min from seen by nurse to check-out, as measured for 369 patients. These data were abstracted from the electronic health record via time stamps when cycle time components were completed. Cycle time reports, including the breakdown of components of the time, were delivered monthly to staff for review.
Despite the fact that appointment visits were scheduled for 20 or 40 min, a baseline cycle time of 71 min included additional non-value-added time spent waiting. We believed this additional wasted, waiting time contributed to our poor patient experience scores. At baseline, on CGCAPS patient satisfaction surveys, family medicine was at the 50th percentile compared with other academic health centres; 82% of patients indicated that they saw their physician within 15 min of appointment time. We believed that our work on reducing cycle time would improve patient satisfaction scores as measured by CGCAPs surveys.
Design
In 2016–2017, a physician quality and process improvement training was conducted at Keck Medical Centre led by the Centre for Health System Innovation and the Value Improvement office. This year-long session aimed to provide physicians with quality improvement skills to support meaningful improvement in quality across the healthcare system. Each physician was asked to select a project to improve care and quality in their respective department. As Vice Chair for Clinical Affairs with the Department of Family Medicine, I participated in this programme and was interested in improving cycle time for patients seen in the family medicine clinic.
Within the family medicine clinic, we brought together clinic registration and discharge staff, nursing, physicians and managers and reviewed our baseline data on cycle time. Then, we held a brainstorming session to get input from the entire team. We shared our baseline data and asked the group to brainstorm on the possible reasons for delays in clinic cycle time. Each participant wrote down all their ideas on sticky notes and then we categorised the responses by the component of the patient’s journey through our system. Our analysis from this session showed that most of the concerns related to the patient arriving and being registered. Additionally, our hospital’s value improvement office provided masters of health administration (MHA) interns supervised by their team to shadow patients to create a value stream map, and document the steps that take place from patient check in, to when the physician arrived in the room. Problems and delays in this process were documented, and the time was measured for each of these steps. These data were shared with our clinic staff and physicians, and ideas were suggested to improve the processes to decrease the non-value-added time for our patients. Monthly meetings were conducted to plan PDSAs and share data on improvement. Multiple interventions were implemented over the course of several months. Adding cycle time as a standing agenda item on our monthly meeting committed us to continued measurement, results review, analysis and planning for additional interventions.
Strategy
PDSA cycle 1
We hypothesised that our team of clinic staff, physicians and advanced practice providers would have important insights into the reasons for patient delays in cycle time. We presented cycle time data and brainstormed with our team about barriers to efficient patient flow. Our team had lots of important input into reasons for delays on which they voted. Of 57 votes, 26 related to check-in; 16 of 57 related to patient care. We then wanted to get additional information to explain why delays occur during check-in.
PDSA cycle 2
We believed additional detail into why delays occurred during the check-in process could help design interventions to address the delays. We used the MHA interns to follow patients and complete a value stream map to identify specific steps in the check-in process and to better understand inefficiencies with this process. The check-in process took 8 min and several problems were identified, including lengthy computer searches for patient names, insurance-related work that was duplicated and lags when the nurse assigned to room the patient was occupied. In addition, we observed that check-in time increased as the day went on. These data were reviewed with clinic staff and physicians, and several strategies were proposed to address these concerns.
PDSA cycle 3
We decided to try changing our medical assistant (MA) schedule to ensure MAs were available to room patients at the beginning of the morning and afternoon clinic sessions. Additionally, front office staff streamlined their processes to improve patient flow. We thought this investment in increased staffing and process refinement at the beginning of the clinic session would help reduce cycle time. Cycle time decreased from 74 min in February 2017 to 67 min in March of 2017.
PDSA cycle 4
We held monthly team meetings to review our results and to continue to brainstorm additional interactions. Reflecting on longer cycle times in the middle of the day, we decided to change one physician clinic to begin at 07:00 to decrease the volume of patients toward the end of the morning session.
PDSA cycle 5
During PDSA cycle 4, we noted that measuring cycle time was requiring a significant amount of staff time, and an automatic measurement was programmed into our electronic health record. This change did not work in August of 2017, so we did not have data for this month. By September 2017, however, cycle time had improved to 65 min and the Electronic Health Record (EHR) report was functioning.
At this point, we completed our initial project and, while we did not meet our goal, we reduced cycle time by 12%. Most of our improvement was in the front end of the cycle. Over the next year, we began work on reducing the wait time after the nurse had finished with the patient. We continued to monitor and report cycle time. We began to work on improving nurse and provider communication, including morning huddles to prepare and get ready for the day determining who needed vaccinations or other orders. We reached out to patients ahead of the visit to inquire about the reason for the visit to better be prepared. We discussed proactive communication and tried having the nursing staff knock on the door to inquire if anything was needed as a signal to let the physician know additional patients were waiting. We empowered the nursing staff to take on the role of flow coordinator and to help us move the visit along if we were getting behind. We provided the physicians with quarterly reports that included data on their cycle time compared with their peers. These efforts resulted in additional improvements in our cycle time, and by April 2019 we had achieved our 60 min cycle time.
Results
In October of 2016, our average cycle time was 71 min. By June 2017, we had decreased the cycle time to 63 min, a 12% decrease. This improvement occurred despite an increase in the volume of patients seen from 369 seen in October 2016 to 573 patients seen in June 2017. Our CGCAPS scores for ‘See Provider within 15 min’ increased from 82% to 95% in the same time period, ‘Recommend this provider office’ increased from 92.5% to 100% in May and again in June of 2017. The impact of the PDSA cycles is shown in figure 1.
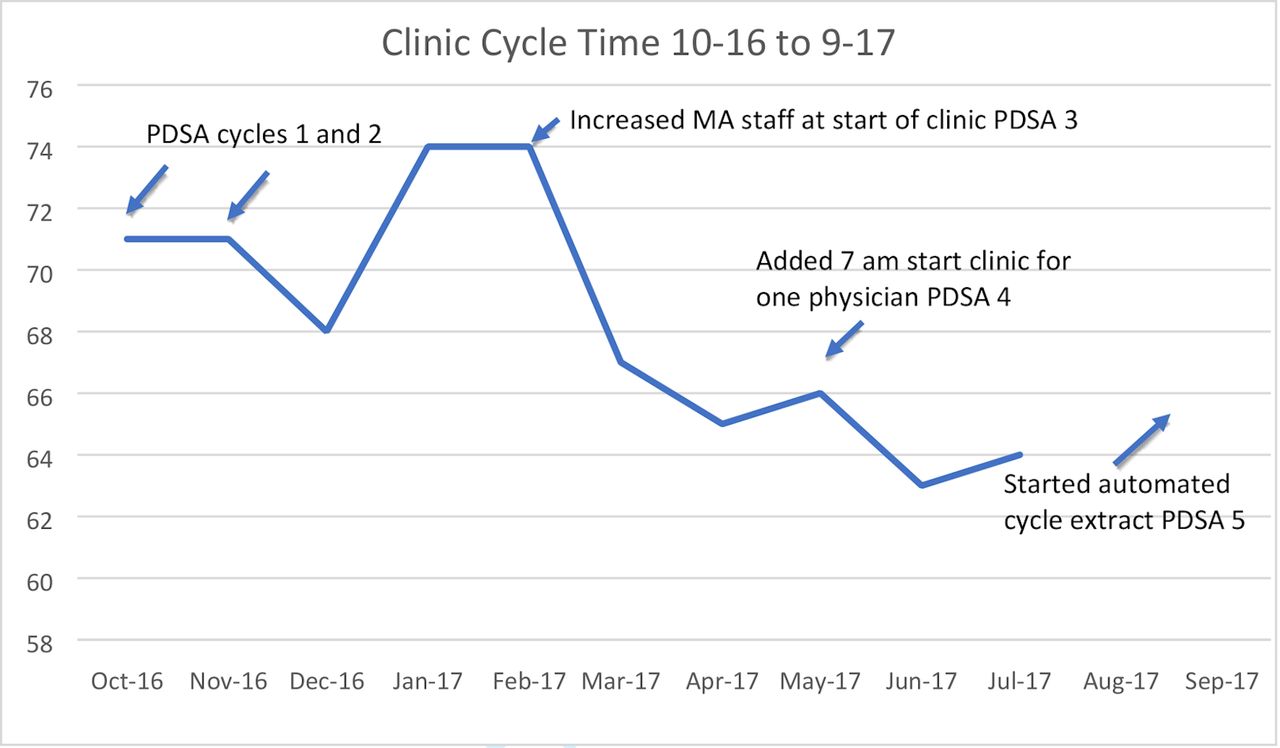
Run chart of total clinic cycle time from the start of the project in October 2016 to the end of the first phase in September 2017. PDSAs are shown, total cycle time decreased from 71 to 65 min.
We also collected point-of-care patient satisfaction data from patients to get immediate feedback on their experience of care and found that patients gave an average score of 4.83/5.0 on overall experience today; 4.88/5.0 in response to my doctor did not rush me through the appointment; and 4.93/5.0 on my doctor takes the time to hear what I have to say.
Staff and providers also responded to daily point-of-care surveys and rated 4.8/5.0 that ‘doctors and nurses work together to provide excellent care’, 4.47/5 to ‘our front desk is calming and friendly’ and 4.25/5 ‘patients rarely feel rushed out the door’. These balancing measures suggest that we succeeded in decreasing wait times without negatively impacting patient and staff satisfaction. As these surveys were created as part of the project, unfortunately, baseline data for these measures were not available.
Lessons and limitations
There were several key learnings from this work. First, meeting with the entire team and brainstorming about the problem and potential solutions were a valuable way to gain a significant amount of information about our system in a short period of time. It was also important to engage the team in order to get their participation and commitment to figuring out solutions and determine where they believed the work should begin. Additionally, presenting data back to the team on a monthly basis was important to maintain engagement and continue working to improve the system. This process also helped team building and encouraged individuals to think about problems in our system and what they might do to improve them. One limitation is that we did not include patients to help us brainstorm solutions. Including patients on this team may have surfaced additional important ideas for improvement. Additionally, we did not have baseline data for the point-of-care patient satisfaction measures. While the responses to questions of feeling rushed and staff working together were strong when measured, we do not know how this compared with baseline before changes were made.
Second, measuring cycle time was difficult, although time-stamped data could be extracted from the EHR from check-in at arrival, to check-out at discharge, interpretation of these basic data required many conversations and clarifications about definitions and accurate measurement of different components of the visit. When does the cycle begin? Is it when the patient arrives or at the appointment time? How do you account for patients who arrive very early or very late? To define the components was a time-intensive measurement process, and we spent significant time trying to figure out how to measure cycle time reliably from beginning to end using the electronic health record. When we finally were able to make configurations to our EHR to collect our data more meaningfully, we had a month where we could not collect accurate data (August 2017). Once we had accurate overall cycle time measurement, we were still only able to further delineate into two parts: ‘check in’ to ‘seen by nurse’ and ‘seen by nurse and seen by physician’, the end point of which signified the end of the visit (see figure 2). Additionally, the EHR was not able to distinguish time in the exam room waiting for the clinician, from actual face time spent with the clinician. Anecdotally, we believe there is still significant waiting time in the exam room before the clinician arrives that may be reduced without reducing valuable face-to-face time with the patient. Going forward, if we were to add a further component to the EHR, it would be a timestamp to be entered by the physician when they start their actual consultation. Additional analysis of how clinicians spend their time, value-added time spent face-to-face with patients, versus non-value-added time spent on paperwork or administrative tasks may also help to increase value added time with patients. In addition, we realised a significant number of patients were not stopping at check-out, leading to invalid data for those patients who had to be taken out of our calculations. However, we also realised that these patients were missing key components of care such as scheduling follow-up appointments and referrals for specialty care. Taking time to do PDSA cycles on how to accurately measure cycle time would be advisable for others doing this work. Closely examining the process from start to finish can also help reveal undetected system errors such as patients missing checkout.

Cycle time for the second phase of the project, maintenance and further improvement (September 2017–April 2019). Processes within the overall cycle time are shown.Total cycle time fell from a mean of 66.75 min in the first 4 months to be maintained at 60 min in the final 4 months to April 2019. Time spent with provider, nurse and physician fell from a mean of 53.5 (first 4 months) to 48 min. Despite a small reduction in time spent with the provider, patient satisfaction scores remained high and more patients were seen in the clinics.
Third, we recognised that the MAs are a critical component to our flow as they are the crucial connection with front office and with the physicians. They have the potential to play a leadership role in flow management. Good communication and interaction with the front office to bring registered patients back and get them ready for physicians are important, as well as communicating with and assisting the physician in completion of orders to keep patients moving through the system. Physicians reported that they often did not know how many patients were waiting to be seen and that proactive MAs who alerted them to the arrival of the next patient could help to keep them on time. This critical flow coordinator role was underappreciated. Additionally, overloading the MAs with additional tasks made it hard for them to fulfil both rooming patients and carrying out orders and moving patients to discharge. Further training in proactively managing flow of patients and ensuring adequate staffing is key to successful clinic flow.
Finally, it is interesting to note that the improvements made in our study and other studies4–7 have largely focused on improving the processes at the beginning of clinic related to registration and rooming, and yet, the bulk of time spent in clinic is waiting for the physician to arrive in the room, completing the physician encounter and waiting for orders afterward to be completed. Our staff and physicians were most interested in working on the delays at the beginning of clinic. There exists some uncertainty and trepidation about tackling the time patients are waiting in the exam room for the physician and the time the physician spends with the patient and on orders. This may be due to the large volume of clerical work that physicians are responsible for, and the inherent challenge of managing several complicated medical problems as well as addressing health maintenance issues in a busy primary care practice. The interest in providing comprehensive care may conflict with the interest to provide efficient care.
Conclusion
In the context of increasing demand for primary care, reducing cycle time holds promise of increasing satisfaction for patients and staff, as well increased visit efficiency leading to potential for more patients to receive care. This study adds to the small volume of studies that have focused on improving throughput in primary care by focusing on improving efficiency at the beginning of the cycle. It demonstrates the value of engagement of the entire care team and the use of frequent measurement and reporting to drive improvement. While the aim of reducing cycle time to less than 60 min was not met during our initial project period, a 12% reduction in time did occur and patient satisfaction increased. Subsequent work building on our learning allowed us to reach and sustain our goal over the next year. Balancing measures demonstrated that patients still felt their physicians spent adequate time with them and addressed their concerns. Additional resources that provided QI training for the lead physician and the use of MHA interns to help with documenting delays in the process helped to quantify delays and provided additional information on steps that contributed to the delays. This also helped to get some input from patients as well. These resources, provided by the health system, were instrumental to the success of this study. While we did not measure costs or additional revenue, theoretically, the ability to see additional patients based on a more efficient system could generate additional revenue to pay for these costs or the costs of additional staffing to support improving efficiency. We have also changed our culture to include measuring and improving care, as well as empowering our team to come together to create solutions to problems. The significant impact of primary care burnout among staff and physicians with dysfunctional systems, and the move to value-based care argues for additional research and resources towards improving the provision of high-quality, efficient primary care systems. We intend to continue to measure and report on cycle time and to continue to engage our team on the path to improvement. Further examination of the workflow of the physicians, the role of nursing staff and the communication between this team will be important next steps to further improve cycle time.
Footnotes
Twitter @PedenCarol
Contributors I hereby verify that all contributors to this work have been named and acknowledged. JR planned the study and ongoing interventions, wrote and submitted the study and is responsible for the overall content. MP helped plan the study. YM collected data and helped plan the study. CJP provided technical assistance related to quality improvement strategies and reviewed and edited the manuscript.
Funding The authors have not declared a specific grant for this research from any funding agency in the public, commercial or not-for-profit sectors.
Competing interests None declared.
Patient and public involvement Patients and/or the public were not involved in the design, conduct, reporting or dissemination plans of this research.
Patient consent for publication Not required.
Provenance and peer review Not commissioned; externally peer reviewed.
Data availability statement All data relevant to the study are included in the article.