Article Text

Abstract
Recent high profile cases in the UK have highlighted the impact that the reporting of clinical outcomes can have for healthcare providers and patients. Great importance has been placed on the use of statistical methods to identify healthcare providers with observed poor performance. Such providers are highlighted as potential outliers and the possible causes investigated. It is crucial, therefore, that the methods used for identifying outliers are correctly understood and interpreted. While patients, funders, managers and clinical teams really want to know the true underlying performance of the provider, this true performance generally cannot be known directly and must be estimated using observed outcomes. However, differences between the true and observed performance are likely to arise due to chance variation. Clinical outcomes are often reported through the standardised mortality ratio (SMR), displayed using funnel plots. Providers whose observed SMR falls outside the funnel plot control limits will be identified as potential outliers. However, while it is obviously desirable that a healthcare provider with a true underlying performance different from that expected should be identified, the actual probability that it will be identified from observed SMRs has not previously been described. Here we show that funnel plots for the SMR should be used with caution when the expected number of events is small as the probability of identifying providers with true poor performance is likely to be small. On the other hand, when the expected number of events is large, care must be taken as a provider may be identified as an outlier even when its divergence is of little or no clinical importance.
- Statistical process control
- Mortality (standardized mortality ratios)
- Performance measures
- Healthcare quality improvement
Statistics from Altmetric.com
- Statistical process control
- Mortality (standardized mortality ratios)
- Performance measures
- Healthcare quality improvement
Background
In the first few months of 2013, two high profile cases in England highlighted the enormous impact that reporting clinical outcomes measures can have for healthcare providers and patients. In both cases concerns about high mortality rates led to investigations by the Care Quality Commission into the quality of care. In February, the public inquiry into care at Mid Staffordshire NHS Foundation Trust highlighted the role that the publication of mortality rates had played in the original identification of concerns at Mid Staffordshire: “the truth was uncovered in part by attention being paid to the true implications of its mortality rates”.1 Then, in March, paediatric cardiac surgery services were suspended at Leeds General Infirmary in response to concerns, including high mortality rates.2 Both of these cases received wide attention in the press, both nationally and internationally.3–6
This use of clinical outcomes to identify providers with potentially poor performance has been widely advocated, with those healthcare providers whose outcomes fall outside the expected range identified as potential outliers and the reasons for this investigated.7–9 As seen for Mid Staffordshire and Leeds, the consequences of investigations and publicity can be substantial. The ability to correctly identify true outliers is of increasing importance for patient safety and for healthcare provision. It is vital, therefore, that the analysis, reporting and interpretation of these outcome data are understood.
One of the most commonly used statistics for reporting healthcare provider outcomes is the standardised mortality ratio (SMR); this is the ratio of the observed number of events in a population compared with the number expected, calculated using the rates in a reference population.10 If the value of the SMR is >1, there is said to be ‘excessive’ events in that population.
SMRs are increasingly being reported using funnel plots to show graphically the differences between healthcare provider performances in relation to random variation.10–18 In England and Wales the use of funnel plots has been advocated by groups including the National Clinical Audit Advisory Group (NCAAG), now the National Advisory Group on Clinical Audit and Enquiries (NAGCAE).7–9 Funnel plots comprise the drawing of control limits around a given ‘target’ or benchmark: in the case of the SMR, this is the value 1 (figure 1). The control limits are drawn so that the observed SMR for a healthcare provider performing at a rate equal to that expected will fall within the control limits with a pre-specified probability: in practice, 95% and 99.8% control limits are typically used.11 ,12 Those healthcare providers whose observed SMR falls outside the control limits are identified as outliers and it is usually expected that the reasons for this will be investigated.7–9
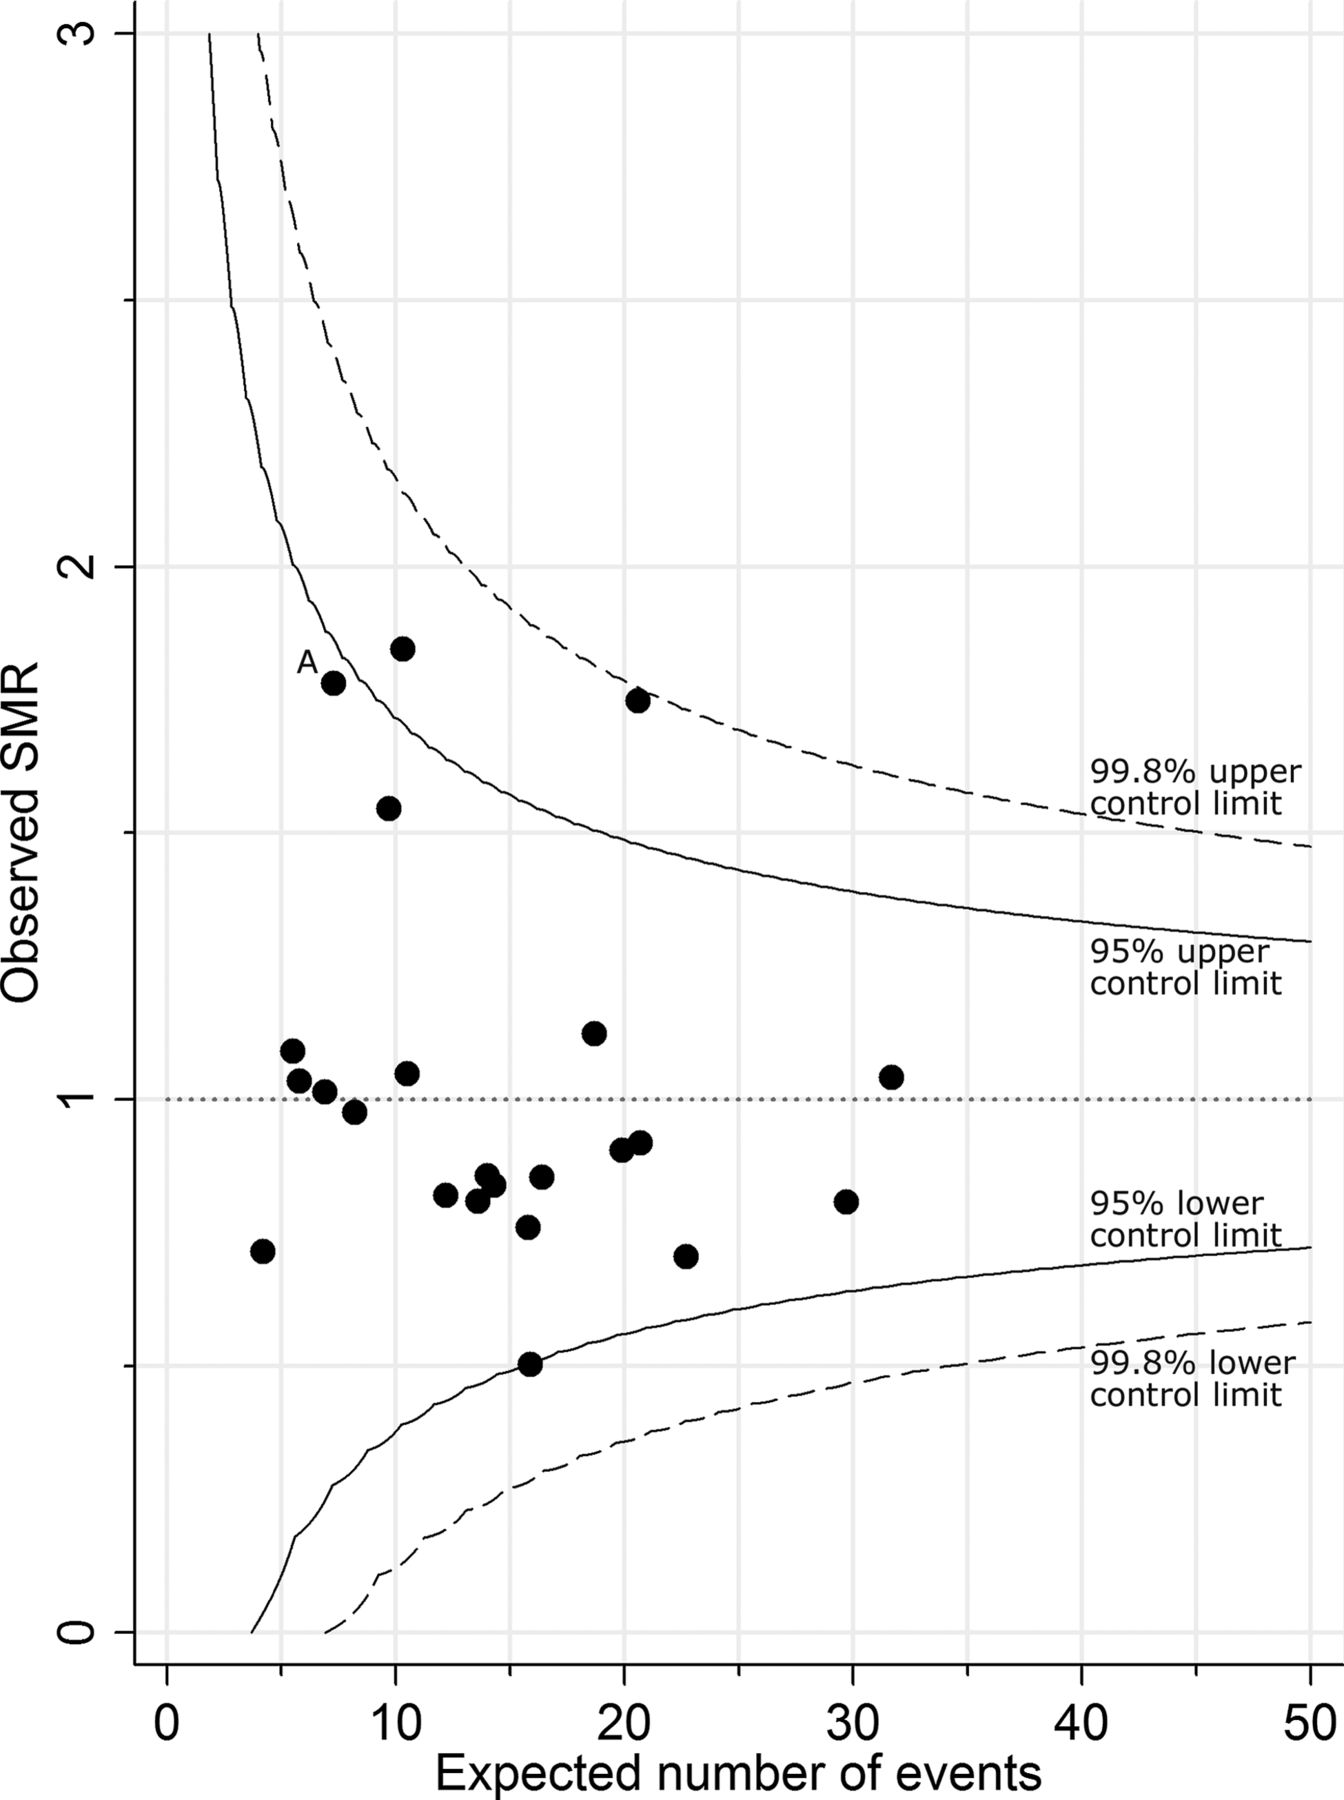
Example of a funnel plot. Mortality before discharge from neonatal care for babies born at 20–32 weeks’ gestational age, 2008–2010, by primary care trusts in the East Midlands and Yorkshire: data from the 2011 annual report of The Neonatal Survey.14 SMR, standardised mortality ratio.
The problem
What patients, funders, managers and clinical teams really want to know is the true underlying performance of the provider (its true SMR). However, this true performance of a healthcare provider generally cannot be known directly and is usually estimated by using the observed outcomes over a period of time (its observed SMR). The problem is that the value of the observed SMR will rarely be exactly the same as that of the true SMR: the difference between the observed SMR and the true SMR is the result of chance variation. While for large providers the observed SMR is likely to be a close estimate of the true performance (true SMR), due to there being less chance variation, this is not the case for healthcare providers where the number of events is small.
So how do we know that a truly poorly performing provider will actually be correctly identified from its observed SMR? The control limits on funnel plots are drawn to limit the probability of falsely identifying a provider with true event rates exactly equal to that expected (ie, true SMR=1).11 ,13 However, if a provider is truly performing differently from that expected (ie, true SMR≠1), what is the probability (statistical power) that this will be detected? It is obviously desirable that the probability of identifying a provider which is performing differently from that expected should be high. However, it is difficult to know what this probability is for any given situation.
An example
We can illustrate this problem using data on mortality before discharge from neonatal care. A funnel plot of SMRs by primary care trust (PCT) is shown in figure 1. The SMRs were derived using data from The Neonatal Survey, an audit of inpatient neonatal care for the East Midlands and Yorkshire regions of England,14 for babies born at 20–32 completed weeks of gestational age, from 2008 to 2010. The expected number of deaths for each PCT was calculated by applying the observed casemix specific mortality rates seen in the other PCTs to the babies of each PCT in turn. The case specific rates were obtained for each level of the CRIB-II score, a clinical risk score for babies. Further details about the calculation of the expected number of deaths can be found in The Neonatal Survey Report 2010.14
For PCT ‘A’, 13 deaths were observed over the 3 year period, and for this population, 7.3 deaths were expected. This gives an observed SMR of  . However, this is an estimate of the true SMR and will differ due to random variation.
If the value of the true SMR for babies in PCT ‘A’ really was 1, the probability that an observed SMR for PCT ‘A’ would fall above the upper 95% control limit is less than 0.025 (this is how the value of the limit is defined).
On the other hand, if the true SMR for PCT ‘A’ was not 1, it is possible to use the methods outlined in box 1 to calculate the probability that an observed SMR for PCT ‘A’ would fall above the upper limit. So, for example, if the underlying risk of death was actually 20% higher in PCT ‘A’ than in the other PCTs (ie, true SMR=1.2), how likely is it that an observed SMR for this PCT would lie above the 95% upper control limit? Using the methods in box 1, the probability of this is only 0.034. Therefore, putting this into context, even if the overall risk of inhospital death for babies from PCT ‘A’ was really 20% higher than that for babies from the other PCTs, the probability that this would be identified from a funnel plot is only 0.034 (a chance of only 1 in 30).
Box 1
Funnel plot limits for the standardised mortality ratio (SMR)
The SMR is defined as the ratio of the observed number of events (O) to the number expected (E), calculated using the observed event rates from a reference population: that is, SMR=O/E. Assuming that the observed number of events is an observation from a Poisson distribution with mean λ, upper and lower control limits can be drawn on a funnel plot around the value of the SMR of 1—that is, the value of ‘no difference’ from the reference population. For 100 (1−2α)% limits the upper control limit U is defined as xU/E, where xU is the largest integer such that P (O≥xU | λ=E)≥α.12 In clinical studies, 95% and 99.8% control limits are usually used and the properties of these values for control limits were investigated in this paper.
Power to identify truly divergent performance
In practice, the true SMR of a healthcare provider will be unknown and any decision will be based on the observed SMR. However, the probability that an observed SMR for a healthcare provider with a true SMR different from the reference population can be calculated for any hypothesised scenario using the probability function of the Poisson distribution.
If the underlying true SMR of a healthcare provider is λT/E, then the probability that an observed SMR from this provider will fall above the upper limit for 100 (1–2α)% control limits is given by P (O>xU | λ=λT), where xU is defined as above.
For example, for a healthcare provider where the expected number of deaths (E) is 10, the value of the upper 95% control limit for the funnel plot (ie, xU/E) is 17/10=1.7, since the probability of observing 18 or more events is <0.025 (ie, α). If the true SMR for this provider was actually twice that in the reference population (ie, λT/E=2, so λT=20), then the probability that an observed SMR from this provider will fall above the upper 95% control limit is 0.78—that is, P (O>17| λT=20).
Indeed, even if the babies from PCT ‘A’ were twice as likely to die before discharge as babies from other PCTs (ie, true SMR=2), then the probability that an observed SMR for this PCT would lie above the 95% upper control limit would still only be 0.49 (a chance of 1 in 2).
Probability of identifying an outlier
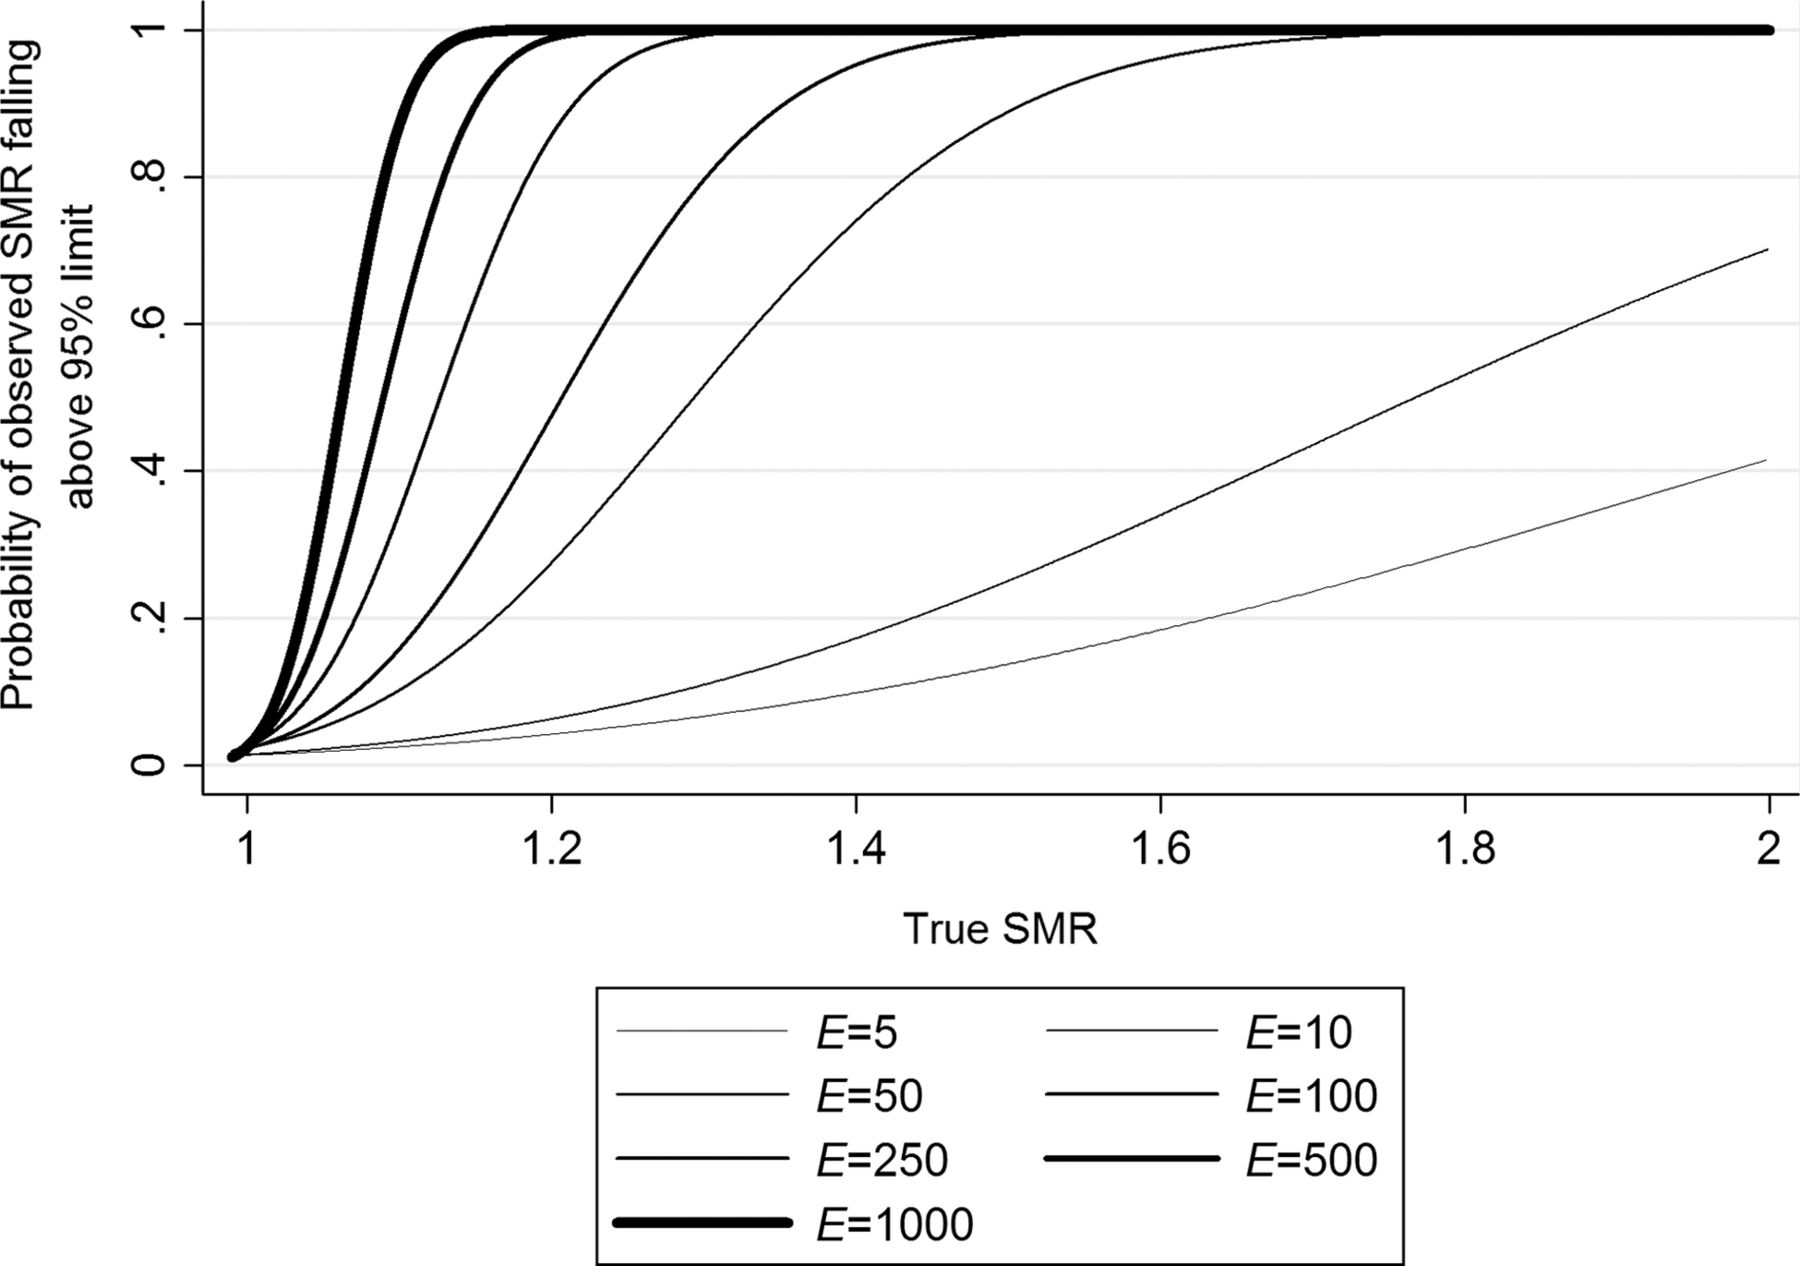
In general, the probability of a provider being identified as falling above the upper limit when it truly is performing differently from the reference can be calculated using the method outlined in box 1. For this paper, the probabilities were calculated for seven different values for the expected numbers of events: E=5, 10, 50, 100, 250, 500 and 1000. The smaller numbers would represent a rare event or small population and the larger numbers a frequently occurring event or a large population. For each of these values of E, the probability that an observed SMR would fall above the upper 95% and 99.8% control limits was calculated for different values of the true SMR. These probabilities were plotted for values of the true SMR from 1 to 2, a range of true SMRs likely to be experienced in medical practice (figures 2, 3). So, for example, with a true SMR of 1.2 and E=50, the probability of an observed SMR falling above the 95% limit (figure 2) is about 0.3.

Statistical power of an observed standardised mortality ratio (SMR) falling above the upper 95% control limit of a funnel plot against the true SMR. Each line represents a different expected number of events, E.

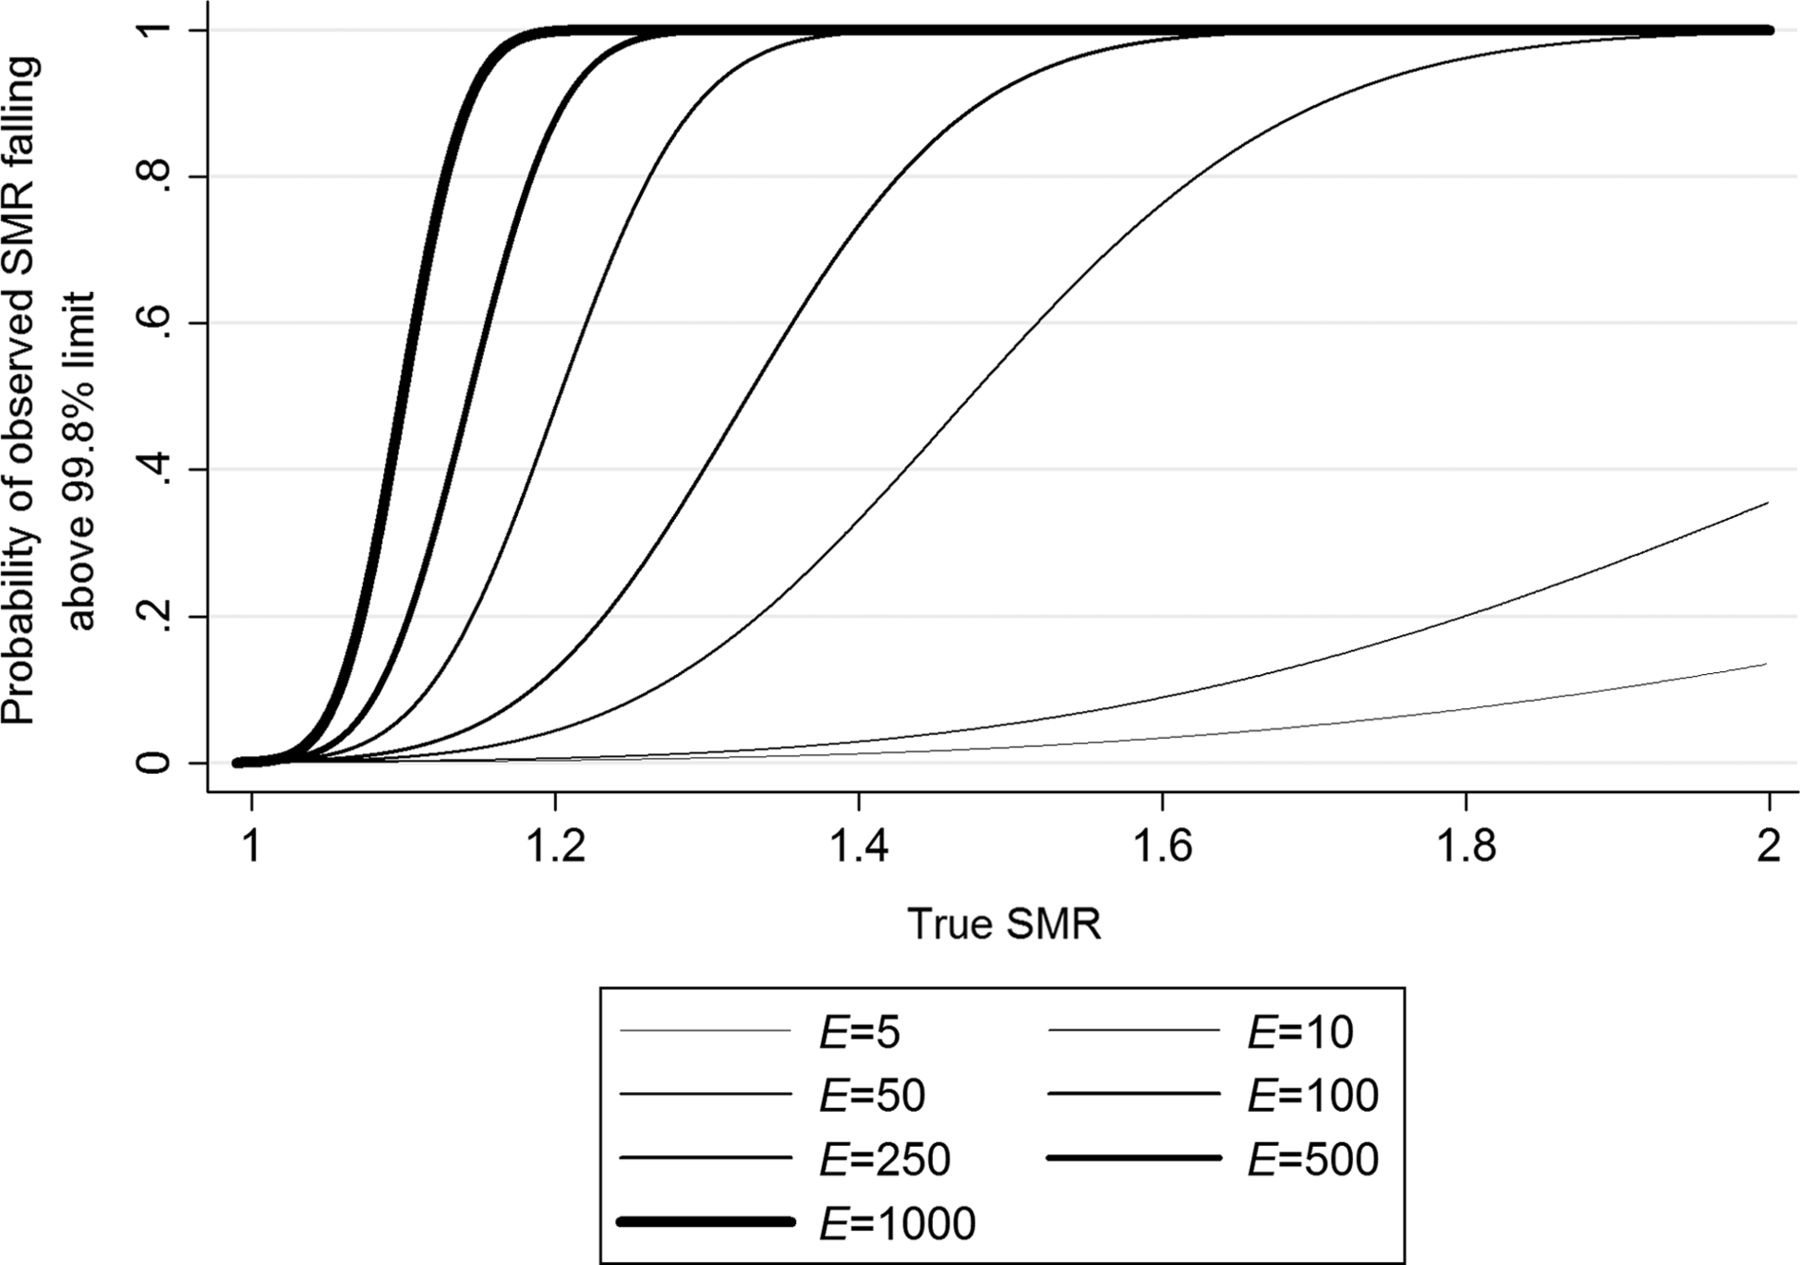
Statistical power of an observed standardised mortality ratio (SMR) falling above the upper 99.8% control limit of a funnel plot against the true SMR. Each line represents a different expected number of events, E.
In addition, values of the true SMR were calculated to show when an observed SMR would fall above either control limit with a probability of 0.5, 0.8 and 0.9 for each of the expected number of events used above (table 1). The value of 0.5 represents the point at which a provider is as likely as not to be identified, whereas 0.8 and 0.9 represent values at which a provider is highly likely to be identified— that is, 80% or 90% of the time. Given E=100, the chance of detecting a true SMR of 1.2 in a provider using 95% control limits is 50%. Similarly, a true SMR of 1.30 will be detected with 80% probability and 1.35 with 90% probability.
Value of true underlying SMR where the probability of an observed SMR falling above the upper control limit of a funnel plot is 0.5, 0.8 and 0.9 by expected number of events
Effect of control limit (95% or 99.8%)
From figures 2 and 3 it is possible to see the probability of an observed SMR falling above the upper 95% and 99.8% control limits of a funnel plot for a range of true SMRs for the chosen expected number of events. For example, if it is hypothesised that a healthcare provider has a true SMR of 1.2 (ie, the risk of an event, such as death, occurring was actually 20% higher for that provider than the others), by reading up from this value on the x axis to the line representing the desired value of E, it is possible to read off the y axis the probability that an observed SMR will fall above the upper control limit. As the value of E increases, smaller differences in the value of the true SMR from 1 were required to identify a provider with any given probability. Selected values are also shown in table 1.
When E is small, the value of the true SMR would need to be extreme for there to be a high probability (eg, >0.8) that an observed SMR would fall above the 95% control limit. For example, when E is only 5, then to have a probability of 0.8 of detecting a provider as an outlier by falling above the upper 95% limit, the true SMR would need to be 2.73 or more— that is, the risk of an event occurring in that provider would need to be 2.73 times that of the reference population.
When 99.8% control limits are used, the provider would need to be performing with a true SMR of 3.4 before the probability that it would be detected was at least 0.8—that is, the risk of an event occurring in that provider would actually need to be 3.4 times that of the reference.
Effect of the size of the number of expected events (E) for a population
The situation above concentrates on the scenario where a small number of events are expected. As the value of E increased, smaller differences in the value of the true SMR from 1 are required to identify an outlier with any given probability. For example, when E is 500, a provider with a true SMR of only 1.13 would have a probability of 0.8 of being detected as an outlier with the 95% limit: for the 99.8% limit, a true SMR of 1.18 is required. Thus for a more frequently occurring event or in a larger population, a higher chance of being detected as an outlier will occur for much smaller differences in the value of the true SMR from 1 compared with an infrequent event or in a small population.
Discussion
We investigated the probability of a healthcare provider being identified as an outlier on a funnel plot for a range of expected numbers of events (E). Unsurprisingly, this probability depends on both the value of the true SMR and the value of E. The value of E is determined by both the population size (the number of patients cared for by a provider) and the incident rate of the outcome.
Expected number of events (E)
When E was small, the provider had to be performing very differently to that expected to have a high probability that an observed SMR would fall above either a 95% or 99.8% control limit and thus be detected as an outlier.
Conversely, when the value of E was large, the provider only needed to be performing slightly differently from the reference for there to be a high probability that an observed SMR would fall above the 95% and 99.8% limits and be detected as an outlier. Therefore, with a large population (such as an NHS trust) or a high number of expected events, a provider is highly likely to be identified as an outlier when the true SMR is only slightly different from 1. Thus although these considerations argue in favour of large sample sizes, specifically a large value of E, a provider may be identified as an outlier even when its divergence from that expected is of little or no clinical importance.
While higher values of E are likely to relate to outcomes for larger healthcare providers such as NHS trusts, rather than for small subspecialties and individuals (eg, surgeons), there is not such a clear distinction for small values as rare outcomes in larger providers could still generate small values for E. Therefore, when the sample size is large but there are a small number of events (eg, infections,15 deaths or postoperative adverse outcomes16–18), there is still a limited probability of detecting outlying performance.
In larger providers, the SMR is often used for calculating publicly disclosed hospital wide mortality statistics, such as the summary hospital level mortality indicator19 and the hospital SMR.10 Such a general approach of hospital wide SMRs has been recognised as being potentially problematic20–24 with concerns from professionals about the reliability and interpretation of such data. The use of more focused data from individual clinical specialties has been recommended20 ,25 ,26 but this will potentially lead to the increased reporting of datasets with a small number of events.16 ,27
What difference from that expected is important?
It is highly unlikely that any provider will be performing with a true SMR which is exactly equal to 1, so consideration should be given to the scale of any deviation that would be considered clinically significant and, therefore, should lead to the provider being identified as an outlier and subjected to further investigation. This decision should be based on the benefits and harm associated with the potential identification and investigation of a true aberrant provider versus unnecessary investigation of a provider with clinically ‘acceptable’ performance. Using a 95% limit corresponds to having a higher probability of detecting a true outlier, but a higher risk of falsely labelling a provider as an outlier, especially if many providers are studied. A 99.8% limit may better protect against falsely identifying a provider, but in return gives a lower probability of identification as a true outlier. This balance between benefits and harm may lead to the choice of an appropriate limit that is different from both 95% and 99.8%.
What differences are likely to be seen in practice?
It is unclear how large true underlying variations in routine outcomes are likely to be for healthcare providers. However, we would suggest that it is unlikely that values of the true SMR greater than 2 (ie, a provider performing with twice the event rate of the reference population) exist in western healthcare systems, with their various mechanisms to manage quality, such as having certified medical personnel and healthcare inspectorates. When considering studies on avoidable mortality, it may be argued that true SMRs may be even smaller. Typically, when E is not small, and not susceptible to large sampling error, the SMRs seen in practice appear to take values below 1.518 ,28–30: in the latest Dr Foster Hospital Guide, the highest reported value for the hospital SMR in an English NHS trust was 1.24.31 Indeed, in practice, while more extreme values for the observed SMR may be seen, it is likely that they are overestimates of the true SMR (ie, regression to the mean),32 although random effect methods may protect against this overestimation to some extent.33
What are the implications for this in practice?
Examples of healthcare providers not being identified from observed data when their true performance is outside of some threshold are by their very nature difficult to identify, as they would need to be identified in some other way. However, it seems conceivable that opportunities to investigate poorly performing providers (or to identify good practice) are likely to have been missed.
The increased emphasis on the use of funnel plots to report clinical outcomes7 ,11 ,34–41 means that this method is increasingly being applied to providers where the value of E is small. The probabilities of identifying a poorly performing provider shown in this paper suggest that the reporting of rare outcomes in this way may have only a limited role in healthcare monitoring. There is a low probability, when E is small, of providers being identified as outliers even if their true performance is substantially different from that expected. While the problem of small sample sizes and the low probability of identification (statistical power) is well recognised for clinical trials,42 we are not convinced that the problem has been widely acknowledged in healthcare monitoring.
What should be done in practice?
The choice of healthcare performance outcomes that are not rare may alleviate some of this problem but any choice of quality indicators is challenging,24 ,43 and this is particularly difficult within clinical specialties and subspecialties where the number of patients is small. In the UK, advice to regulatory authorities, funders, managers and clinical teams has been that statistical significance should be used when deciding which providers should undergo further investigation.7 However, we suggest that statistical significance alone is unlikely to fully inform these decisions. Missed opportunities to identify both good and poor quality care result in unnecessary harm to patients, who are increasingly being given the opportunity to determine where they wish to receive their care, as well as increased healthcare cost implications and negative consequences for the staff involved.
While it is important that, as far as possible, healthcare providers are not identified as outliers unnecessarily, as being investigated can have important consequences for the providers, patients and commissioners, it is also important that providers with a true clinically important divergent performance are identified and the reasons for this established. The findings of this paper add to previous calls for further discussion of the methods used in the routine reporting and comparison of rare outcomes between providers.33 ,44
Funnel plots for the SMR should be used with caution when the expected number of events is small, as the probability of identifying true outliers is likely to be small. On the other hand, when E is larger, care must be taken as a provider may be identified as an outlier even when its divergence is of little or no clinical importance.
References
Footnotes
-
Contributors The original concept for the paper was conceived by BNM and EWS. The statistical analyses were undertaken by SES and BNM. All authors contributed to the drafting of the paper and approved the final manuscript as submitted.
-
Funding HFL was supported by an innovation grant from the Department of Public Health, Erasmus MC.
-
Competing interests None.
-
Provenance and peer review Not commissioned; externally peer reviewed.