Article Text

Abstract
Background Identifying mechanisms to improve provider compliance with quality metrics is a common goal across medical disciplines. Nudge interventions are minimally invasive strategies that can influence behavioural changes and are increasingly used within healthcare settings. We hypothesised that nudge interventions may improve provider compliance with lung-protective ventilation (LPV) strategies during general anaesthesia.
Methods We developed an audit and feedback dashboard that included information on both provider-level and department-level compliance with LPV strategies in two academic hospitals, two non-academic hospitals and two academic surgery centres affiliated with a single healthcare system. Dashboards were emailed to providers four times over the course of the 9-month study. Additionally, the default setting on anaesthesia machines for tidal volume was decreased from 700 mL to 400 mL. Data on surgical cases performed between 1 September 2016 and 31 May 2017 were examined for compliance with LPV. The impact of the interventions was assessed via pairwise logistic regression analysis corrected for multiple comparisons.
Results A total of 14 793 anaesthesia records were analysed. Absolute compliance rates increased from 59.3% to 87.8%preintervention to postintervention. Introduction of attending physician dashboards resulted in a 41% increase in the odds of compliance (OR 1.41, 95% CI 1.17 to 1.69, p=0.002). Subsequently, the addition of advanced practice provider and resident dashboards lead to an additional 93% increase in the odds of compliance (OR 1.93, 95% CI 1.52 to 2.46, p<0.001). Lastly, modifying ventilator defaults led to a 376% increase in the odds of compliance (OR 3.76, 95% CI 3.1 to 4.57, p<0.001).
Conclusion Audit and feedback tools in conjunction with default changes improve provider compliance.
- anaesthesia
- audit and feedback
- implementation science
- quality improvement
Statistics from Altmetric.com
Introduction
Improving provider compliance with quality metrics is a perennial challenge in medicine. In addition to the potential harm done to patients by failing to meet evidence-based care goals, hospitals and clinics are under pressure to ensure providers meet standards of care. For example, in the USA, the Medicare Access and CHIP Reauthorization Act of 2015 created the Physician Quality Reporting Initiative (later renamed the Physician Quality Reporting System) requiring physician practices to report their compliance with government-accepted quality metrics. In anaesthesiology, there are nine quality measures, covering areas from beta-blocker administration in cardiac surgery to postoperative transfer of care.1 Incentivising physicians based on process and outcomes metrics is anticipated to reduce cost of care delivery while improving patient quality of life and overall outcomes.2
The impact of intraoperative mechanical ventilation strategies on patient outcomes is of interest in anaesthesiology. While under general anaesthesia, patients routinely require mechanical ventilation as neuromuscular-blocking agents are commonly administered to optimise surgical conditions. Maintaining large tidal volumes (VT; >15 mL/kg) was historically regarded as best practice to prevent pulmonary complications, at least in some patients.3 However, there has been increasing awareness that high median VT can lead to lung injury in patients with acute respiratory distress syndrome (ARDS), and limitation of VT to <8 mL/kg (VT8) of predicted body weight (PBW) is now a well-established component of lung-protective ventilation (LPV) strategies.4–6 It is not clear if LPV strategies improve outcomes for routine management of non-ARDS patients in the operating room,7 but there is no evidence that the implementation of LPV strategies is harmful.8 Significant provider variability has been noted in the use of LPV, most likely secondary to individual acceptance of these protocols.9 These observations have motivated us and other groups to implement interventions to improve the use of LPV strategies.
High-intensity interventions (such as just-in-time texts, alarms or pages) are expensive to implement and are not always effective in changing provider behaviour.1 10 11 Nudge-type interventions are another approach that may be used either alone or in combination with high-intensity interventions. The concept of the nudge intervention comes from the field of behavioural economics and describes methods of predictably altering behaviour without imposing policies, restricting alternative choices or providing economic incentives.12 Nudge interventions are increasingly being adopted to shape the routine decision making of clinicians and promote adherence to quality improvement (QI) efforts by introducing subtle changes to the clinical environment that encourage changes in provider behaviour. Nudge interventions are perceived as less intrusive and are generally achieved at lower cost.13 Two examples of nudge intervention are audit and feedback (A&F) dashboards and modification of default settings on medical devices.14 Dashboards can be as simple as a quarterly email highlighting provider compliance. Default choices on medical devices may also be modified such that clinicians must actively opt-out from settings consistent with established practice. Dashboards have been used in the healthcare arena to improve diabetes management,15 improve compliance with best practice prescribing patterns16 and provide feedback on patient length of stay.17
Default ventilator settings may play a significant role in LPV adoption. Each ventilator allows for adjustment of the default VT setting. A default VT setting of 700 mL on the ventilator exceeds an 8 mL/kg LPV target for most patients; for example, the target for a 193 cm (6-foot 4-inch) tall male is 694 mL. A recent study combining educational sessions with modification of ventilator defaults reported an almost 70% decrease in failure rates to provide ≤8 mL/kg PBW ventilation intraoperatively.18 Default choice modification for ventilation in the intensive care unit has also been reported.19 However, concerns have been raised that safety improvements achieved through standardisation would be mitigated through the reduction of critical thinking about various clinical decisions. More information is needed to understand how often intraoperative providers modify default ventilator settings to comply with LPV targets for the individual patient. There is also a lack of data examining how default choice modifications may strengthen the impact of other nudge interventions. Without answers to these questions, reducing default VT settings is not a clear-cut solution to improve provider adherence with LPV protocols.19
A preliminary analysis of internal data at our institution suggested that VT was frequently being selected on the basis of actual rather than PBW in the operating room. The practical result of this, in our patient population with above average rates of obesity, was VT delivery above accepted LPV thresholds. This information motivated us to undertake a stepwise QI project examining whether provider-level A&F dashboards (provider emails) coupled with altered ventilator defaults increased compliance with LPV strategies. We hypothesised that if the provider was exposed to a nudge-type intervention, then their compliance with VT8 would increase. We also hypothesised that there would be an additive improvement in compliance if two or more nudge interventions were combined. Finally, we hypothesised that there would be a differential effect of the dashboard nudge intervention on compliance depending on the provider role (attending vs non-attending).
Methods
This report conforms to the SQUIRE 2.0 guidelines for reporting new work to improve healthcare safety.20.
Context
Emory Healthcare is a large, multihospital healthcare system with two academic hospitals, two private practice hospitals and two academic surgery centres. The Department of Anesthesiology is present at all locations and uses a common anaesthesia information management system (AIMS) and a clinical data warehouse (CDW) that contains patient demographic, surgical case and anaesthesia data. A surgical case is defined as a single patient entering the operative theatre, undergoing surgery and leaving; during the study period, a patient may have been associated with multiple cases.
Anaesthesia care is delivered through a team-based approach, with care for each surgical case being provided by a combination of providers: attending anaesthesiologist physicians and non-attendings. Non-attendings include residents, fellows and advanced practice providers (certified registered nurse anaesthetists and anaesthesiologist assistants). This team-based approach always involves an attending physician maintaining responsibility for one or more concurrent patients, supervising a non-attending who maintains continuous presence in the operating room. Attendings prescribe and medically direct the anaesthetic plan. Only one attending anaesthesiologist is responsible for the care of a patient at a time; handoffs may occur among attendings and/or non-attendings indicating a transfer of responsibility.
Inclusion/exclusion criteria
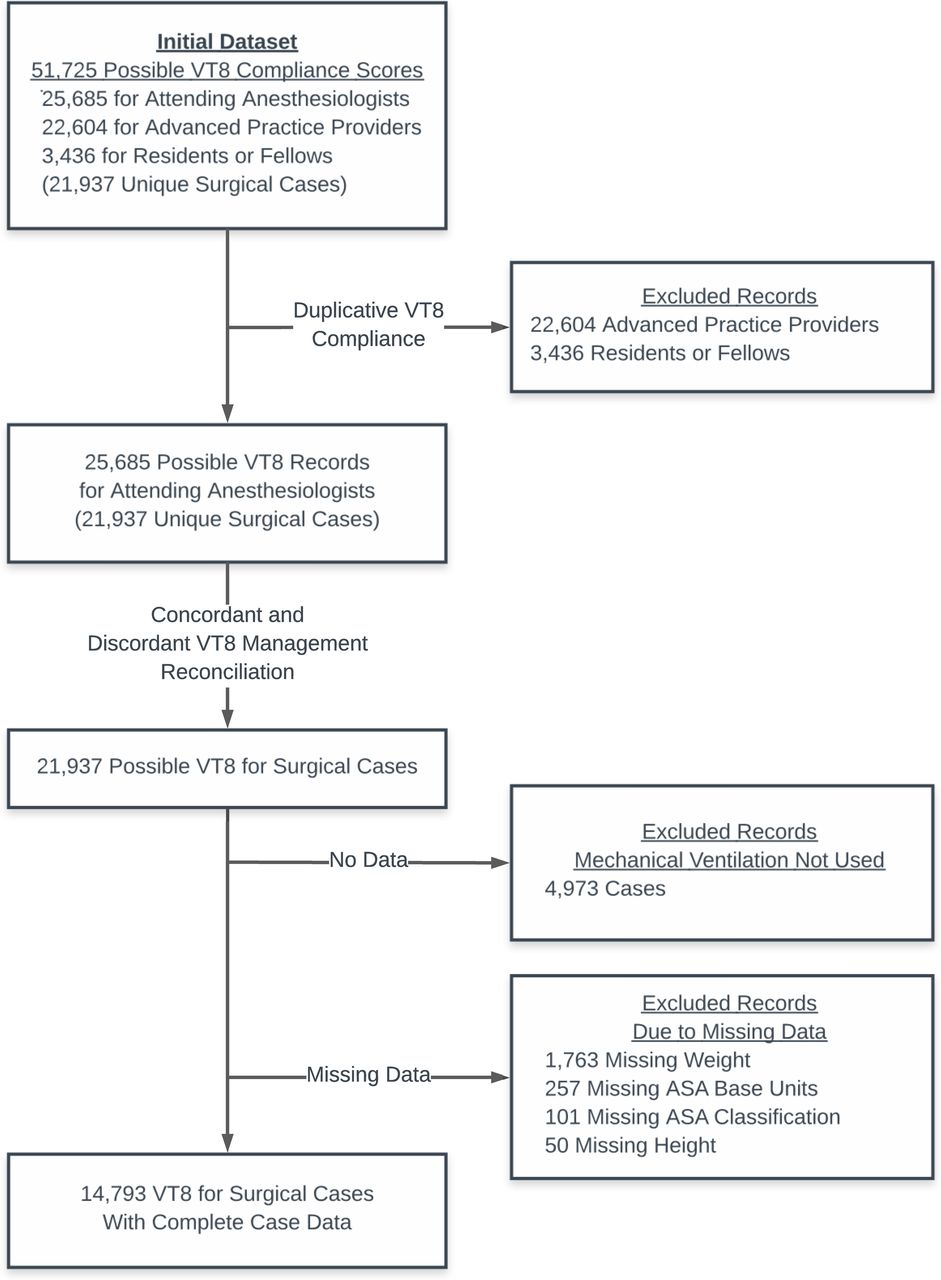
Patient demographics and data to calculate provider-level VT8 compliance were obtained from the CDW for surgical cases performed over a 9-month period (1 September 2016 and 31 May 2017; see table 1). All patients included in our analysis (i) received general anaesthesia; (2) were ≥18 years of age; and (3) of known height (within 2 years). A flow chart that details case exclusions due to missing data is shown in figure 1.

Flow diagram summarising data used and excluded. Further details about missing data are available in the online supplemental appendix, table S3. ASA = American Society of Anesthesiologists
Supplementary file 1
Case-level demographic and surgical characteristics
QI interventions
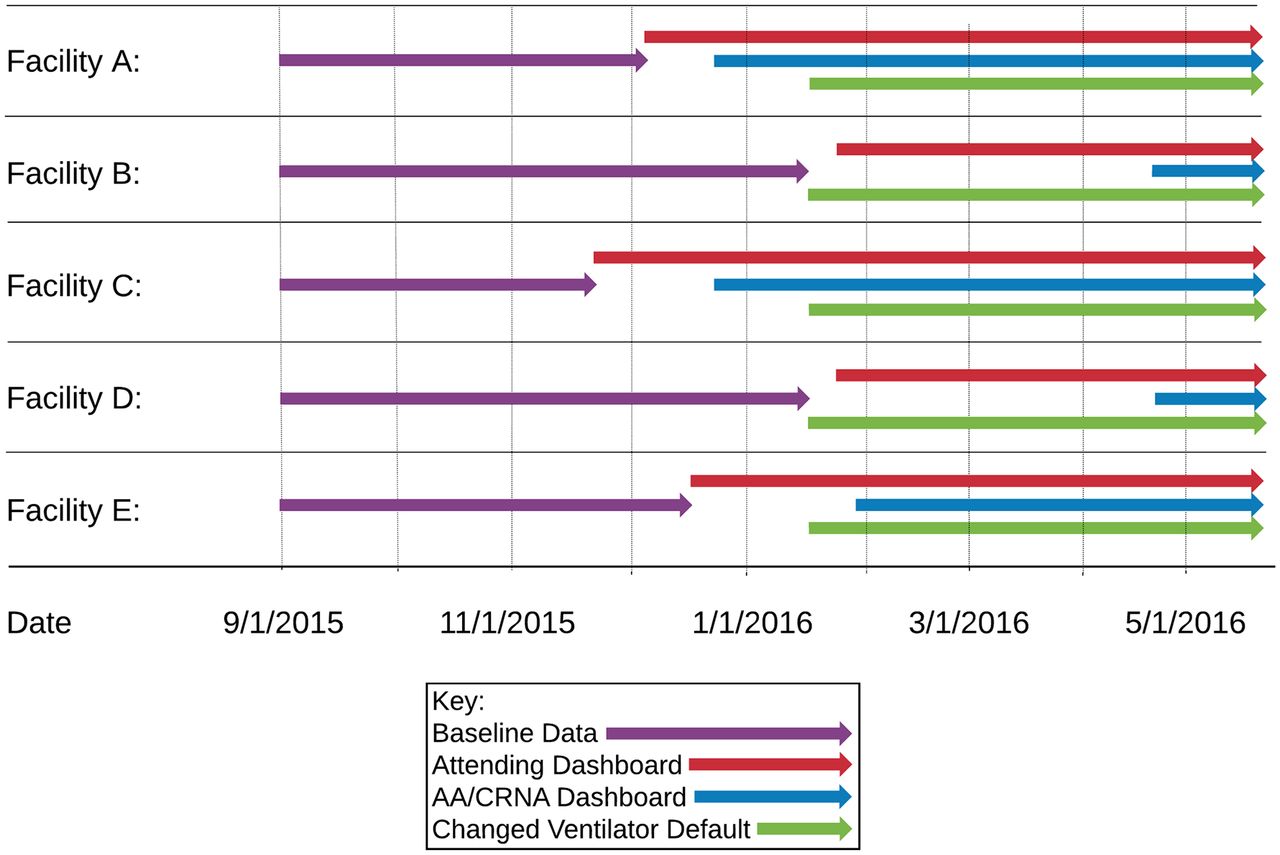
Two different interventions were examined in this study. One intervention was a reduction of the default VT setting on mechanical ventilators in the operating room from 700 mL to 400 mL. The other intervention was a quarterly email to each anaesthesia provider tabulating their ventilation compliance and how it compared with department-wide goals and compliance. The tabulated compliance rates and letter sent to providers is shown in the online supplemental appendix, dashboard example. The methodology for calculating VT8 compliance is described below. This nudge-type intervention is similar to A&F dashboard reports previously used to improve ventilation compliance.14 Our emails were sent to attendings and non-attendings (attending dashboards and non-attending dashboards). Due to operational considerations at our five different sites, the dashboard intervention occurred on different dates during our 9-month study. All ventilator defaults were changed system wide on the same day.
The order of all interventions is shown in figure 2, with specific dates for the interventions reported in the online supplemental appendix, table S1. The new default of 400 mL was chosen as this represents 8 mL/kg PBW for a 62-inch tall female or a 60-inch tall male, ensuring that most patients would, by default, be ventilated with ≤8 mL/kg PBW. Changes in the ventilator default settings were implemented by our biomedical engineers and confirmed by leadership and practising clinicians at each of the sites.

Timeline of the interventions. Specific dates are reported in the online supplemental appendix, table S1.
Provider level VT8 compliance
For each surgical case, VT was recorded each minute in the AIMS. We obtained time-stamped exhaled VT values and ventilation mode from the CDW. We identified periods of controlled mandatory volume ventilation, which included the following ventilation mode: volume control, pressure control and synchronised intermittent modes. Timestamps for providers responsible for care during each case were also obtained from the CDW. We calculated the median VT during periods of mechanical ventilation for the duration each provider was responsible for care. Providers were considered compliant if median VT did not exceed the calculated VT8 goal during their portion of the case. Calculation of the VT8 goal was based on PBW as calculated per the Devine formula based on the patient’s height and gender.21
Primary outcome
Our primary outcome, case-level VT8 compliance, was derived from attending-level VT8 compliance. As there is only one attending anaesthesiologist responsible for each minute of a surgical case, calculating case-level compliance from provider-level compliance is straightforward from the attending anaesthesiologist data. Only a small number (n=338, 2.3%) of cases had (1) an attending handoff and (2) different attending-level VT8 compliances. For these cases, VT8 compliance for the longest duration during the case was used. Further details regarding the calculation of VT8 compliance are available in the online supplemental appendix.
Statistics
The dependent variable in our analysis was case-level compliance with VT8 ventilation (1=compliant, 0=non-compliant). The primary independent variable was the overall intervention exposure, as described below. In addition, we included the following clinical independent variables: patient gender, height, ln(weight), American Society of Anesthesiologists (ASA) physical status score, ln(ASA base units) and facility. ASA base units were used as a proxy for surgical case complexity.22 A total of 171 of 14 793 (1.1%) of cases with inappropriately documented heights and weights, as determined by manual inspection of the quantile–quantile plot, were excluded from the final analysis.
To assign the primary independent variable for each surgical case, we determined the overall exposure of the case to the interventions. Based on the date and the facility, we determined whether a case had been exposed to (1) ventilator default change, (2) attending dashboard and/or (3) non-attending dashboard. Depending on these three exposures, a single surgical case was assigned one of the following overall exposure categories as a single seven-level categorical variable:
No intervention (baseline data).
Changing ventilator defaults alone.
Non-attending dashboard alone.
Attending dashboard alone.
Attending dashboard+changing ventilator defaults.
Attending dashboard+non-attending dashboard.
Attending dashboard+non-attending dashboard+changing ventilator defaults.
To determine the significance of the clinical independent variables, we built an overall multiple variable logistic regression model. This model included the primary independent variable and the clinical independent variables. The model tested the independent association of each of these variables with the primary outcome (VT8 compliance).
In order to compare the seven overall exposure categories, we built 12 pairwise multiple variable logistic regression models to specifically determine the compliance change associated with specific pairs of the exposure categories, as detailed in the online supplemental appendix, table S2.
This approach to pairwise regression analysis is necessary when there are (1) multiple levels to a single categorical variable in a multiple variable regression analysis and (2) there is heterogeneity in the underlying mix of samples for other independent variables used in the regression. The method has been used previously for this type of analysis.23–26
These pairwise models included the same clinical independent variables, primary independent variable and outcome variable. However, for these 12 pairwise models, data were only included in the regression analysis for cases within each specific pair of exposures being compared. In these pairwise logistic regressions, the overall exposure assigned to a case was entered in the model as a two-level factor, and the OR and its significance were then used to determine the impact of the intervention. For example, using cases exposed to category 1 (no interventions) and category 2 (changing ventilator defaults alone) in the logistic regression allows assessment of the impact of only altering the ventilator defaults. Using cases in category 4 (attending dashboard alone) and category 6 (attending dashboard+non-attending dashboard) allows assessment of the impact of adding the non-attending dashboard to the attending dashboard.
To correct for multiple comparisons, we adjusted the reported p values using Holm’s method based on 12 simultaneous hypothesis tests and adjusted the reported CIs using Bonferroni correction for 12 comparisons.27
Data analysis was performed in R V.3.3 (R Core Team, Vienna, Austria)28 using the RStudio platform.29 The ‘stats’ package in R was used to perform logistic regression analysis. Wald tests were performed using the ‘survey’ package,30 and receiver operating characteristic (ROC) analysis was performed using the ‘pROC’ package.31 Run charts were generated using the ‘qicharts’ package.32
Results
Study data characteristics
During our 9-month study period, 21 937 unique cases using ventilation were performed, of which 14 793 contained a complete dataset (67.4%) that matched our selection criteria. Demographic and surgical case data are summarised in table 1. Cases included cardiothoracic, general, gynaecological, neurological, otolaryngological, orthopaedic, plastic, urological and vascular surgical procedures.
Effect of clinical independent variables on VT8 compliance
Raw compliance rates and the results of the overall multiple variable logistic regression analysis are presented in table 2. The raw compliance rate increased from 59.3% to 87.8%. Run charts of raw compliance by facility are shown in the online supplemental appendix, figure S1. These demonstrate no clear secular trend in changing VT8 compliance in any of the facilities prior to the interventions. These run charts also demonstrate differences in the rate and magnitude of change in compliance depending on the facility. Nearly all the clinical independent variables included in the model were significant contributors to variability in the rate of VT8 compliance, as demonstrated by Wald test p values. The model could discriminate compliant from non-compliant cases well, as indicated by an area under the curve of 0.867 using ROC analysis.
Multiple variable regression examining the significance of each intervention and combination of interventions controlling for confounders
Effect of changed ventilator VT default on VTs delivered
We performed an analysis of ventilator settings prior to and following the change in default VT from 700 mL to 400 mL (online supplemental appendix, figure S2). This revealed that the median VT decreased from 470 mL to 412 mL subsequent to ventilator default changes. Before the default change, providers increased VTs more than 50 cc in 0.3% of cases and decreased more than 50 cc in 96.8% of cases. After the default change, providers increased VTs more than 50 cc in 30.6% of cases and decreased more than 50 cc in 14.2% of cases.
Pairwise regression analysis of the effects of the intervention
Pairwise multiple variable binomial logistic regression analysis was performed to test the difference between 12 different pairings of the seven exposure categories, and our results are summarised in figure 3.

Pairwise comparison of each possible intervention and combination of interventions. ORs and significances were calculated by performing multiple variable regression analysis of data sets containing data from each of the compared interventions only. P values were adjusted using Holm’s method for multiple comparisons (n=12 comparisons). CIs were adjusted using a Bonferroni correction also for 12 comparisons.
Relative to cases performed during the baseline period (no intervention), cases exposed to all three interventions were associated with statistically significant increased odds of VT8 compliance (OR=8.82; 95% CI 7.84 to 9.95, p<0.001).
Compared with baseline, the combination of attending dashboard and changed ventilator defaults intervention was associated with a statistically significant increased OR of compliance (OR=1.88; 95% CI 1.5 to 2.35, p<0.001). The OR of compliance was also significantly increased with the combined intervention of attending dashboard and non-attending dashboard compared with baseline (OR=2.75; 95% CI 2.3 to 3.31, p<0.001).
There was no change in the odds of compliance between the baseline period and cases exposed to the non-attending dashboard alone, nor to cases exposed to changed ventilator defaults alone. It should be noted that, due to the order and timing of interventions, only a small percentage of cases (94/14 793) were exposed to these interventions.
There was no significant difference between the changed ventilator defaults intervention and the combination of attending dashboard and changed ventilator defaults. However, adding changed ventilator defaults to the combination of attending dashboard and non-attending dashboard yielded a significantly increased OR of VT8 compliance (OR=3.76; 95% CI 3.1 to 4.57, p<0.001).
Compared with the attending dashboard alone, the addition of the non-attending dashboard to the attending dashboard was associated with a significantly increased odds of compliant ventilation (OR=1.93; 95% CI 1.52 to 2.46, p<0.001). Compared with the combination of attending dashboards and changed ventilator defaults, the addition of the non-attending dashboard to this combination was associated with a significantly increased OR of VT8 compliance (OR=2.36; 95% CI 1.69 to 3.29, p<0.001).
Discussion
In this QI study, we have demonstrated that phased introduction of provider dashboards and modification of default ventilator settings (two nudge-type interventions) improved provider compliance with LPV strategies. Changes in ventilator defaults were most effective when implemented in combination with dashboard interventions. Our analysis demonstrated that providers often change the delivered VT setting, regardless of the default setting. The information provided in the dashboards delineated a clear VT target with feedback on provider efforts, and improved compliance with the VT target was observed. This emphasises the need for all anaesthesia providers to understand care goals and the value of feedback related to provider-level adherence.
Dashboarding performance has been well described within the business literature and is incorporated into both the Lean and Six Sigma QI toolsets to quickly identify processes that need attention.33 While having demonstrated efficacy in other industries, dashboards are still in their nascent form in healthcare, and fundamental questions remain on how to best apply this tool. While dashboards have been used by hospital management primarily for financial,34 operational2 or compliance measures,35 36 their use in improving clinician performance have been mainly at a patient level37 or at the facility/unit level.38–40
Two proposed simple methods for changing physician behaviour are educational sessions and changing default settings. While provider education can temporarily improve compliance, these improvements extinguish over time without continuing educaitonal support.41 A recently published article examining the effect of education efforts, development of departmental policy and providing department-level feedback demonstrated lower overall mean VT, but more than 20% of patients were still ventilated above 8 mL/kg PBW immediately preceding surgical incision following all interventions.18 Also, Frenzel and colleagues42 examined the use of provider A&F in conjunction with education in improving postoperative nausea and vomiting guideline compliance. This study reported that education and quarterly reports resulted in a 19% improvement in provider compliance. Without engaging in didactic interventions, our study demonstrated a 27% improvement in provider compliance with dashboards alone and a 48% improvement in compliance when providers were given individualised feedback and ventilator defaults were changed. We did not engage in any significant educational efforts outside of the dashboard.
These findings stand in contrast to efforts such as provider alerting, in which real-time feedback via text messages or pages are used to drive provider care behaviour. These systems have generated great interest in the era of big data and real-time analytics.43–45 Our study suggests that gains in compliance with care goals can be made via a dashboard that is much simpler to implement and automate than real-time alerts system. Much more work will need to be done to understand the role for each of these strategies in the achievement of systems-level care goals.
We have two major hypotheses as to the differences in the rate and magnitude of the compliance changes seen between the different facilities in our study. First, there may be cultural differences among the practitioners in academic centres versus those working in a private practice environment. As mentioned, most practitioners accepted target ventilation strategies without debate. However, there may be greater latency in the acceptance of these strategies outside of academia. Second is the possibility that providers may be better influenced by local leadership. Our QI divisional leadership is more closely associated with the academic facilities that saw the greatest improvements in compliance. This would be consistent with previous findings that organisations with higher levels of transformational leadership and implementation leadership have better knowledge of and attitudes towards evidence-based practices.46 If this was a factor in the success of our individualised A&F dashboards, it supports previous work demonstrating that top-down approaches meet with limited success. QI efforts must be organised and led by local leadership, increasing the time and effort required to achieve significant change.
Changing default ventilator settings is consistent with the Lean term ‘poka-yoke’, which roughly translates to ‘make a process mistake-proof’. The poka-yoke concept is to change workflow in such a way that errors are prevented by reducing the cognitive load associated with steps in the workflow.47 However, without provider acceptance, these activities do not achieve the desired performance; Chiao and colleagues decreased ventilator settings from 600 mL to 400 mL and saw a rise in adherence to LPV (defined as a mean VT of 6–8 mL/kg PBW and peak end-expiratory pressure ≥5 cmH2O) to only 23%, from a baseline rate of 6%.48 While changing defaults to improve compliance has been described in the anaesthesiology and critical care literature, combining these efforts with individualised feedback has not been examined intraoperatively. This approach has been used with great success in improving compliance in the intensive care unit setting.14 49 50 However, concerns have been raised that safety improvements achieved through standardisation would be mitigated through the reduction of critical thinking about clinical decisions. More information is needed to understand how often intraoperative providers modify default ventilator settings to comply with LPV targets for the individual patient.
The literature is supportive of using LPV strategies in patients with ARDS.51–54 However, the literature is mixed when evaluating the use of lung protective strategies in patients without ARDS.55–58 The delivery of excessively large VT may deliver too much energy to lung tissue, leading to tissue damage and risk of postoperative pulmonary complications.59 The Lung-protective ventilation initiated in the emergency department (LOV-ED) study demonstrated that an LPV protocol improved outcomes even for relatively brief periods of mechanical ventilation, implicating the relatively brief periods of operating room care provided by anaesthesiologists.60
We also note that an appropriate choice of VT represents only one aspect of a lung protective strategy bundle, which may also include avoiding excess driving pressure, selection of appropriate Positive end-expiratory pressure (PEEP) based on fraction of inspired oxygen requirement and reduction of the fraction of inspired oxygen to the minimum necessary. For our study, we chose a relatively straightforward and easily measurable metric based on data in the electronic medical record, harnessing automation to provide feedback. A non-controversial and easily measured choice of metric may be a critical determinant of success. At our institution, most practitioners accepted the target ventilation strategies without debate.
Our QI implementation and subsequent analysis have several limitations. Like all retrospective analyses, our findings are potentially subject to selection bias. The interventions were implemented as part of a pragmatic QI project and not designed as a formal human subjects research project. As such, the dates of the interventions were not consistent across facilities, and we neither randomised the order of the interventions nor specified the length of time between interventions. This resulted in a limited sample size where the ventilator defaults were changed prior to implementation of the dashboard, and it also limited the sample size of the non-attending dashboard only group. Nevertheless, our data suggest that dashboards are effective in changing provider behaviour towards providing LPV, especially when combined with changed ventilator default settings.
In conclusion, individualised dashboards and modification of default ventilator settings, simple nudge-type environmental modifications, improved provider compliance with ventilation metrics. These and other nudge-type interventions can be easily implemented and may be important cost-effective components of successful QI efforts to improve outcomes and help practices maintain solvency under ever-increasing financial pressure. However, there may be substantial differences in the success of the approach depending on the context. Further research is needed to identify the implementation pathways that lead to success in various contexts, which may be aided by mixed-methods approaches that could identify differences in provider attitudes towards individualised compliance reports.
Acknowledgments
The authors would like to acknowledge the efforts of Ms. Lisa K Cogdill, MPH, and Benjamin Amoateng, MPH, for their efforts in creating and maintaining the dashboards.
References
Footnotes
Contributors VNO-S helped design the data review, was primary author of this manuscript and performed statistical analysis of the data. GSE analysed the data, provided statistical guidance and critically revised the manuscript. CSJ reviewed the data and analysis plan and critically revised the manuscript. GCL designed the quality improvement project and the subsequent study and coauthored the manuscript.
Funding The authors have not declared a specific grant for this research from any funding agency in the public, commercial or not-for-profit sectors.
Competing interests None declared.
Patient consent Not required.
Ethics approval Approval for secondary data analysis with the intent to generalise and publish findings was granted by the Emory University Institutional Review Board (IRB00095280).
Provenance and peer review Not commissioned; externally peer reviewed.
Data sharing statement There are no unpublished data available from this study.