


Abstract
Structured conceptualization is a specific form of concept mapping that is a mixed methods participatory approach that combines group processes (brainstorming, sorting, group interpretation) with a sequence of multivariate statistical analyses (multidimensional scaling, hierarchical cluster analysis). Concept mapping’s relevance to health care quality and services is described. The basic steps and analysis sequence in the concept mapping method are outlined and a brief example of the results for a health planning project are presented. Several examples of the use of concept mapping in health are provided.
Contemporary health care faces a broad array of challenges, including how to define and assess quality of care and quality of life, plan and evaluate services, define and implement safety procedures and measures, and utilize evolving technologies effectively. To accomplish such a range of tasks, it is essential both to work across a wide variety of disciplines and to include a diverse collaboration of stakeholders at all levels of the health system; including the public, health practitioners, health administrators, policymakers and politicians, and the research community. These challenges place considerable burdens on the health care system and require processes and methods that can address the complexity and the demanding requirements of such work.
Demands on the health care quality control area in particular are well illustrated in the accompanying article by Nabitz and Roeg [1], who undertook the development of a conceptual framework for operationalizing performance indicators for addiction treatment centers that would help ensure that the resulting metrics would be aligned with the European Foundation for Quality Management (EFQM) Excellence Model. To accomplish this well they needed to incorporate and integrate the demands and perspectives of a diverse group of stakeholders.
To address challenges of this nature, social researchers have over the past three decades developed a methodology called structured conceptualization [2] or, a bit more colloquially, concept mapping, which has been applied successfully in addressing complex issues in health care. [The term ‘concept mapping’ refers to any methodology that is used to produce a picture or map of the ideas or concepts of an individual or group. There are several such methodologies and analogous approaches that go by such labels as ‘idea mapping’, ‘mind maps’, ‘causal mapping’, or ‘cognitive mapping’. These are distinct from the group concept mapping approach described in this paper because they were designed for use by individuals, as a tool to enhance a person’s creative thinking about a problem or to improve the organization of their thought (e.g. as a visual alternative to outlining). In this paper, the term ‘concept mapping’ is used only to refer to the structured group conceptualization addressed here.] This type of concept mapping [3] is a mixed methods participatory group idea mapping methodology that integrates well-known group processes such as brainstorming [4] and unstructured sorting [5,6] with the multivariate statistical methods of multidimensional scaling [7,8] and hierarchical cluster analysis [9,10].
Concept mapping has several notable characteristics relevant for addressing problems in contemporary health care:
It is purposefully designed to integrate input from multiple sources with differing content expertise or interest.
It uses sophisticated and rigorous multivariate data analyses to construct the maps.
It creates a series of maps that visually depict the composite thinking of the group.
The maps constitute a framework or structure that can immediately be used to guide action planning, program development or evaluation and measurement (as in the Nabitz and Roeg case).
The concept mapping process involves six major steps. In the preparation step, the focus for the mapping project is identified, participants selected, and project schedule and logistics determined. The generation of ideas is usually, but not necessarily [11], accomplished through some form of brainstorming, either live or over the Web. The ideas generated are synthesized; and in the organization phase participants sort them and then rate them for one or more variables of interest (e.g. relative importance, feasibility). The representation of the ideas in maps is accomplished through a sequence of multivariate statistical analyses. Participants are actively involved in the interpretation of the resulting maps. In the utilization phase, the maps and associated results are used to address the purposes of the project.
The concept mapping analysis encompasses the organization and representation phases. The core data for a map come from the unstructured or free sort [5,6] where each participant groups the generated statements into piles of similar ones. Participants are free to use as few or as many piles as they think necessary to arrange the statement set meaningfully in terms of their similarity. These data are decidedly judgmental and qualitative. To use the data in the subsequent quantitative multivariate analyses, each sort is first converted to a 0,1 co-occurrence matrix [6] that has as many rows and columns as there are statements, where a 1 is entered into a cell if the row and column statement pair were placed by the participant in the same pile and a 0 is entered if the statements were not sorted together in a pile. These matrices are then summed across all participants, yielding a similarity matrix that indicates the number of participants that sorted each pair of statements together. This summed square similarity matrix is the input for multidimensional scaling (MDS) analysis [7,8] which takes (dis)similarity data and represents them as distances in Euclidean space. In concept mapping, the MDS solution is typically restricted to two dimensions to allow for the integration of additional information from cluster and rating analyses. Thus, for each statement the MDS analysis yields an x and y value. When plotted in a bivariate plot these constitute the basic point map form of the concept map. The MDS x,y values are the input for hierarchical cluster analysis using Ward’s algorithm [9,10,12], which has the effect of partitioning the MDS statement map hierarchically into non-overlapping clusters. Typically the analyst facilitates the discussion of a subgroup of participants who select the number of clusters most useful for the purposes at hand. This cluster arrangement is superimposed on the point map (the cluster map) and the participant group typically names these clusters. If rating data were collected in the project, they can be averaged for all participants and for any subgroups and can be overlaid on a point or cluster concept map to identify meaningful patterns.
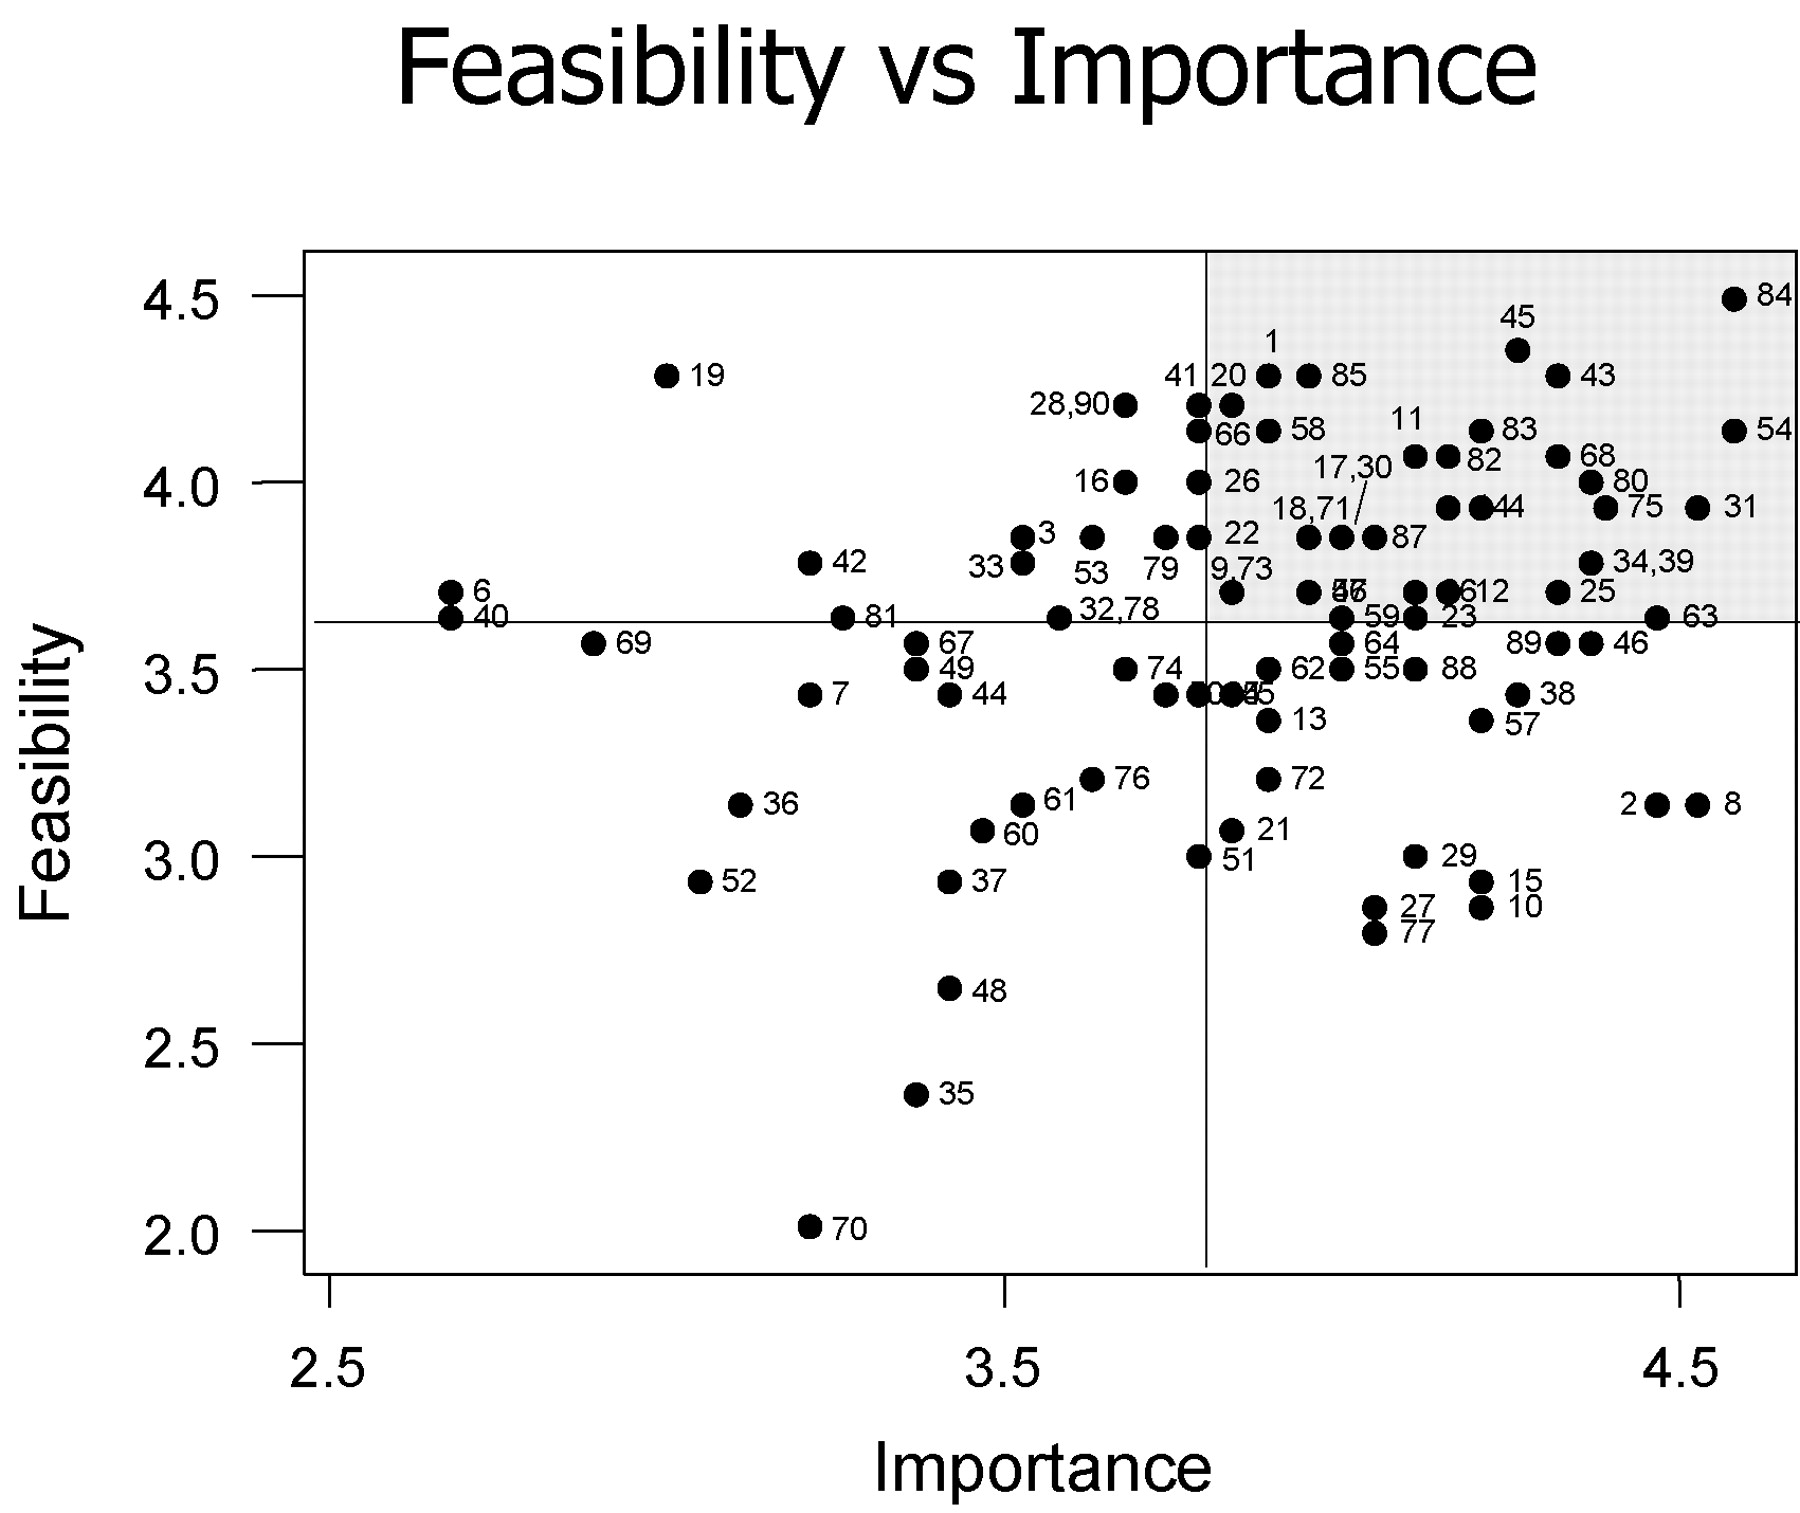
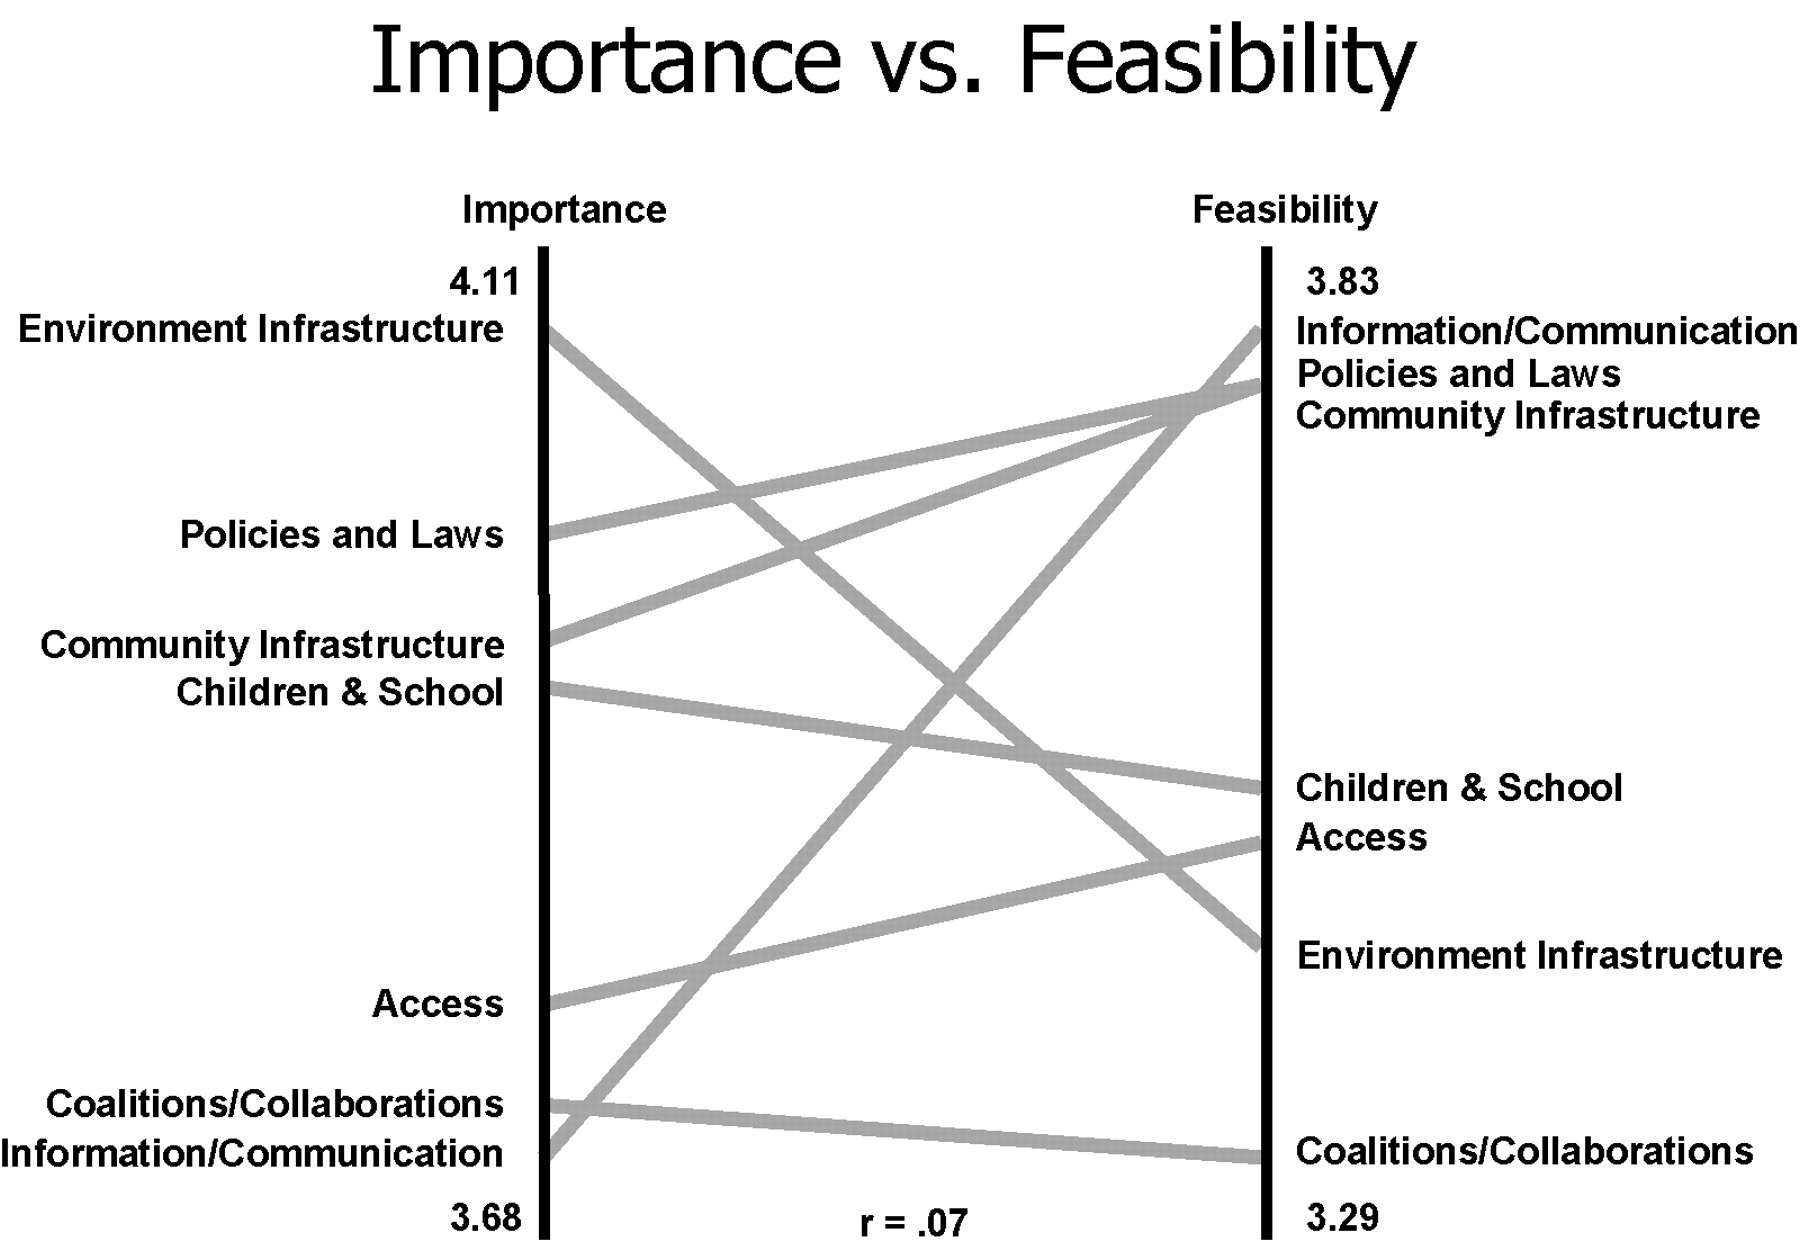
In addition to the point and cluster maps (with or without ratings overlaid) several graphics have proven indispensable, especially for comparing multiple patterns of ratings at either the cluster or point level. The pattern match [13] or ‘ladder’ graph, is a bivariate comparison of the cluster average ratings that shows aggregate patterns and can be used to compare for a single variable the ratings of multiple groups or waves of measurement, or to compare multiple variables. Instead of being arranged in typical x,y axis form, the two axes are set vertically side by side and joined by a separate line for each cluster that indicates average cluster rating. This arrangement makes it much easier than a bivariate plot does to detect visually whether there is overall agreement between patterns and where the patterns may specifically disagree. The ‘go-zone’ graph is a bivariate plot of two patterns of ratings at the statement level. The bivariate space is divided into quadrants based on the average x and y values. For example, when comparing an importance and feasibility rating of the statements, the go-zone is the quadrant showing the statements simultaneously rated above average in both importance and feasibility. While pattern matching is especially useful for high-level pattern assessment, go-zones are particularly valuable for detailed use of the maps for planning or evaluation at the statement level. The point and cluster concept maps, with various rating data overlaid, the pattern matches and go-zones, and accompanying detailed tabular statistical results constitute the primary analytical results that the participants subsequently interpret and utilize.
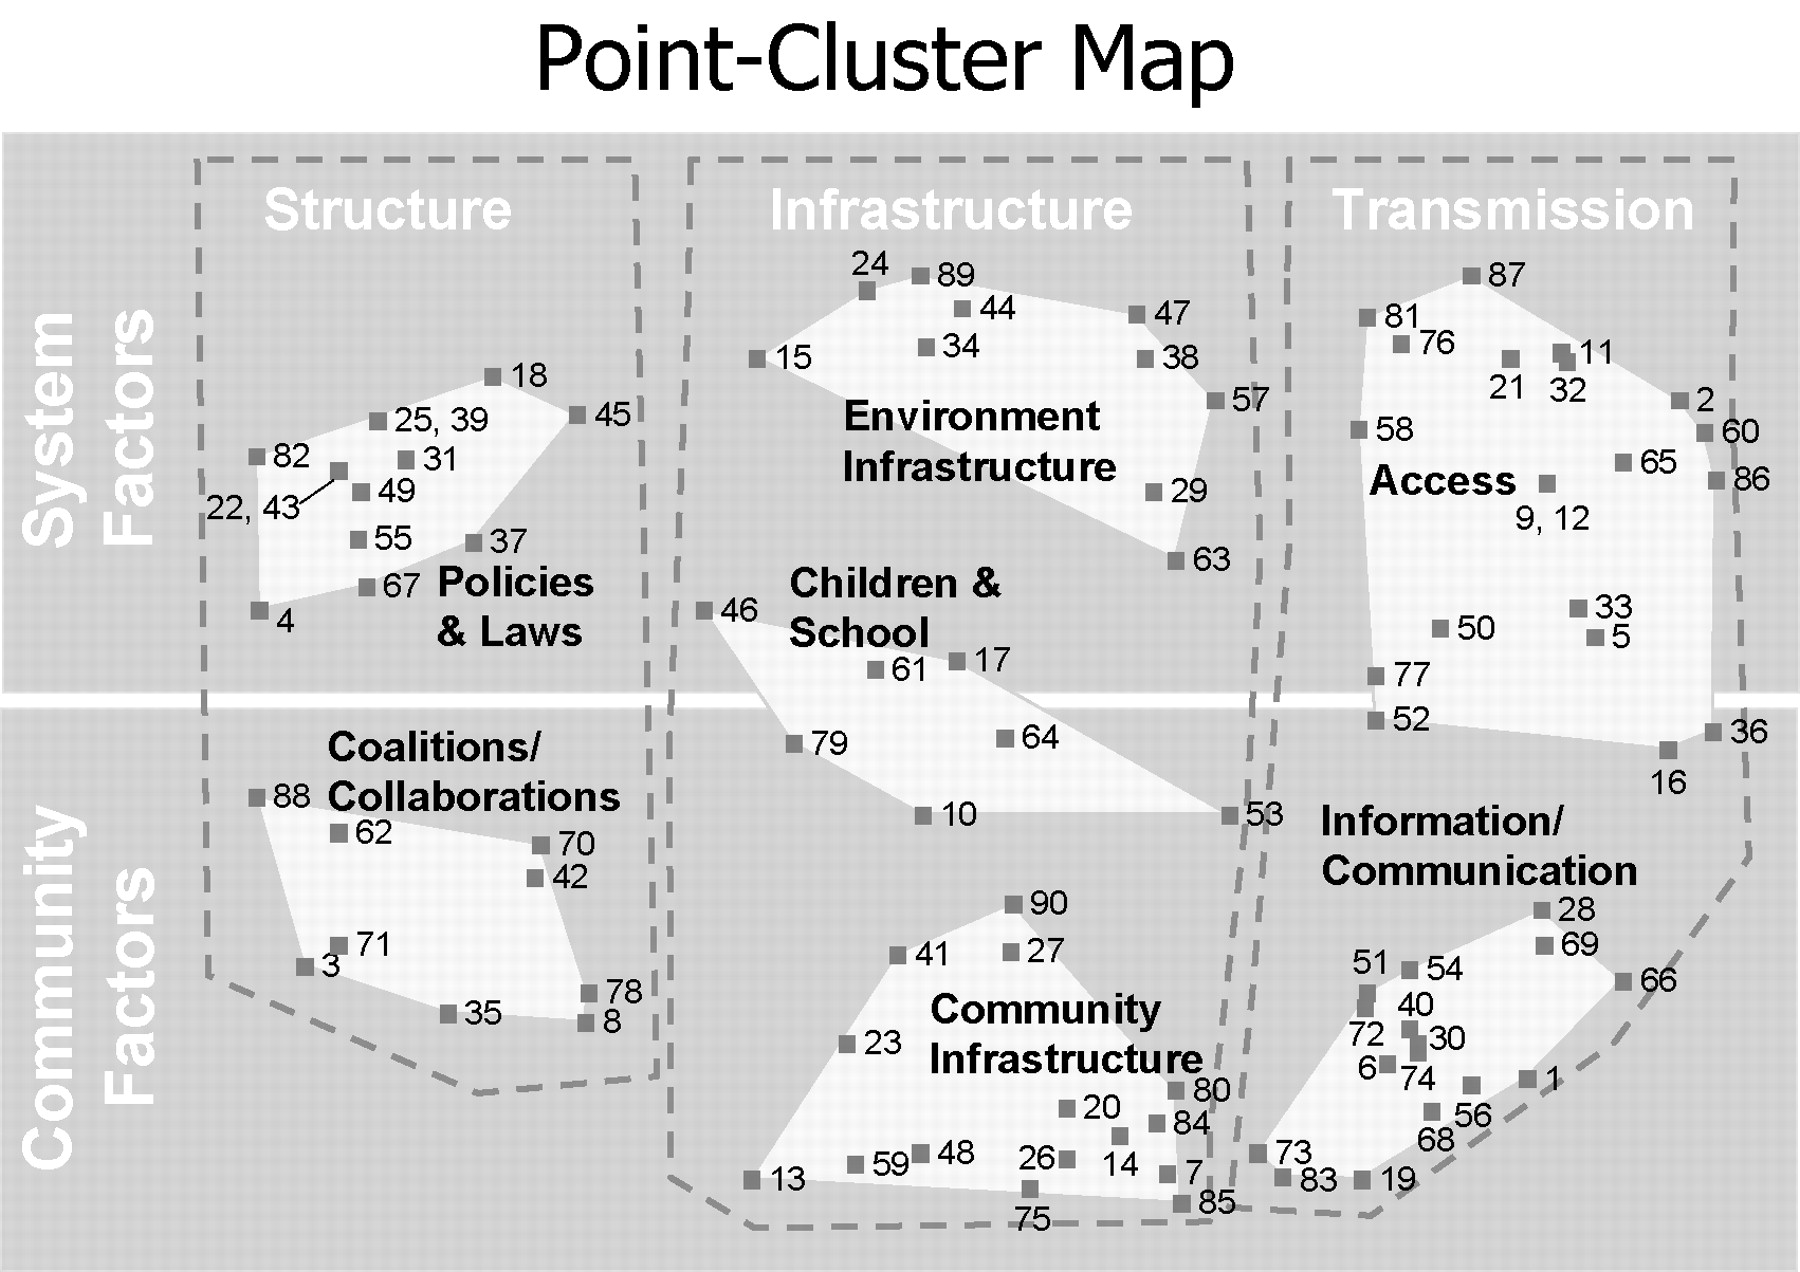
To illustrate the use of concept mapping in health care contexts, the basic results from a health planning project [14] are presented briefly here. The project was undertaken because a state in the USA needed to develop rapidly a comprehensive statewide plan for the use of significant unexpected funds from the tobacco settlement agreement. Concept mapping was especially appropriate because of the complex nature of the task and the political need for both speed and involvement of multiple stakeholders (including all constituencies across the state and a variety of subject-matter expert consultants throughout the USA). Figure 1 shows the point and cluster concept map of the 90 brainstormed ideas, where MDS analysis determined the point location and hierarchical cluster analysis partitioned the point space into seven clusters of issues that were interpreted by participants as a two-dimensional matrix that crosses domain (system versus community factors) by level (structure, infrastructure, or transmission).
A ‘point cluster map’ showing the 90 ideas arranged by multidimensional scaling and grouped into seven non‐overlapping partitions by hierarchical cluster analysis. The map was used to help in statewide planning for public health spending of tobacco settlement money in Hawaii, and provides a framework for subsequent follow-up evaluation.
Figure 2 shows the pattern match from the same project that assesses the correspondence between the cluster-level average importance (left axis) and average feasibility (right axis) ratings of the ideas. The match clearly shows that while information/communication issues were judged most feasible to accomplish, they were also perceived as relatively the least important.
A ‘pattern match’ based on the map in Figure 1 that shows the relationship between stakeholder estimates of the average relative importance and feasibility of the ideas averaged across clusters on the map. Horizontal lines suggest relative agreement while overlapping lines suggest relative differences. Pattern matches are especially valuable for detecting high-level patterns.
Figure 3 shows the bivariate plot of importance by feasibility for the 90 issues. The plot is bisected into quadrants by the average importance and average feasibility ratings for the issues. The upper right quadrant, labeled the ‘go zone,’ shows the issues that were rated above average by participants on both importance and feasibility. These issues would probably be the ones that should be addressed first in any plan that might result.
Bivariate ‘go zone’ plot showing importance by feasibility ratings for the 90 issues. The quadrants are constructed using the average x (importance) and y (feasibility) values. The go-zone quadrant on the upper right shows all statements that are above average in both importance and feasibility. Go-zones are particularly valuable for detailing subsequent planning or evaluation efforts.
Since its introduction almost 20 years ago [2], concept mapping methodology has been widely used in health care contexts for a diverse range of purposes and projects, including: developing conceptual frameworks for complex constructs (e.g. coping [15], depression [16], anxiety [17], a theory of care [18], quality of life [19] and quality of care [20], end of life care [21], and tobacco industry efforts to undermine public health [22]); identifying the perspectives of diverse stakeholders (e.g. regarding traumatic brain injury [23], primary health care services [24], and supported employment [25,26]); and health planning and evaluation (e.g. tobacco settlement planning [14], mental health [27] and mental illness [28], telemedicine in child protective services [29], fidelity of transfer [30], and development of guidelines for public health management of lower-prevalence chronic conditions such as epilepsy [31]).
As we move into the 21st century, better methodologies will be needed to address the complex configurations of issues in the health care system. These methodologies should be both systematic and flexible, to accommodate the complexity of the issues. Structured group concept mapping can be a practicable and important tool for participatory collaborative processes that have rigor and scientific credibility.
References
Association of State and Territorial Chronic Disease Directors. The role of state health departments in addressing end-of-life issues: www.ChronicDisease.org/NEW/chronic_disease_reports.htm Accessed October
Author notes
1Cornell University, Policy Analysis and Management, Ithaca, New York, USA, 2Concept Systems Inc., Ithaca, New York, USA
