


Abstract
Background. Improving the appropriateness of testing behavior and reducing the number of laboratory tests have been recognized as essential parts of quality improvement.
Objective. To assess the effectiveness of an administrative and a short-term educational intervention aimed at reducing clinical biochemistry laboratory utilization.
Design. An analysis comparing utilization of laboratory tests performed on in-patients before and after the intervention.
Setting. Computerized database of all laboratory tests performed in Hadassah Ein Kerem Medical Center, Jerusalem, Israel during 1999–2003.
Intervention. The administrative intervention included restricting available emergency laboratory tests and frequency of repeated orders. The educational measures included: discussion of the misuse of laboratory tests and its consequences with the hospital medical staff, and presentation of the new restrictive policy. A feedback of the intervention’s results was sent to the wards and reviewed with senior medical staff.
Main outcome measures. Change in utilization (measured as rates per 100 hospital days) of clinical biochemistry tests by hospital division and by selected laboratory tests.
Results. An overall reduction of 19% in laboratory tests (95% CI: 18.8–19.2%) was observed in the year after the intervention. Utilization decreased significantly in all the hospital’s medical divisions, within a range of 14.9–43.8%. During the intervention period, utilization of hematology tests was reduced by 7.6% (P = 0.009). Statistically significant reductions were noted in the ordering of all 12 selected clinical biochemistry tests. Although the orders of total cholesterol decreased by 72.2%, the utilization of ‘high-volume’ tests, such as glucose and electrolytes, showed only a modest decrease (7.9% and 6.9%, respectively).
Conclusions. The present study included all hospital medical staff and covered all the available clinical biochemistry tests. This rather simple and low-cost intervention resulted in significant reductions in clinical biochemistry test orders as well as in the ordering of hematological blood tests.
Introduction
Rising health care expenditure, the continuous growth in the volume of laboratory tests, and the observation of variations in laboratory testing practices have led to the critical assessment of routine laboratory utilization [1]. It has been recognized that a reduction in the number of requests for laboratory tests by improving the appropriateness of testing behavior is an essential part of quality improvement [1–3]. Various strategies to reduce laboratory test utilization have been applied including educational programs, development and implementation of guidelines, utilization audits, feedback to clinical staff, economic incentives, and administrative restrictions [3–7]. Although the general effectiveness of some of these interventions has been shown, a systematic review noted a variable degree of success for auditing, feedback, and education [8].
The Hadassah Ein Kerem Medical Center in Jerusalem, like many other medical institutions worldwide, has encountered a continuous growth in the volume of laboratory tests. The objective of this study was to reduce the hospital’s utilization of the clinical biochemistry laboratory. This paper describes a single, short-term intervention conducted by hospital management and assesses its effectiveness.
Methods
Hadassah Ein Kerem Medical Center is a 750-bed academic hospital that serves both as a tertiary referral center and as a regional primary and secondary hospital for the population of western Jerusalem.
The process of utility review of laboratory test requests was initiated in November 2001 by the hospital’s administration and the clinical biochemistry laboratory. In January 2002, letters were sent to the heads of all departments, with suggested guidelines for reducing utilization of laboratory tests. At a meeting of the institute’s medical directors in March 2002, it was decided to enforce a new protocol for the ordering of clinical biochemistry tests. This decision was approved by the institution’s Medical Board the following month. The procedure was drafted and revised after consultation with the heads of all departments and divisions. On 19 May 2002, the new procedure was implemented. The essential features of the procedure were:
A list of a limited number of emergency tests was distributed. These tests were made available 24 hours a day, with the highest priority to tests sent from the emergency department and the intensive care units (ICUs). The list of these emergency tests was critically reviewed and restricted.
The allowed frequency of several test orders was restricted. The restricted tests included serum lipid profiles, troponin-T, homocysteine, amino acid analysis, urinary organic acids analysis, lipase, magnesium, vitamin B12, folic acid, total iron binding capacity, ferritin, myoglobin, uric acid, hemoglobin A1C, and urinary microalbumin. Most of these tests were either restricted to patients of specific wards or required the approval of either the metabolic laboratory or a board-certified physician.
CPK-MB and troponin-I tests were abolished.
After the administrative actions, educational and informative measures were taken in order to increase compliance by all staff members. These included a presentation of the problem, i.e. the misuse of laboratory tests and its consequences, and the presentation of the new policy by the director general of the hospital in one of the institution’s prestigious weekly clinical conferences. The hospital’s medical director and the director of the clinical biochemistry laboratory presented the new policy at a meeting of the heads of all the departments. The problem of the misuse of laboratory tests was described to physicians and chief nurses at staff meetings by the hospital’s medical director and the director of the clinical biochemistry laboratory. This presentation addressed the problems of ‘automatic’ requests for redundant tests, including repeat orders, the costs of laboratory use, and the description of rising trends in test volume. Following this description, the new policy was presented. Subsequently, data were collected on the changing patterns of test orders. Four months after the implementation of the intervention, heads of all wards received feedback in the form of a letter presenting the results as reflected in the overall institutional reduction in requests for all clinical biochemistry tests, as well as data on their specific ward’s reduction in testing.
A similar intervention was conducted at Hadassah Mount Scopus Medical Center in Jerusalem.
In order to assess the effect of the intervention, computer data on clinical biochemistry laboratory test ordering was used to summarize the number of tests ordered for the entire hospital in 4-month intervals for a 4-year period, from 1 May 1999 to 30 April 2003.
We compared the utilization between May 2002 and April 2003 (after the intervention) with that of May 1999–April 2002 (before the intervention). In an analysis of all clinical biochemistry tests, data were stratified by medical department and by medical division. In a test-specific analysis, we assessed changes in requests for testing of 12 of the more frequent laboratory analytes that were performed throughout the study period. The analytes evaluated were: urea, albumin, electrolytes, bilirubin (total), glucose, amylase, uric acid, total protein, aspartate amino transferase (AST), alanine amino transferase (ALT), cholesterol and creatinine. Because the assay for troponin-T replaced the troponin-I assay shortly before the intervention, the percentage change in utilization compares only the year before with the year after intervention. The test-specific analysis depicts hospital utilization rates per 100 hospital days per 4-month period. To strengthen the inference from the ‘before’ and ‘after’ comparison of clinical biochemistry tests, we also monitored the change in the utilization of hematology tests, where no specific intervention was applied.
Statistical analysis
All data were entered into an SPSS database (version 11.0, SPSS, Chicago, IL, USA). Non-parametric Mann–Whitney tests were used for this comparison between the two periods. Adjustment for the variability between wards was accomplished with the Van-Elteren procedure [9]. Comparisons were also analyzed by t-test, showing almost identical results. Calculations of 95% CI for the difference in absolute numbers of all test ordering and rates of test ordering per 100 hospital days across all biochemistry tests and hospital wards were based on Poisson distribution. Because a change in the utilization of laboratory tests might be a result of a change in the characteristics of the patients admitted or the length of their hospital stay, we compared the computerized data on age, sex, and hospital stay of patients in the year before intervention with those for the year after. To estimate whether any change was associated with different outcomes, we compared in-hospital mortality and 30-day readmission rates in the year before the intervention with those for the year after the intervention. We used Pearson’s χ2 for categorical variables, and t‐tests for interval variables. The nominal level for statistical significance was set at 0.05. All statistical tests were two-sided.
Results
The number of patients admitted to the Hadassah Ein Kerem Medical Center increased by 3.5% in the year after the intervention as compared with the year before the intervention. Hospital in-patients were found to be similar in terms of age and gender distributions (Table 1). In-patients in the oncology division were the only exception, being older in the year after the intervention than those admitted in the year before the intervention (mean age: 55.7 ± 16.7, versus 54.0 ± 17.0, respectively; P < 0.001). There was no significant change in the mean hospitalization length of stay and the number of operative procedures performed in these 2 years.
Characteristics of hospital in-patients, mortality, and readmission rates in the year before and the year after the intervention
| Year before intervention | Year after intervention | |
|---|---|---|
| Admissions (n) | 34 392 | 35 593 |
| Males (%) | 50.8 | 50.8 |
| Mean length of stay (days) | 4.94 | 4.98 |
| Operations (n) | 16 774 | 17 914 |
| Mean age (SD) | ||
| Hospital division | ||
| Surgery | 46.6 (20.5) | 46.5 (20.6) |
| Internal medicine | 59.7 (19.6) | 59.8 (19.4) |
| Oncology* | 54.0 (17.0) | 55.7 (16.7) |
| Intensive care | 59.3 (19.2) | 60.1 (18.6) |
| Pediatrics | 4.4 (4.7) | 4.3 (4.4) |
| In-hospital mortality n (rate per 100 admissions) | 697 (2.03) | 702 (1.97) |
| 30-day readmission rate (per 100 admissions) | 19.7 | 19.4 |
P < 0.001.
Considering measures of patients’ outcomes, the 30-day readmission rates and in-hospital mortality rates did not differ significantly between these two study periods (Table 1).
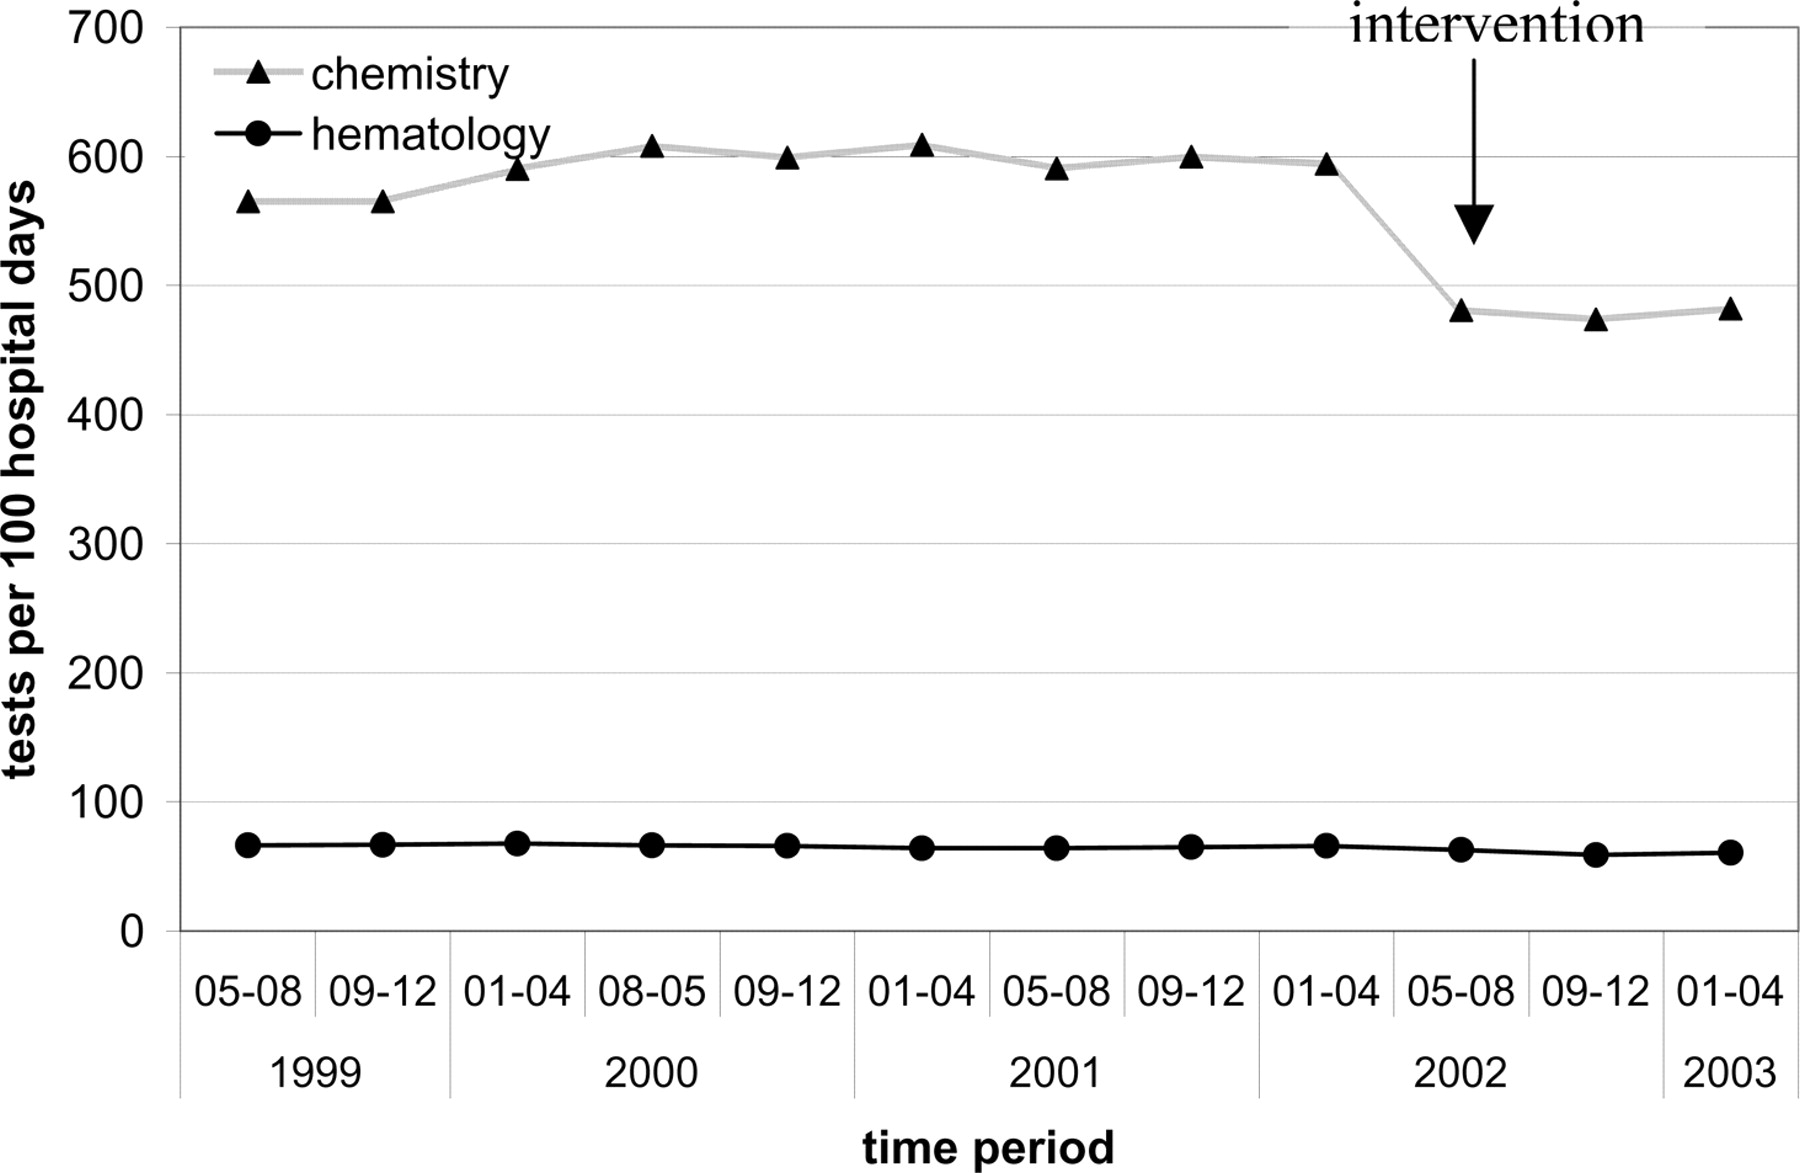
During the period between 1 May 1999 and 31 August 2000, a continuous rise in test utilization was evident. This was followed by a plateau that lasted until May 2002, when the intervention was implemented. Thereafter, a decrease in the utilization of clinical biochemistry tests was evident (Figure 1). The average number of clinical biochemistry tests per 4-month period decreased from 467 038 in the 3 years before the intervention to 386 948 in the year after the intervention (17.1% reduction, 95% CI: 16.8–17.5%). The average number of tests per 100 days of hospital stay decreased from 591 to 479 (19.0% reduction, 95% CI: 18.8–19.2%). Controlling for the variability between departments, reductions in both the absolute number of tests and the number of tests per 100 hospital days were highly significant (overall P < 0.0001).
Biochemistry and hematology tests utilization per 100 hospital days, May 1999–April 2003.
Statistically significant reductions were noted in the requests for tests per 100 hospital days in all hospital divisions, with the reductions ranging between 14.9% (division of pediatrics) and 43.8% (division of obstetrics and gynecology). In the ICUs, where the test volume is the highest of all wards, a reduction of 17.3% was noted in tests requested per 100 hospital days. During the intervention period, utilization of hematology tests was reduced by 7.6%, as compared with the period before the intervention (P = 0.009). Table 2 presents the percentage reduction in clinical biochemistry and hematology test utilization by hospital division.
Clinical biochemistry and hematology test orders per 100 hospital days before and after the intervention by major hospital division
| Hospital division | Biochemistry | Hematology | ||||||||
|---|---|---|---|---|---|---|---|---|---|---|
| ‘Before’a | ‘After’a | % Change | ‘Before’a | ‘After’a | % Change | |||||
| Total | 591.3 (467 038) | 479.1 (386 948) | −19.0* | 65.8 (51 947) | 60.8 (49 071) | −7.6** | ||||
| Intensive care units | 3553.1 (47 135) | 2940.0 (41 556) | −17.3** | 257.6 (3416) | 291.8 (4123) | 13.3 | ||||
| Internal medicine | 1004.4 (133,088) | 838.1 (110,686) | −16.6** | 104.5 (13 878) | 101.6 (13 416) | −2.8 | ||||
| Cardiology | 1197.2 (29 710) | 925.5 (22 530) | −22.7*** | 168.5 (4172) | 130.3 (3185) | −22.7** | ||||
| Obstetrics and gynecology | 191.1 (14 859) | 107.4 (8891) | −43.8** | 48.5 (3918) | 40.8 (3385) | −15.9** | ||||
| Pediatrics | 301.9 (40 476) | 257.1 (36 882) | −14.9**** | 21.7 (2910) | 18.4 (2641) | −15.2**** | ||||
| Hemato-oncology | 830.7 (59 403) | 701.6 (49 431) | −15.5*** | 81.7 (5843) | 74.9 (5279) | −8.3 | ||||
| Surgery | 452.1 (111 073) | 366.6 (91 045) | −18.9** | 59.2 (14 275) | 54.3 (13 481) | −8.3**** | ||||
Numbers in brackets represent mean volume per 4-month period.
P < 0.001.
P = 0.009.
P = 0.036.
P = 0.018.
Table 3 presents the utilization of 12 tests, selected among the most frequently requested tests. Statistically significant reductions were noted for all tests. Serum creatinine had the smallest reduction, with borderline significance (4.5% reduction, P = 0.036). The largest reduction was seen in the number of orders for cholesterol (72.2%). Tests with the highest utilization volume, such as glucose and electrolytes, showed only modest reductions (of 7.9% and 6.9%, respectively). Troponin-T requests were reduced from 3.83 tests per 100 hospital days in the year before the intervention to 3.53 in the year following the intervention (7.8% reduction, P = 0.043).
Test orders per 100 hospital days before and after the intervention and percentage reduction, by selected testsa
| Test | ‘Before’ | ‘After’ | % Change |
|---|---|---|---|
| Urea | 52.8 (41 702) | 48.7 (39 375) | −7.8* |
| Albumin | 26.5 (20 971) | 20.9 (16 920) | −21.1* |
| Electrolytes | 53.3 (42 129) | 49.6 (40 056) | −6.9* |
| Bilirubin, total | 28.7 (22 705) | 23.1 (18 689) | −19.5* |
| Glucose | 53.1 (41 912) | 48.9 (39 462) | −7.9* |
| Amylase | 8.3 (6536) | 5.2 (4171) | −37.3* |
| Uric acid | 17.1 (13 399) | 9.2 (7402) | −46.2* |
| Protein, total | 26.3 (20 780) | 20.7 (16 719) | −21.3* |
| AST | 26.8 (21 188) | 22.0 (17 745) | −17.9* |
| ALT | 25.3 (20 167) | 20.8 (16 806) | −17.8* |
| Cholesterol, total | 9.0 (7107) | 2.5 (2014) | −72.2* |
| Creatinine | 51.0 (40 300) | 49.0 (39 577) | −3.9** |
aNumbers in brackets represent mean volume per 4-month period.
P = 0.009.
P = 0.036.
According to our cost estimates of clinical biochemistry tests, the reduction in the volume of tests was associated with an approximate saving of $247 000 in the year after the intervention.
Discussion
We have demonstrated significant reductions in the requests for clinical biochemistry tests in our hospital after an intervention consisting of administrative intervention, education, and feedback. These reductions were not associated with a measurable change in clinical outcome, although our ability to estimate subtle changes was limited.
In our judgment, there were no obvious differences in the characteristics of the patients that might explain the decreased utilization following the intervention. We would expect that as patients become older, test orders would increase. Thus, the only significant change found in hospital demographics in the year after the intervention among patients in the oncology division who were older than the patients in the year before the intervention, cannot explain the decreased ordering of clinical biochemistry tests. Moreover, our analysis was stratified by hospital ward and division and thus controlled for the variation between hospital wards.
Reductions in the demand for hematology tests, where no intervention was applied, were smaller. These small changes can be explained by the Hawthorne effect [10], i.e. once doctors’ behavior in ordering practice changed with regard to clinical biochemistry tests, a change in all testing practices followed. Similarly, although most of the clinical biochemistry tests studied in our analysis were discussed in educational sessions and were the basis for the feedback data provided to the heads of the clinical wards, these tests were not directly specified in the list of restricted tests. Therefore, the reduction in their utilization is at least partially explained by the spill-out effect of intervention.
With the availability of new tests, it is important to abandon older tests that are not as useful or that provide redundant information. Our intervention referred to the common examples of lipase and amylase for the detection of pancreatitis [11]. Similarly, ceasing CPK-MB testing is justified in view of the fact that CPK-MB can be effectively replaced with either troponin-I or troponin-T [12].
We encountered variability in utilization reduction between wards and divisions. Dissimilarities in utilization performance before the intervention, as were demonstrated previously in our institution [2], might explain at least part of this variability in utilization reduction after the intervention. Hence, the small decrease in laboratory utilization of the division of pediatrics is associated with low utilization before the intervention.
The absence of a predetermined protocol for repeat orders was demonstrated previously in our institution in the underutilization of potassium tests when hypokalemia was encountered [13]. Our education intervention approached the issue of repeat orders; however, we could not estimate the specific effectiveness of our intervention in repeat orders.
Reductions in high-volume tests, such as glucose and electrolytes, were smaller than in low-volume tests such as total cholesterol and liver enzymes. We assume that high-volume tests are employed in the assessment and monitoring of the acutely ill patient, and are therefore less sensitive to intervention. Contrarily, Wang et al. [14], demonstrated high reductions following intervention in the utilization of blood electrolytes and glucose, which were among the highest volume tests.
The accomplishment of this intervention is owed to the commitment of the senior consultant staff of our institution. The discussions while assembling the list of restricted tests have probably increased both the involvement and the commitment of the senior physicians towards the process of improving laboratory utilization. This process of promoting a local consensus has been encouraged by others, although its effectiveness has not been directly estimated [1,15].
Although our intervention used both education and feedback, the major strategy of our intervention was administrative restriction. The success of administrative action is supported by a multiphase intervention trial of restriction and labor-intensive education to reduce preoperative screening for bleeding disorders [16]. Moreover, Solomon et al. [5] reviewed 49 studies that compared diagnostic testing practices in intervention and control groups and noted that administrative intervention can be incredibly effective with little expense.
While most of the interventions described in the literature were aimed at specific wards or physicians (such as hospital residents) and/or to a limited number of laboratory tests, our intervention population included all of our institute’s doctors and nurses and referred to a large number of tests. Our overall reduction of 19% in test utilization after a rather simple intervention is similar to what was achieved by Bareford and Hayling. [4] who studied the reduction in hematology tests after an intervention that included a monthly release of comparative clinicians’ workload statistics, the issuance of on-call guidelines, and the promulgation of information (by seminars and factsheets) on appropriate use of tests. Taking into account the modest resources needed for our intervention including communication between hospital management, the clinical biochemistry laboratory, and the directors of the hospital’s divisions and wards, we conclude that this simple and low-cost intervention has achieved its goals: it led to reductions in additional blood tests, and was associated with significant financial benefit.
We expect the effectiveness of all interventions to diminish over time; we are therefore carefully monitoring the utilization of laboratory tests in our hospital, in order to implement a re-intervention when needed. Moreover, a computer-based system that will prevent unnecessary test orders by following predetermined test request algorithms is now under development in our institution.
Appendix
Intervention steps
| Date | Activity | |
|---|---|---|
| November 2001 | Initiation of intervention by the hospital administration and the clinical biochemistry laboratory. Addressing the heads of internal medicine divisions, for consultation and cooperation. Review of the literature. Conception of the draft guidelines. | |
| January 2002 | Letters to the heads of all departments, describing the problem and asking for response to suggested guidelines. | |
| January–May 2002 | A procedure was drafted and revised after consultation with the heads of all departments and divisions. | |
| March 2002 | At a meeting of the institute’s medical directors, it was decided to enforce a new protocol for the ordering of clinical biochemistry tests. | |
| April 2002 | Approvement of the new procedure by the institution’s Medical Board. | |
| The hospital’s Medical Director and the Director of the Clinical Biochemistry Laboratory presented the new policy at a meeting of the heads of all the departments. | ||
| Letters to all doctors and head nurses detailing the new procedure | ||
| April–May 2002 | Meeting physicians and head nurses in their wards at staff meetings. The hospital’s medical director and the director of the clinical biochemistry laboratory described the problem of the misuse of laboratory tests and presented the new policy. The director general of the hospital presented the new policy in a clinical conference. | |
| May 19 2002 | Implementation of the new procedure. Reminder letters to all doctors and head nurses. | |
| September 2002 | Heads of all wards received feedback in the form of a letter presenting the results as reflected in the overall institutional reduction in requests for all clinical biochemistry tests, as well as data on their specific ward’s reduction in testing. |
Acknowledgements
The authors are indebted to Mr Yaacov Diskin and Mr Yaacov Hite who provided the data for this analysis.
References
Author notes
1Hadassah Medical Center, Braun School of Public Health, Jerusalem, Israel, and 2Hadassah University Hospital, Hebrew University School of Medicine, Jerusalem, Israel
