Article Text

Abstract
Introduction In the USA over 30% of medication errors occur at the point of administration. Among non-surgical patients in US hospitals exposed to opioids, 0.6% experience a severe opioid-related adverse event. In September 2018, Sierra View Medical Center identified two areas of opportunity for quality improvement: bedside bar code medication administration (BCMA) and pain reassessments. At baseline (April 2018 to September 2018) only 81% of medications were scanned prior to administration with pain reassessments completed only 41% of the time 1 hour postopioid administration.
Objective To improve BCMA scanning rates (goal ≥95%) and pain reassessments within 1 hour postopioid administration (goal ≥90%).
Methods Implementation methods included data transparency, weekly dashboards, education and plan-do-study-act (PDSA) cycles informed by feedback from key stakeholders.
Results Following a series of PDSA cycle implementations, barcode medication administration (BCMA) scanning rates improved by 14% (from 81% to 95%) and pain reassessments improved by 50% (from 41% to 91%), sustained 17 months postproject implementation (October 2018 to February 2019). The number of adverse drug events (ADEs) related to administration errors decreased by 17% (estimated annual cost savings of $120 750–239 725 per year) and opioid-related ADEs decreased by 2.6% (estimated annual cost savings of $72 855–80 928 per year).
Conclusion Adopting John Kotter’s model for change, developing performance dashboards and sustaining engagement among stakeholders on a weekly basis improved bar code medication scanning rates and pain reassessment compliance. The stakeholders created momentum for change in both practice and culture resulting in improved patient safety with a favourable financial impact.
- nurses
- pharmacists
- PDSA
- quality improvement
- medication safety
This is an open access article distributed in accordance with the Creative Commons Attribution Non Commercial (CC BY-NC 4.0) license, which permits others to distribute, remix, adapt, build upon this work non-commercially, and license their derivative works on different terms, provided the original work is properly cited, appropriate credit is given, any changes made indicated, and the use is non-commercial. See: http://creativecommons.org/licenses/by-nc/4.0/.
Statistics from Altmetric.com
Introduction
In 1999 the Institute of Medicine’s report, To Err Is Human, found that medications alone contribute to 7000 deaths annually with over 30% of errors occurring at the point of administration.1 2 In US hospitals, opioids were used in 51% of adult non-surgical admissions.3 Among the patients exposed to opioids, 0.6% experienced a severe opioid-related adverse event identified by nosocomial naloxone exposure or opioid-related adverse drug event (ORADE) diagnosis code.3 This study describes an organisation’s journey to implement a change in practice culture that will improve medication scanning rates and pain reassessments and serve as an example of implementing sustained change. This study was conducted at Sierra View Medical Center (SVMC), a 167-bed acute-care community hospital located in Central California. The hospital has a fully integrated electronic medical record (EMR) with computerised physician order entry (CPOE), bar code medication administration (BCMA) capability and uses automated dispensing cabinets (ADCs) throughout the hospital.
BCMA scanning
BCMA scanning helps address the ‘five rights’ of medication administration (right patient, right time, right route, right dose and right medication) and has been shown to reduce administration errors by 41.1% at an academic medical centre and by 80.7% in the emergency department (ED) with financial cost savings in harmful errors prevented clearly evident.4–6 A systematic review cited technology (eg, automated drug dispensing, CPOE, BCMA) and nursing education as effective tools to minimise medication administration errors.7 The Leapfrog Group, a national non-profit organisation that measures hospital performance, has recommended a 95% bedside medication administration scan rate in hospital units.8 To reach a high BCMA scanning rate hospitals face several challenges, including workflow changes, staff accountability, cultural obstacles and cost. Integrating compliance goals into nursing report cards, involving information technology (IT) department to build meaningful reports, addressing scanning barriers and expressing the total number of unscanned medications along with percentage of scanned medications have been tested strategies to improve scanning rates at hospitals.9–12
At this facility, BCMA scanning has been in place since 2014. BCMA scanning is required on all inpatient wards which include medical surgical unit (MedSurg), telemetry unit (Tele), intensive care unit (ICU), postanaesthesia care unit (PACU), observation unit, ED and labour, delivery and recovery (L&D) unit. In intraprocedural and emergency situations it is permissible to override scanning. All new hires receive didactic and practical training on BCMA as part of their initial competency. BCMA scanning reports in the form of percentage of doses scanned per user and a report of medications unscanned by users are available for download by nursing leadership. BCMA scanning compliance goal at this facility was set at ≥95%.
Pain reassessments
The Joint Commission developed new pain assessment and management standards designed to improve pain management practices in the areas of assessment, treatment, education and monitoring.13 Performing pain assessments and reassessments prior to and postpain medication administration is crucial in determining appropriate use of therapy, progress towards pain management goals and monitoring adverse effects to treatment. Pain reassessments postpain medication administration also allow clinicians to assess for advancing sedation and identify high-risk patients who may benefit from frequent monitoring to reduce risk of opioid-related respiratory depression and death. In one outpatient study, pain reassessment compliance within 30 min after pain medication administration was only 38% which leaves a strong possibility of adverse effects occurring unnoticed.14 Strikingly low pain reassessments (4.4%) after analgesic administration was noted in postoperative pain settings at two surgical settings in a major metropolitan hospital.15 A review of patients with cancer conducted in five hospitals found that pain intensity was only noted in 57% of outpatients and 53% of inpatients with reassessment after treatment reported in 34% of outpatient and 44% of inpatient charts.16 Pain reassessments among critically ill patients in two healthcare centres was noted at 66%.17 Though there are clear deficiencies, literature describing process improvement activities and pain reassessment practices in the hospital setting is minimal.
Per the pain protocol at this facility, pain should be assessed on pain medication administration and reassessed within 60 min of treatment. In the EMR system pain reassessments are unlocked at 30 min (eg, pain may not be reassessed earlier than the 30 min mark). Pain assessment documentation is required in the EMR system before pain medication may be administered. Goal compliance for pain reassessments within 1 hour postopioid administration was set at ≥90%.
Using reporting capabilities found in the EMR, the departments of pharmacy and nursing audited the baseline (April 2018 to September 2018) per cent compliance with BCMA (81%) and with pain reassessments performed within 1 hour after opioid administration (41%). For the BCMA project, an average of 30 000 doses of medication per month was administered at baseline compared with 35 000 doses per month during the intervention period. During both the baseline and intervention periods, 44 prescriptions, which equates to about 600 pain assessments, were audited per month. The presentation of these two gaps in care and a call to action was done with the intent of employing and leveraging the major tenets found within Kotter’s model for change.18 With these tenets invoked our stakeholder team began to build a shared community and a culture where medication safety became a service and a duty to our patients.
Methods
The National Health Service Sustainability Model was adopted and reviewed to determine the value and sustainability of the two process improvement projects.19 Time tested tools used to sustain change include: process control boards, performance boards, standard work and improvement huddles.20 The Institute for Healthcare Improvement advocates plan-do-study-act (PDSA) cycles to plan, test, observe results of an intervention and acting on what was learnt.21
Nursing staff involvement and hospital leadership engagement and support were identified as crucial elements for success. SVMC has 10 pharmacists and 360 nurses. Though pharmacy is a small group, there is a strong collaboration between nursing and pharmacy leadership. During bimonthly medication safety meetings, nursing and pharmacy leadership met to discuss medication safety and quality improvement initiatives. A stakeholder meeting consisting of nursing, pharmacy and IT departments’ leadership was held to determine (1) Metrics to track performance, (2) Gaps in the current system and workflow, (3) Limitation of current reporting tools, and (4) Nursing and pharmacist leadership accountability. BCMA scanning and pain reassessment data became a standing agenda item at the bimonthly medication safety meeting (a total of nine meetings occurred during the 17-month study period).
Study design
Interventions were developed based on feedback from nursing leaders. Based on the feedback, rapid PDSA cycles were developed. Interventions included data transparency through weekly dashboards, addressing documentation barriers, providing education and developing non-compliance user dashboards. An EMR analyst assisted in quantitative BCMA and pain reassessment data retrieval using Structured Query Language. The process improvement pharmacist validated the data through random chart audits for this quasi-experimental study. All eight inpatient wards (two MedSurg floors (33 beds), Tele (20 beds), observation unit (14 beds), ICU (10 beds), PACU (6 beds), L&D (21 beds)) and the ED (24 beds) were included in this study; no inpatient data were excluded. Six months of baseline and 17 months of postintervention data were collected. This report follows the SQUIRE V.2.0 (Standards for QUality Improvement Reporting Excellence) publication guideline.22
PDSA cycle 1 (October 2018)—weekly audit dashboards and addressing barriers
Prior to PDSA cycle 1, BCMA scanning and pain reassessment data were provided to nursing on a quarterly basis. Nursing leadership advocated for weekly performance dashboards as frequent reports allowed for immediate feedback to front-line nursing staff. The standard reporting capabilities found within the EMR proved to be difficult to analyse due to the volume of data. Nursing leaders requested more easily digestible reports (eg, charts, graphs) to help them visualise the issues, to easily identify staff with low compliance and to use the reports to go over fallouts with staff. The process improvement pharmacist and clinical pharmacy coordinator collaborated to develop weekly performance dashboards that provided analysis and actionable data to nursing leadership for review every Monday. The nursing team were routinely solicited and encouraged to provide feedback on reports and gaps in current processes.
A standard process (ie, standard work) was developed for nursing and pharmacy to report and fix medications that were not scanning. Additionally, IT unlocked reassessment of pain documentation at 5 min for intravenous opioid while keeping reassessment unlocked at 30 minutes for oral opioid medications.
Weekly dashboard reports for BCMA scanning and pain reassessments included (1) Line graph of overall hospital compliance, (2) A bar/line graph of compliance per floor, and (3) For pain reassessments a table with details of non-compliance (patient location, date/time of medication administered, time to pain reassessment, prescription number). Compliance per floor was transparent to all nursing leadership.
The chief nursing officer, human resources, nursing education and quality department were copied on weekly emails for transparency and to build a culture of safety and performance around medication management. Furthermore, BCMA scanning rate and pain reassessment performance became a standing agenda item at the monthly nursing cabinet meetings (a total of 17 meetings occurred during the study period).
PDSA cycle 2 (January/February 2019)—education and the spirit of competition
In January 2019, IT was able to generate data on nurse non-compliance for the pain reassessment audit. ADC usernames of nurses who were responsible for non-compliance were added to the pain reassessment non-compliance table. In addition, an educational email was sent to nursing staff to reinforce pain documentation on the medication administration record versus other locations (eg, notes).
In February 2019, a house-wide 4-month scanning competition was created. At the end of the competition, the top two reporters of medications not scanning (eg, nurses who reported scanning issues with medications to pharmacy) and nurses with an average medication scanning rate of ≥95% over a 3-month period were recognised in a celebratory party. Mid-competition results were sent to nursing staff. The number of unscanned administrations per week was also added to the weekly dashboard reports.
PDSA cycle 3 (July/August 2019)—user non-compliance dashboard developed
In April 2019, pharmacy sent a one-time summary of non-compliant user data for scanning and pain reassessments to nursing managers, however the data only displayed ADC username (user’s initials) versus the actual username (first and last name). It was difficult for nursing managers to decipher the non-compliant user from the ADC username. IT helped pull actual username and related data—pharmacy used these data to develop the non-compliance dashboard in July/August 2019. Consistent non-compliant scanners were highlighted each week starting November 2019.
In addition, for the scanning project, a percentage was displayed to show how non-compliant users contribute to the overall compliance statistical process control (SPC) (eg, non-compliant users this week attribute to X% of total unscanned doses). This was not done for pain reassessments, as there was no consistent non-compliant user—likely due to a smaller denominator with pain medication administration versus all medications.
Results
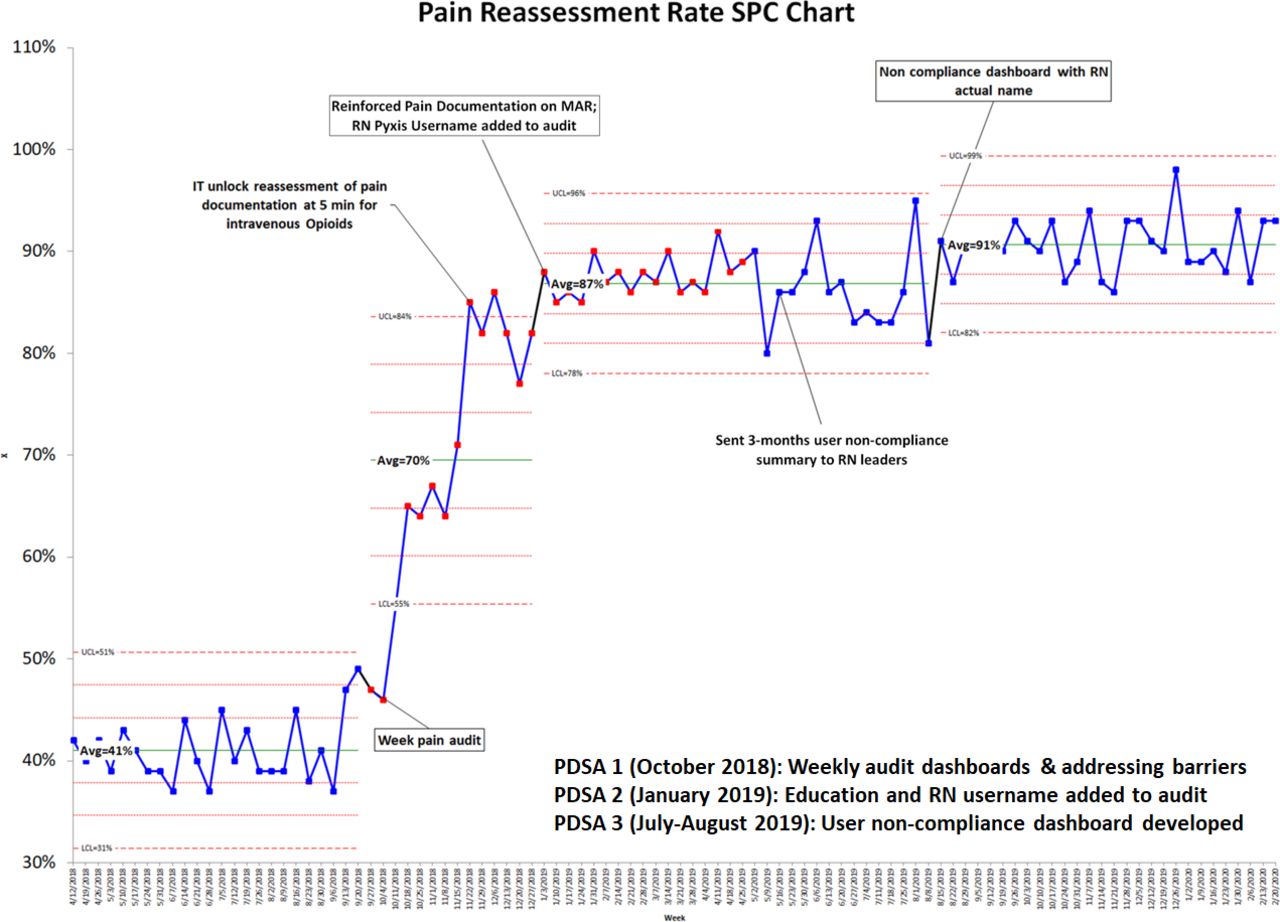
The weekly average scanning rate (figure 1) and pain reassessments within 1 hour of opioid administration (figure 2) are displayed in an SPC chart showing baseline to postimplementation PDSA cycles. To assess average compliance postintervention, a stability analysis was reperformed after each process change. The baseline period (April 2018 to September 2018) consisted of 24 points, each point representing a 1-week period. Three PDSA cycles consisted of 20, 22 and 32 observations for the scanning audit and 14, 32 and 28 observations for the pain reassessment audit. Student’s t-test was used for continuous variables with a 95% CI.
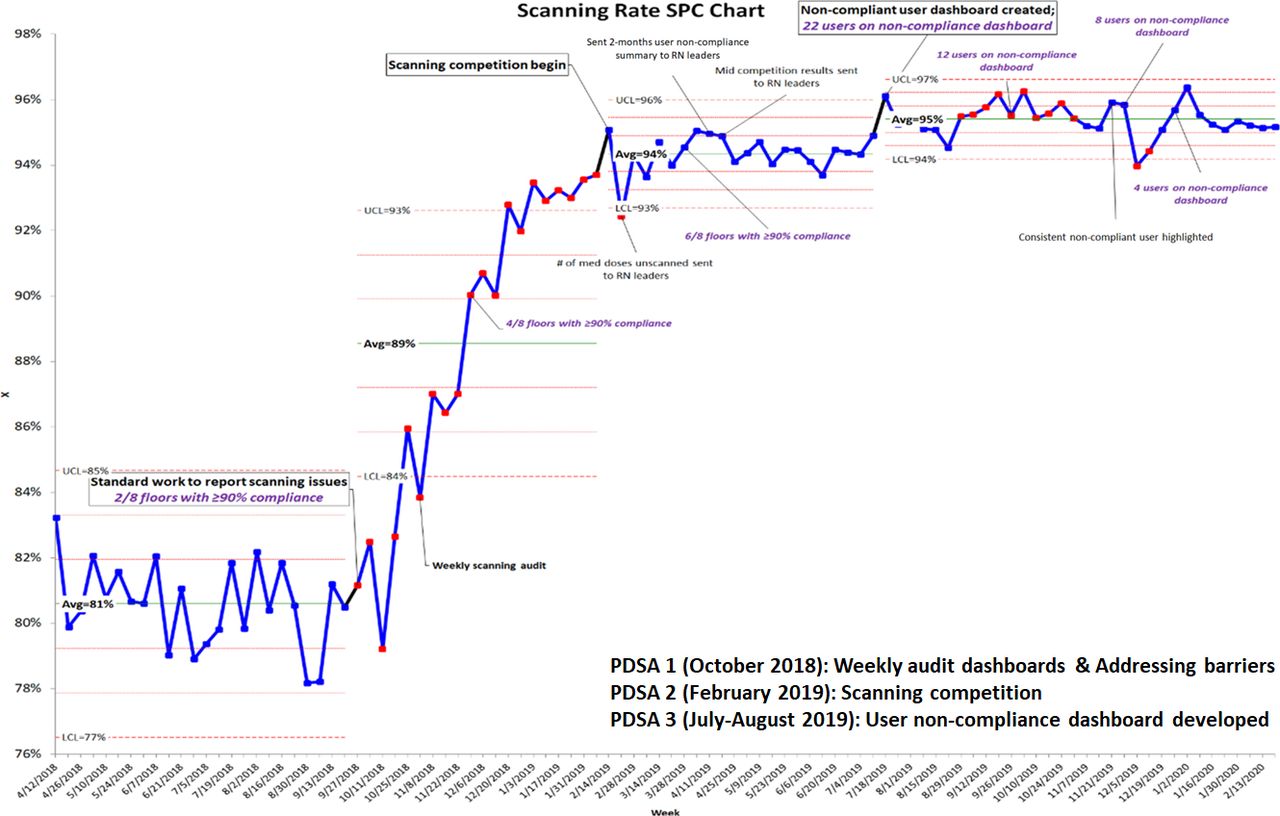
Scanning compliance postintervention. LCL, lower control limit; RN, registered nurse; PDSA, plan-do-study-act; SPC, statistical process control; UCL, upper control limit.

Pain reassessment post-intervention. LCL, lower control limit; MAR, medication administration record; RN, registered nurse; PDSA, plan-do-study-act; SPC, statistical process control; UCL, upper control limit.
The largest improvement was seen with developing weekly audit dashboards for both the scanning (8% improvement) and pain reassessment (29% improvement) projects. While PDSA cycle 2 helped improve both scanning and pain reassessment data by 5% and 17%, respectively, the non-compliance dashboard (PDSA cycle 3) assisted with goal attainment and sustainment for both projects 6 months post PDSA cycle 3. Of note, developing the user non-compliance dashboard rapidly decreased the number of non-compliant scanners by 45% in 10 weeks and by 81% in 23 weeks.
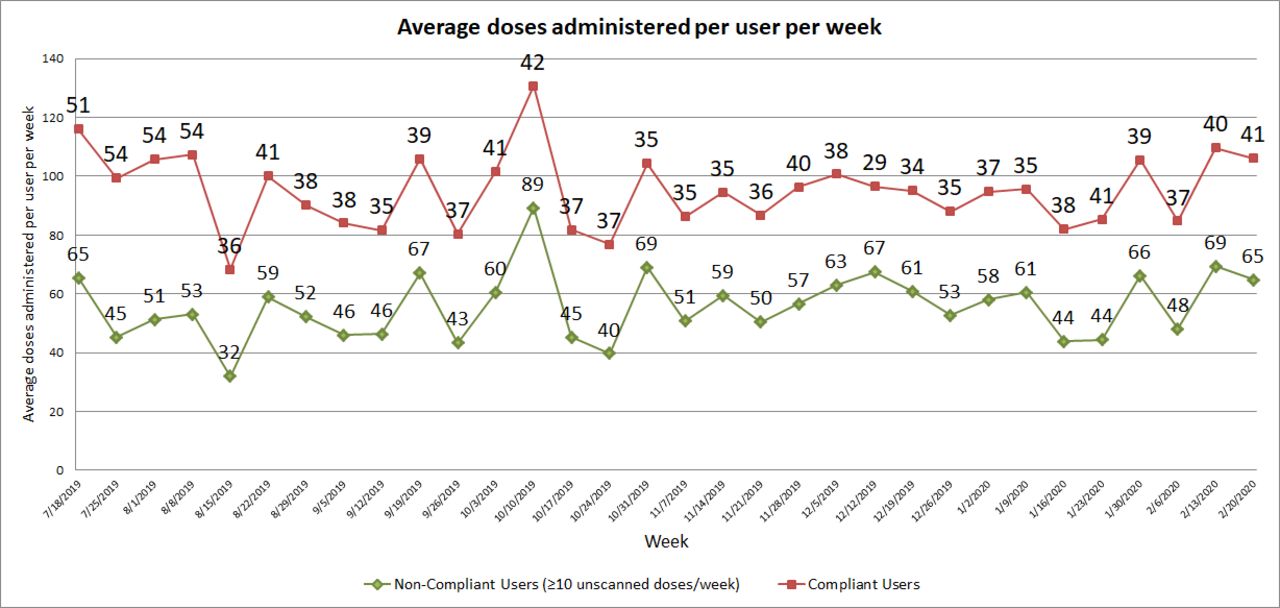
Although workload in the form of total doses administered increased from baseline (April 2018 to September 2018), compliance for both scanning and pain reassessments increased significantly (<0.001) postintervention (April 2019 to September 2019). On the scanning audit non-compliant users are defined as users with more than nine unscanned doses per week. This requirement was more stringent as it did not take into account the user’s workload (eg, number of medications scanned in a working day). This is confirmed as the average administration for non-compliant users per week was higher (56 doses administered/week) than for compliant users (38 doses administered/week) (p<0.001) (figure 3). No difference in pain reassessment compliance was observed when comparing compliance between as needed, times one or scheduled pain medication doses (p=0.98), this could be due to the fact that most scripts audited (90%) were as needed prescriptions.

Average doses administered per user per week.
Financial impact
The cost of each preventable adverse drug event (ADE) in the inpatient setting has been cited at community hospitals ($3511 in 2005 dollars) and in tertiary hospitals ($4685 in 1993 dollars).23 24 Using the Producer Price Indexes for general medical and surgical hospitals, preventable ADEs in 2019 dollars equate to $4830 and $9589, respectively.23–25 One year post-BCMA project implementation at this facility, the number of ADEs related to administration errors was reduced by 17%, resulting in an estimated cost savings of $120 750–$239 725 per year from ADEs prevented (2019 dollars).
ORADEs occur between 10.6% to 13.6% of the times among surgical patients.26–28 ORADEs include constipation, nausea/vomiting, respiratory depression, and so on. Among postsurgical patients, ORADEs have been shown to increase the length of stay by 55%.27 28 A study of 26 hospitals estimated $8095 (2019 dollars) increase in cost of care for patients with ORADE compared with patients with no ORADE.27 Similarly, a study of 21 acute-care hospitals found that ORADEs were associated with a 2.9% increase in absolute mortality, a 1.3% higher rate of 30-day readmission and a $8992 (2019 dollars) increase in cost of care.26 The number of ORADEs decreased by 2.6% 1 year post the pain reassessment project at this facility, which resulted in an estimated cost savings of $72 855–$80 928 per year (2019 dollars).25
Discussion
On discovering potentially dangerous gaps in care the medication safety interdisciplinary team successfully implemented Kotter’s process for creating a major change.18 The established sense of urgency was conveyed to leaders. A guiding coalition, the medication safety team, was charged to create a vision to direct change. This team communicated the urgency and the need for change to all nursing and pharmacy staff via 5 min huddles, education on policy and during weekly presentation of audit results. The nursing and pharmacy staff provided feedback on existing barriers. These obstacles were removed and analysed via multiple PDSA cycles. The nursing staff was also empowered to access these newly established lines of communication to provide insight on current progress and newly discovered barriers. Quality improvement principles were successfully adopted from the National Health Service Sustainability Model and the Institute for Healthcare Improvement.
After generating achievements in both areas, the medication safety team decided to access the competitive spirit of the nursing staff by establishing a scanning competition whereby those who achieved a 95% or better scanning rate or those who were top reporters of non-scanning medications were invited to a celebratory party. The transparency of this process provided motivation and opportunity for those who were not scanning at a high percentage rate to improve their individual performance. This process was successful in creating a medication delivery system with a high degree of reliability over time. The importance of scanning and pain reassessment has now become a staple in new hire orientation and annual competency. High performance in these areas is now an expectation among staff, peers and leaders in the organisation.
Improvement was sustained over 17 months postimplementation for both projects. Each PDSA cycle was a lesson learnt in perfecting the current BCMA scanning and pain reassessment processes. Successful interventions in both projects include (1) Developing weekly dashboards to display progress and (2) Developing a user non-compliant dashboard. Developing the user non-compliant dashboard for the scanning audit reduced the number of non-compliant users from 26 users to 4 users in less than 6 months. Adding information on the percentage of total unscanned doses attributed to the non-compliant users putting the data into perspective and likely motivated non-compliant users to make a change in practice. Nursing leaders were also able to drill down on the specific drugs unscanned for non-compliant users. Of note, the ED floor has not achieved ≥90% compliance in BCMA scanning 17 months post the project implementation. Although ED sees both non-admitted and admitted patients, we were unable to easily isolate data for non-admitted versus admitted patients at the time of the study.
At SVMC, BCMA scanning rates improved by 14% post-PDSA cycle implementation. Similar strategies and results (15% improvement) were observed by Early and colleagues at an academic medical centre postimplementation of BCMA process improvement activities.12 Similar strategies employed included developing a multiprofessional team, providing education and developing a process for pharmacy to review and address scanning issues. Early and colleagues also noted, like in this study, that strong executive leadership was crucial for success.12 The study, however, excluded the ED and surgical areas.12 Another study at a 175-bed community hospital refined their BCMA process and achieved optimal compliance from a scan rate of 95% to 98%, though it is unclear what units were included in the analysis.9 Similar strategies implemented by this community hospital included refining the BCMA report to better meet the needs of the nurse managers to support individual nurses’ accountability.9 The BCMA report was generated monthly and distributed to nurse managers versus our weekly compliance reports.9 It is interesting to note that the community hospital initially blinded the BCMA report to nurses due to fear that staff would feel singled out and blamed, however, this proved unfounded so the report was eventually unblinded.9 At SVMC we did not blind the data to nursing staff and did not receive any negative feedback in unblinded data. Both studies did not address long-term sustainability of BCMA scanning rates postintervention, as done in this study.
An observational study at two major teaching hospitals found that each interruption in nurse preparing and administering medications was associated with a 12.7% increase in clinical errors.29 In this study we noted that non-compliant scanners had a higher average administration rate (56 doses administered/week) compared with compliant users (38 doses administered/week). This increase in workload among non-compliant scanners may have led to more interruptions in workflow which resulted in a lower scan rate. Medication administration errors are influenced by multiple system factors, however, causation of these factors leading to errors still remains to be determined. Observational studies in high scanning areas (eg, medical surgical or intensive care wards) would provide insight and possible solutions to existing workflow issues with scanning.
At SVMC, pain reassessments improved by 50% 1 hour postopioid administration.30 Gordon and colleagues also employed the PDSA framework to improve pain reassessments at their tertiary medical centre.30 Similar strategies employed by this study includes forming an interdisciplinary team, addressing documentation barriers, clarifying policies, providing education and completing regular audits to provide feedback to nursing.30 Like in our study, Gordon and colleagues realised that monthly audits were insufficient in providing timely feedback and evaluating effectiveness of pain reassessment interventions.30 At SVMC, we provided a weekly compliance dashboard and analysis to nursing leaders and saw a gradual improvement from 41% to 87% 13 weeks postintervention. Gordon and colleagues implemented clinical rounds by nursing leaders to review bedside flow sheets and interact with nursing staff every 2 hours for 2 weeks; in addition 100% daily audits of patient records were performed and reviewed with directors and clinical nurse managers.30 After 2 years, the facility achieved a cumulative compliance rate of 94.9%, though it is not clear whether the review of daily audits occurred throughout the 2-year period.30 Like in this study, nursing leadership involvement and engagement was crucial in the success of pain reassessment compliance.
Initial challenges in both process improvement projects included: (1) Developing easy to view and use dashboards, (2) Obtaining data on nursing actual versus ADC usernames, and (3) Obtaining human resources data to determine the associated floor of non-compliant nurses so non-compliant cases are easily identifiable to nursing leaders. Engagement from nursing leaders was crucial in moving these projects forward. The feedback and questions posed by nursing leaders helped evolve the dashboard and types of data presented.
Limitations to generalisability of this work include manpower availability to develop dashboards and send out weekly updates to nursing leadership. To achieve results, quality improvement requires an investment in time and effort. Of note, both projects led to an annual cost savings of $193 605–$320 653 from ADEs prevented. It took 6 months of weekly scanning audits and 7 months of weekly pain reassessment audits to reach goal scanning compliance. Coordinating and engaging team members from nursing, pharmacy and IT leadership is a prerequisite for success. Though feedback was provided by nursing leadership during weekly audits and medication safety meetings, a survey to query feedback from nursing staff regarding awareness of the process improvement projects and thoughts on workflow improvement would also be enlightening. Institutions may also consider developing nursing report cards to provide more transparency in data and allow staff to see their own compliance scores compared with peers.
Conclusion
Employing Kotter’s model of change, developing performance dashboards and standard work to report issues, and implementing weekly improvement huddles via email improved BCMA scanning rates and pain reassessment by 14% and 50%, respectively. Improvement was sustained 17 months postproject implementation. The concepts and methodology used in this project may be applied to other medication management performance improvement projects. Future projects may include a survey of staff, generating nursing report cards, and moving audits from weekly to monthly audit emails.
Acknowledgments
The authors thank Mark Walberg, Pharm.D, PhD, CTH for his review and advice on statistical analyses for this project.
References
Footnotes
Contributors All authors have seen and approved the manuscript, and contributed significantly to the work. The authors have no conflict of interest, real or perceived, to disclose.
Funding The authors have not declared a specific grant for this research from any funding agency in the public, commercial or not-for-profit sectors.
Competing interests None declared.
Patient and public involvement Patients and/or the public were not involved in the design, or conduct, or reporting, or dissemination plans of this research.
Patient consent for publication Not required.
Ethics approval This process improvement project was exempt from Institutional Review Board approval.
Provenance and peer review Not commissioned; externally peer reviewed.
Data availability statement All data relevant to the study are included in the article.