Article Text

Abstract
Background Today, healthcare is more complex than just ensuring clients receive quality care; it also involves consistently delivering excellent client experience. A non-profit community support services agency conducted an extensive diagnostic journey to determine root causes of inconsistent care delivery between regular and relief frontline staff.
Local problem Clients and family caregivers noted lower satisfaction in care delivery when a relief staff (ie, internal staff or an external agency that is covering a shift) provided service in comparison with their regular staff. The diagnostic journey discovered that the shift exchange process—when outgoing staff transfers critical knowledge to incoming staff for continuing care—varied significantly between the 11 service locations, leading to a lack of consistent service delivery, thereby impacting client experience.
Methods A working group consisting of Supervisors of Client Services, Personal Support Workers (PSW) and management were tasked with process mapping the current state, highlighting gaps and outlining the ideal state of the shift exchange process.
Interventions Using best practices from the aviation industry, a checklist was developed that encapsulated all the critical steps needed to be undertaken for a successful, consistent shift exchange. The theory was that the utilisation of the checklist would enable consistency and improve client satisfaction with care delivery, especially when care is delivered by a staff unfamiliar with clients.
Results Prior to the checklist implementation, 74% of clients were satisfied or very satisfied with their relief staff, and post checklist implementation client satisfaction improved to 90%. Staff self-assessments also indicated that PSWs agreed that the checklist helped provide consistent care.
Conclusion The use of checklists can transform the way care is delivered in the community support sector and other service delivery agencies alike to bring greater standardisation of care between providers, thus significantly improving client experience across the healthcare sector.
- checklists
- hand-off
- human factors
- PDSA
- quality improvement
This is an open access article distributed in accordance with the Creative Commons Attribution Non Commercial (CC BY-NC 4.0) license, which permits others to distribute, remix, adapt, build upon this work non-commercially, and license their derivative works on different terms, provided the original work is properly cited, appropriate credit is given, any changes made indicated, and the use is non-commercial. See: http://creativecommons.org/licenses/by-nc/4.0/.
Statistics from Altmetric.com
Problem description
Peel Senior Link (PSL) has been incorporated since 1993 as a non-profit, charitable agency that enables seniors to remain independent in their own homes as long as possible. Seniors living in designated neighbourhoods are aided with the Supports for Daily Living Programme, a collaborative award-winning programme delivered by eight non-profit agencies in the Greater Toronto Area in collaboration with the Mississauga-Halton Local Integrated Health Network. The programme assists seniors with essential activities of daily living, including personal care, safety checks, light meal preparation and light homemaking. PSL also delivers a specialty Medication Management Programme whereby clients with multiple comorbidities and drug regimens are assisted with medications on a daily basis. PSL serves up to 340 seniors clients across 11 service locations in a hub and spoke model—hub representing the social housing building where seniors are located and spoke representing the community within a two to three kilometre radius of the hub.
PSL formed a team to review annual client satisfaction surveys over the last 3 years. Quantitative results indicate high levels of client satisfaction (86.7%, 88.9% and 87.6% in 2015, 2016 and 2017, respectively); however, qualitative results highlighted areas of concern that were grouped into themes and shared with PSL’s Family Caregiver & Client Advisory Panel (FCCAP), a group consisting of clients, family caregivers, board member representation and management staff. The FCCAP provided feedback and context setting to validate the findings. Discussions focused on lack of adequate staffing on holidays, needing more time with clients and increased training and consistency with services. The panel recommended that the organisation focus on relief staff and consistency of services as its top priority.
Recommendations from the panel were further supported by a consultation report developed from PSL’s annual community engagement event held in June 2017. The event engaged approximately 150 clients, caregivers, members of the community, partner organisations, Local Health Integration Network representatives and local politicians. Clients and caregivers noted that they wanted ‘personalised service’ and to see ‘less moving of regular staff’.1
Available knowledge
A number of diagnostic tools were used to better understand the complexity of the problem. The root cause analysis tool helped identify the causes of inconsistent services, ranging from staff availability to client expectations.2 The tool was used as an exercise by a range of staff with varying responsibilities from executive management to Personal Support Workers (PSWs) to truly understand the depth and extent of the root causes from all perspectives. It was also an opportunity to prioritise efforts and focus on specific aspects of the potential solution.
The 5-Whys exercise used with the root cause analysis tool directed the structure of the Driver Diagram as highlighted in figure 1.

Driver diagram.
The combination of diagnostic tools guided the team towards focusing on staff education and training. Other areas highlighted in the Driver Diagram (eg, scheduling, sick days and recruitment) were already being addressed or have improvement action plans in place within the organisation. The team further explored staff education and training to identify gaps that impact service delivery on staff changes. Shift exchange processes is a critical area that has potential to mitigate the differences in client knowledge and service delivery between regular and relief staff. Shift exchange process occurs between outgoing and incoming staff. It is a critical time period of approximately 15 min where the outgoing staff prepares documents and transfers knowledge to the incoming staff to continue client care delivery. Shift exchange occurs three times a day for each team across 11 site locations. Each site consists of 3–4 teams, resulting in approximately 99–132 shift exchanges on any given day. In theory, if a shift exchange is conducted consistently, then client care should be consistent irrespective of the staff delivering the service. However, it was identified through observing exchanges at different sites that there were variations in how the exchange was conducted. Although the variations were slight and did not significantly affect staff exchanges within each site location, the impact on relief staff exchanges was notable across site locations.
Health and safety implications with improper shift exchange include lack of information exchanged on critical medications or meal preparation method (eg, cutting the food into small pieces) that have potential impacts on client condition. Shift exchange is vital for new staff that are unfamiliar with clients and for regular staff as well given the evolving nature of care plans and client medical status. Furthermore, if service details on client preferences are not exchanged, it leads to inconsistent care delivery and lower satisfaction scores. Based on the analysis of the problem, the team decided to review the current shift exchange process and look at innovative ways to ensure appropriate and consistent hand-offs for the continuum of care and improve the overall client experience.
Specific aims
Based on various channels of direct feedback from the target population who receive our services, the purpose of the project was to embark on a quality improvement journey to focus on consistency of services and improve overall client experience. The team’s system aim was to have 90% of clients report that they are satisfied or very satisfied with the care and consistency of service they receive by 31 March 2019, regardless of the type of staff delivering the service (ie, regular vs relief).
Over the last decade, healthcare has evolved from simply delivering quality care to including client (or patient) experience as a basic tenet of all interactions. Client or patient experience has been defined as ‘how patients perceive and experience their care. This involves the ability to hear what is being said, measure the experience and develop the capacity to use the information to change practice, policies and rules’.3 One of the primary drivers to enabling an overall positive client experience is consistency of care. Clients have the tendency to become accustomed to certain aspects of service delivery, especially if they receive the same service delivered by the same care provider regularly. Care providers have the ability to build strong rapport and customise their care delivery methods to fit the unique needs of each client. As a result, when a regular care provider (‘regular’) is replaced by another provider (‘relief’) for a short duration, service delivery has the potential to differ, thereby challenging the consistency of care clients receive and ultimately client experience.
Service delivery agencies, ranging from community support services to acute care hospitals, face similar struggles in delivering consistent service. Clients may be highly satisfied with care delivered from one care provider but report lower satisfaction if another provider from the same organisation provides the same service.
In this article, we describe the quality initiative undertaken by PSL to ensure that the care providers uphold one of the organization’s major values: to ensure consistency of client care. Consistency is achieved when clients experience high-quality care regardless of the type of staff providing the care, that is, regular versus relief. Relief staff refers to internal staff covering unfilled shifts as well as external contracted agency staff if a shift cannot be filled internally. We describe the adoption of an aviation-style checklist and its successes and challenges with implementation across the 11 service delivery locations.
Rationale
PSL’s goal was to seek best practices from other industries that have successfully mastered shift exchanges or hand-offs in high reliability settings. The airline industry provided a stunning example of such a best practice. Boeing’s Model 299 aeroplane crash in the mid-1930s during a demonstration flight forever changed the landscape of the aviation industry. Subsequent investigation uncovered pilot error leading to the crash and resulting in the birth of the checklist.4
The purpose of the aviation checklist aligns with goals intended to address the gap identified, which included: (A) providing a sequential framework to follow, thereby reducing the chance of missing a critical step, (B) serving as a memory guide, (C) reducing variability and (D) improving coordination during high stress situations.5
The team leveraged aviation best practices into the community support sector and embarked on a series of consultations to design a checklist that would improve consistency of care. This was instrumental to the agency as checklists are a common practice in acute care settings; there is potential to further spread the use in community settings. Checklists allowed the agency to act resourcefully by using a simple and common tool within the community setting to bring about tangible advancements in client experience.
Measures
Outcome and process measures are listed in table 1. Indicators selected measure client experience through client satisfaction and clients’ perspective on staff performance. By capturing client reports on staff greeting them appropriately, we are able to infer whether the checklist and important reminders are executed to measure client experience from the initial point of contact.
List of indicator measures
The data collection was focused on clients who received services from a relief staff each week to determine the impact of the quality initiative preimplementation and postimplementation. After each weekend, the team reviewed the client schedule and administered the surveys to those individuals who were served by relief staff. We ensured there were sufficient time gaps between data collection to avoid survey fatigue and burnout.
Analysis
In addition to focusing on any implications of increasing trends discovered in the data collection, the team focused on evaluating the differences, or gaps, between the results. Measuring consistency does not necessarily equate to increased client satisfaction in every situation. Therefore, we focused on the difference in satisfaction scores between regular and relief staff (ie, to see that relief staff are as highly scored as regular staff).
It is important to note that the number of relief staff used varied each week impacting the amount of data collected. This would impact the number of clients surveyed every week. statistical process control charts were used to observe whether the changes demonstrated an improvement. It is a simple, visual method that displays if trends are present over a set period of time.6
Methods
Context
The team comprised of the Director of Human Resources, Information Management Officer and Supervisor of Client Services. Support was provided by a Quality Improvement Advisor from Health Quality Ontario. PSWs and Supervisors of Client Services formed a working group and were tasked with codesigning the checklist. Staff involvement was centred around using the five elements of the Psychology of Change Model: unleash intrinsic motivation, codesign people-driven change, coproduce in authentic relationship, distribute power and adapt in action.7 Frontline staff were also involved in training their peers on the appropriate utilisation of the checklist. Patients or the public were not involved in the design, or conduct, or reporting, or dissemination of plans of our research. This manuscript has been developed using the Standards for QUality Improvement Reporting Excellence (SQUIRE) 2.0 guidelines.8
Interventions
The use of the checklist was developed following a process mapping exercise that outlined gaps between the current state and ideal state of shift exchange. Checklists come in various format serving different purposes, including procedural, preparation, problem solving and prevention checklists.4 The procedural (or ‘read-do’) checklist was used for this project to ensure frontline staff were first reading the task, then carrying out the task, and finally checking it off on the checklist. The checklist developed consists of three sections: (1) arriving at a site, (2) information exchange and (3) preparing to leave for a client’s home. The checklist includes details for critical client information exchange and social considerations for relief staff, including internal staff covering a shift, new staff or an external agency, entering a new site. Best practices in developing a checklist were taken into account, including focusing on critical steps, ensuring clarity (ie, avoiding unnecessary colours or jargon), following a predictable order and incorporating feedback from its users.9 The checklist was printed on a placemat-sized cardstock paper and was laminated. A checklist would be assigned to each team at all sites. Laminating allowed staff to use washable markers to physically check off the steps then reuse for future shift exchanges.
The reverse of the checklist—named Document Center—shows the inclusion of a colour-coded table corresponding to colour-coded binders directing staff to locations of important documentation and highlighting its purpose. These binders and their colours were consistent at each of the 11 service locations.
The checklist was supported by other changes to ensure seamless transition into the care provisioning system. This includes the addition of detailed client preferences in client schedules by highlighting particular information related to service delivery to ensure consistent and high-quality care regardless of whether a regular or relief staff provides the service. For example, a new column was added to the daily shift duties (a schedule that lists client information and tasks to be completed for each shift) titled Important Notes. This encouraged staff to add specific details and notes on unique client preferences. Information would range from minute details such as how a client prefers their coffee to safety considerations such as accessing the client’s unit and significant health concerns such as risk of falls or diabetes. Name tags were also implemented as identifiers with agency logo for internal and external relief staff to help clients feel safe and comfortable as new staff enter their home. Forms were also improved and binders colour coded to ensure schedules are more user friendly.
Study of interventions
The checklist and supporting changes were implemented in a phased approach to create a strong foundation and enable sustainability. Multiple Plan–Do–Study–Act (PDSA) cycles were completed based on feedback received from PSWs and the working group. Four sites were selected to introduce and test the checklist before spread. Staff were trained on the checklist (one site at a time) to solicit feedback, analyse change recommendations and implement accordingly. Staff and supervisors provided feedback during training but also had a week to provide change recommendations while using and becoming familiar with the checklist before changes were refined. Each site received the same checklist version and training; changes were implemented once all selected sites received training. Recommendations ranged from name changes to colour suggestions and method of use.
A pre-implementation client survey was distributed to a pilot site to measure baseline data and compare with post-implementation to determine the effectiveness of the checklist. The purpose of the survey was to capture client satisfaction between regular and relief staff as well as if staff were following the standardisation of the shift exchange process via checklist. One site was selected to monitor any impacts pre-change and post-change implementation due to high volume of relief staff use at that particular location. Other site locations were not included due to having low to no use of relief staff at the time.
Staff also completed a self-assessment following the training and use of the checklist for at least 1 week to measure their competency and confidence. Staff provided their evaluation of the change after becoming familiar with the checklist and using it multiple times. Staff were able to provide feedback on how the checklist was impactful for themselves to deliver service and their perspective on how it will impact incoming staff when they transfer critical knowledge of their clients.
Verbal informed consent was given by every client that was surveyed. Clients experiencing advanced dementia, cognitive limitations or uncomfort being surveyed were not contacted for data collection. Clients were also asked for consent to receive weekly phone calls when they received service from relief staff.
Results
Prior to initiating change ideas, baseline data were collected from 21 clients over 6 weeks consecutively from the pilot site starting March 2017 to April 2017. Follow-up data were collected in July 2017 and August 2017 to test the sustainability of the checklist implementation. In the span of 8 weeks, a total of 33 relief staff provided service 107 times. Each time service was provided through a relief staff, the client receiving the care was contacted. The responses received each week from clients were averaged representing the data point for that week.
Client responses indicated that minimal changes were observed in respect to regular staff. At baseline, 94% of clients reporting that they were ‘satisfied’ or ‘very satisfied’, and postchange, the percentage increased to 98%. Results were linear with low variation.
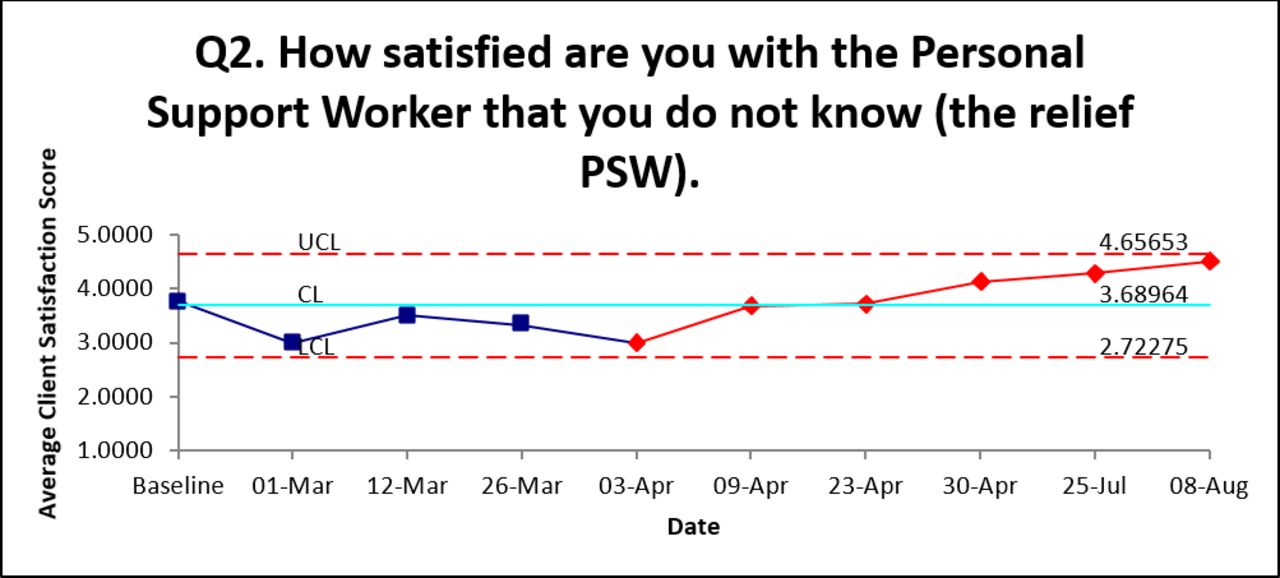
Clients reported an increasing satisfaction with relief staff, from baseline of 74% to post-implementation of 90% of clients reporting that they were ‘satisfied’ or ‘very satisfied’. The red points in figure 2 indicate a positive trend.
Client satisfaction survey: relief staff.-PSW
A 10% increase was noted in relief staff appropriately introducing themselves as majority of clients reported sometimes prior to the implementation and post implementation there were higher reports that staff always introducing themselves. After the change implementation, clients reported that 97.5% of the time relief staff were always introducing themselves.
The staff self-assessment captured 69 frontline staff’s perspective on the change. Eighty-two (82%) per cent of staff ‘agree’ or ‘strongly agree’ that the change would help incoming staff provide more consistent care, and 80% of staff ‘agree’ or ‘strongly agree’ that the change would help themselves provide more consistent care.
An incidental finding of note was the reduction in medication errors following the implementation of the checklist. Although this was a measure that the team had not intended to collect, over an 8-week collection period, medication errors decreased from 2.59 per 10 000 resident days prior to checklist implementation to 1.09 per 10 000 resident days following the checklist implementation. We believe this decrease is attributable to the specific checklist items that pertain to medications in both the ‘information exchange’ and ‘preparing to leave for client’s home’ sections.
Discussion
Summary
Overall, PSL achieved the system aim of having 90% of clients satisfied or very satisfied with the care and consistency of service received regardless of the type of staff delivering the service. Minimal changes were noted, as expected, when measuring client satisfaction with regular staff. At baseline, clients reported higher satisfaction and comfort with regular staff as compared with relief staff. The purpose of the implementation of the checklist and supporting change interventions was to bridge the gap in client satisfaction between regular and relief staff. Satisfaction scores improved by 16% for relief staff following the implementation of the checklist and majority of the staff supported the checklist implementation and its role in providing consistent care. The supporting changes to the checklist were also vital in the successful implementation because it opened avenues of communication between staff and provided important reminders. The client survey also provided evidence that relief staff were taking steps to communicate and introduce themselves to clients more consistently as compared to baseline.
Interpretation
Incidental findings of the impact the checklist has on medication errors will be further explored and analysed between regular and relief staff to evaluate the impact on client health and safety precautions. Although medication errors were not intended to be measured in conjunction with this quality improvement project, it has become a major focus for the PSL’s Pharmacy Task Force to conduct root cause analysis and factors associated with shift exchange.
A number of human factors interfered in its use prior to spread to all locations. Staff resistance acted as a barrier initially because staff perceived the checklist as an additional step to their already overwhelming workload. Stress and fatigue also played a significant role in providing community support services.10 PSL’s frontline worker visits (multiple times per day) and provides care for up to 15 different clients a day with varying levels of need. Seniors are often living with multiple health conditions and limitations, which places additional physical and mental stress on the PSW. Other human factors noted during and post-implementation include distraction, time constraints and delays. For example, a total of 15 min are allocated at the beginning of the shift for all incoming staff and at the end of the shift for all outgoing staff to complete a shift exchange. A late arrival by an incoming staff may reduce the time available for a successful shift exchange, thereby reducing the efficacy of the checklist. These factors may have contributed to the lower satisfaction scores among relief staff. These barriers were addressed through early staff engagement and involvement in the development and implementation. Also, staff were provided with training and education on the purpose and value of the checklist. Awareness and transparent communication played an essential role in mitigating barriers.
These interferences are not uncommon in checklist usage. Its profound effects have been noted previously in the aviation industry. In particular, the crash of Northwest Airlines Flight in 1987, where the flight crew omitted a crucial checklist, brought the problem to the forefront. The flight crew were distracted and the co-pilot simply forgot to initiate the checklist.11 Other human factors were also noted in that incident, including organisational cultural discord and schedule pressures.11
One approach to reducing human factors is to automate the checklist with appropriate user input. The aviation industry has adopted this method by alerting the pilots of any critical items that may not have been completed.
Limitations
A major limitation was data collection due to resource capacity and limited existing data. Baseline data could only be collected at one point in time rather than collecting through a period of time. Client survey fatigue also contributed to only 6 weeks of data collection consecutively and a further 2 weeks of additional data to measure sustainability. Furthermore, the team experienced staff resistance to change initially, specifically in the sites prior to spread. It was vital for the team to provide context and communicate value while training and implement staff feedback to enhance staff buy-in. The team was fortunate to have PSWs from the working group be part of the training to demonstrate the use of the checklist.
Conclusions
Checklists have the ability to transform care delivery regardless of the sector in which it is used. This simple tool can be a powerful mechanism to bring standardisation, improve the quality of care and enhance client experience in the community sector and other care delivery sectors alike. PSL intends to leverage technology (ie, handheld devices) to automate the checklist with user confirmation. For example, the team is currently assessing ‘check-in’ and ‘check-out’ capabilities whereby a PSW is unable to initiate client care before confirming the checklist has been completed. Digital checklists will add a layer of accountability on frontline staff and monitor the use of the checklist. Policies are currently in place to outline appropriate protocols to follow while conducting shift exchanges and the importance of following the checklist. Further training modules and the addition of the checklist in employee orientations will also be implemented for widespread organisational adoption and sustainability of the checklist. Quality improvement will continue to be monitored through client experience surveys as well as continuous engagement with clients, families and caregivers.
Acknowledgments
We would like to acknowledge our CEO, Raymond Applebaum and the Improving & Driving Excellence Across Sectors (IDEAS) quality improvement training programme that enabled us to embark on this project. We also want to thank Alice Stratchan, Quality Improvement Advisor for Health Quality Ontario and IDEAS, for providing ongoing mentorship and support throughout the project.
Footnotes
Contributors JH conducted the diagnostic journey, data collection, implemented the change and edited and reviewed the manuscript. AMM led the team, conducted diagnostic journey, data collection and analysis, implemented the change and cowrote the manuscript. SR is the executive sponsor for this work and cowrote the manuscript. MW conducted the diagnostic journey, data collection, implemented the change and edited and reviewed the manuscript. AMM and SR are responsible for the overall content as guarantors.
Funding The authors have not declared a specific grant for this research from any funding agency in the public, commercial or not-for-profit sectors.
Competing interests None declared.
Patient and public involvement Patients and/or the public were not involved in the design, or conduct, or reporting, or dissemination plans of this research.
Patient consent for publication Not required.
Provenance and peer review Not commissioned; externally peer reviewed.
Data availability statement Data are available upon request.