Article Text

Abstract
The UCLA Immunogenetics Center is an Immunogenetics and Histocompatibility laboratory that performs testing for multiple transplant programmes within and outside of UCLA. The single antigen bead (SAB) test is a high complexity luminex bead test used to assess pretransplant and post-transplant patients for the presence of pathogenic human leucocyte antigen donor-specific antibody associated with allograft rejection. Efficient reporting of the SAB test has been difficult as data analysis and reports are generated in the laboratory information system (LIS) and uploaded to the electronic medical record (EMR) as PDFs. To solve this, we recently developed a state of the art reporting workflow allowing discrete reporting of SAB data (antibody specificity, mean fluorescent intensity and interpretative comments) from the LIS HistoTrac to UCLA Health System’s EMR EPIC:CareConnect. However, a proportion of tests did not report to the EMR appropriately. Baseline system performance data evaluated over a 10-week period showed that ~4.5/100 tests resulted in EPIC as ‘preliminary result’ or ‘in process’ instead of ‘final result’ with only common cause variation. Quality improvement methods were employed to improve the process with the SMART Aim of reporting 100% of tests as ‘final result’. Pareto analysis identified two errors accounting for 79% of common system-level failures—status errors and interface errors. We hypothesised that addressing the status error would reduce or eliminate the interface errors. We used the Model For Improvement to test a reprogramming intervention. Status and interface errors were completely resolved through the process improvement. Continuous monitoring revealed a system-level shift with only ~1.9/100 tests resulting inappropriately. Through the audit process, the remaining common system-level failures were identified and resolved. Therefore, 100% of tests result to EPIC as ‘final result’. The study demonstrates that high complexity SAB bead data can be efficiently reported EPIC:CareConnect from HistoTrac as discrete data.
- laboratory medicine
- transplantation
- electronic health records
This is an open access article distributed in accordance with the Creative Commons Attribution Non Commercial (CC BY-NC 4.0) license, which permits others to distribute, remix, adapt, build upon this work non-commercially, and license their derivative works on different terms, provided the original work is properly cited, appropriate credit is given, any changes made indicated, and the use is non-commercial. See: http://creativecommons.org/licenses/by-nc/4.0/.
Statistics from Altmetric.com
Problem
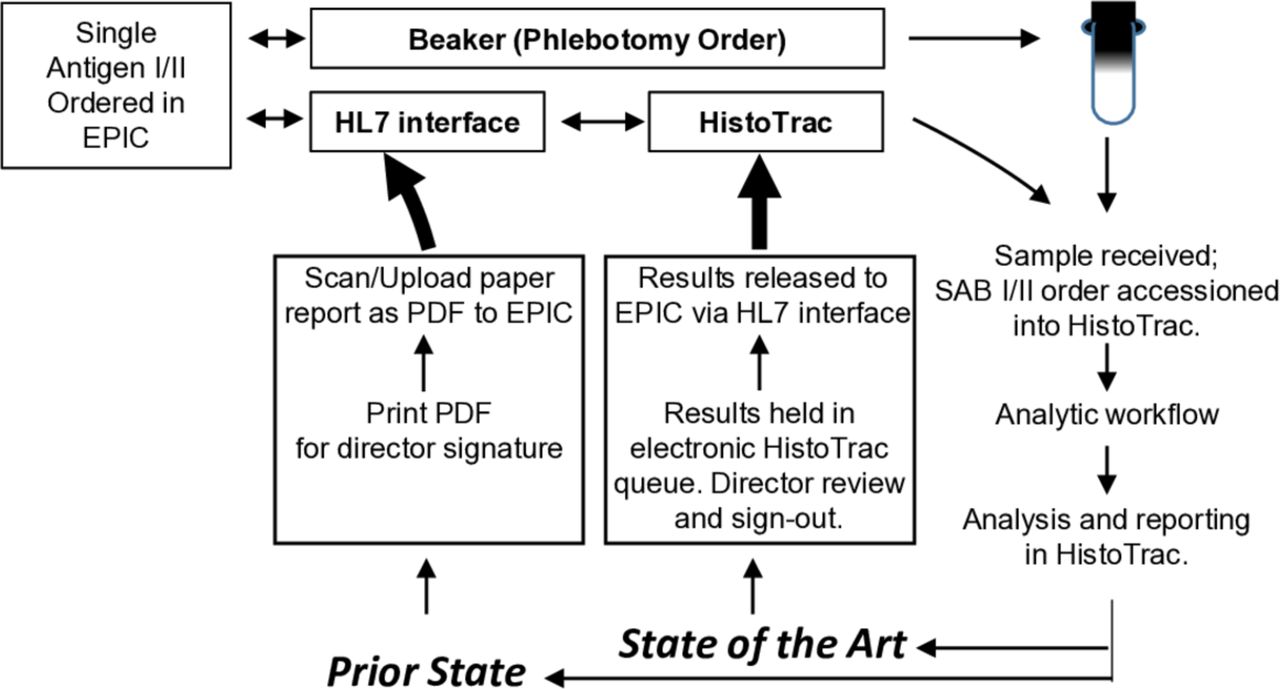
The UCLA Immunogenetics Center (UIC) performs the high complexity single antigen bead (SAB) test to identify antibodies found in the blood of transplant patients that target the human leucocyte antigen (HLA).1–3 Currently, the widely used electronic medical record EPIC does not support a module to facilitate test ordering and reporting between EPIC and Immunogenetics laboratories. Many laboratories employ the laboratory information system HistoTrac for patient data storage, analysis and reporting, yet communication between laboratories and the EMR remains a challenge in the field. At UCLA, Immunogenetics and Histocompatibility reports were initially uploaded to EPIC as PDFs (portable document formats). Due to multiple problems with this reporting workflow, we undertook a significant information technology development project to result SAB test results (antibody specificity, mean fluorescent intensity (MFI) strengths and interpretative comments) as discrete data components to the EMR. To devise the system, components in EPIC were engineered and mapped to data tables in HistoTrac to allow reporting via a health level-7 (HL-7) interface (figure 1).

A state of the art reporting method for SAB data analysed in the LIS HistoTrac, and reported to the EPIC EMR. An order for an SAB I/II Combo test is placed in EPIC, and splits into a two-part panel order composed of one order in Beaker for phlebotomy, and a second order to HistoTrac via HL-7 interface to HistoTrac. The phlebotomy sample is received at the immunogenetics laboratory, and accessioned into HistoTrac. The analytic and postanalytic workflows are followed. In prior state, the PDF report is printed from HistoTrac and scanned to EPIC via the HL-7 interface. In the state of the art, electronic results are held in a electronic HistoTrac queue to allow time for director review and sign-out. Components in EPIC are mapped to HistoTrac data tables allowing for discrete data reporting to EPIC via HL-7 interface. EMR, electronic medical record; HL-7, health level-7; SAB, single antigen bead.
During the preanalytical and analytical workflows, the test shows in EPIC as ‘in process’. After data analysis and sign out, the data are released from HistoTrac to EPIC, and the test finalises—indicated by ‘final result’.
Accurate and timely reporting of SAB data is essential to allow for reliable clinical decision making for both pretransplant and post-transplant patients.4–6 In reviewing test results in the EMR, we observed that some SAB tests were not reporting as expected. Most commonly, the test did not show in EPIC as ‘final result’, and instead were noted as ‘preliminary result’ or ‘in process’. In some cases, for combination SAB I/II tests, only the results of class I or II resulted instead of both.
Our SMART Aim was to report 100% of SAB tests as ‘final result’.
Background
The UIC is an Immunogenetics and Histocompatibility laboratory that performs testing for multiple transplant programmes within and outside of UCLA. For UCLA transplant programs alone, approximately 400 renal, 150 liver, 100 lung, 60 heart and 100 stem cell transplants are performed each year.7 To provide testing and services for pretransplant and post-transplant patients, the UIC laboratory is staffed 24 hours a day, 7 days a week with 4 clinical laboratory directors, a laboratory manager, 4 supervisors, a compliance officer, 35 technologists, 10 researchers and 6 administrative personnel.
Immunogenetics laboratory tests (routine or STAT) are ordered in EPIC:CareConnect by the provider as part of a two-part panel order that includes a second order for phlebotomy (figure 1). On receipt of the samples, the laboratory test order is accessioned into HistoTrac via HL7 interface, and the preanalytic, analytic and postanalytic workflows are followed. SAB assay data are acquired using Fusion (V.4.1). The raw data undergo quality assessment and are uploaded into HistoTrac (V.2.52) for data storage, analysis and reporting. The average MFI of multiple beads representing one HLA antigen is reported to the EMR via iCAP middleware and the HL7 interface (figure 1).
Since the limitations to this reporting workflow were numerous a multidisciplinary team that included a laboratory director and technologist, HistoTrac programmers, and an EPIC/Beaker analyst was assembled to design and validate a new reporting workflow that would allow discrete reporting of SAB data to the EMR (figure 1).
The PDF report was used as a model in the development of the report of discrete data (online supplementary figure 1A,B). Antibody specificities for pretransplant or post-transplant patients are ‘bucketed’ in categories of strong, moderate or weak at the top of the report, followed by interpretative comments, and then antibody MFI’s. A notable difference between the presentation of results in the PDF and discrete data reports is due to the electronic ordering and reporting workflow. The SAB I/II test is ordered in EPIC as one test, but accessioned into HistoTrac as separate SAB I and SAB II tests. The results are then reported to EPIC with two messages—one for SAB I and another for SAB II—filing back to the one test request. Since the discrete results of SAB I are sent from HistoTrac to EPIC, followed by the results for SAB II, providers scroll down to see the results of the SAB II on the discrete data report (online supplementary figure 1B, notice SAB II results not illustrated).
Supplemental material
Design and validation of the system was conceived at the UIC and greater than 200 components were developed in the EPIC environment and mapped to the data tables in HistoTrac to allow reporting of antibody specificities and strengths (MFI) as well as interpretative comments (online supplementary figure 1B). The newly designed discrete reporting workflow is state of the art, as UCLA is the only laboratory reporting SAB test data to EPIC from HistoTrac with the antibody MFI’s.
Approximately ~850 SAB tests per month are ordered by UCLA transplant programmes. The vast majority of these (~95%) are ordered as an SAB I/II combo, and less frequently SAB class I or II alone, or modifications of the test—SAB class I-C1q or II-C1q or SAB I or II with sera dilution. Resulting of SAB data efficiently to the EMR is essential for patients in both the pretransplant and post-transplant settings. For pretransplant patients, providers review SAB data to determine the patient’s breadth and strength of sensitisation to HLA antigens. The data are used to block unacceptable antigens in the United Network for Organ Sharing national organ allocation system, and determine the likelihood that a patient will be offered an organ.4 6 In addition, the data are used at the time of donor offer for virtual cross-match and risk assessment.2 6 8 Post-transplant, SAB data are used to track the strength and specificities of donor-specific antibodies that are pathogenic to the allograft, and is correlated to biopsy results allowing for diagnosis of antibody-mediated rejection.5 Incomplete reporting of SAB data to the EMR can significantly affect decision making at the time of donor offer, or during post-transplant clinical assessment.
Measurement
To identify the number of tests that did not result as ‘final result’, an audit system was established employing reports from EPIC and HistoTrac. We measured the number of SAB tests per 100 tests that resulted to EPIC as ‘preliminary result’ or ‘in process’. The population was all SAB tests ordered by UCLA providers in EPIC and accessioned into HistoTrac. Data sources included EPIC, HistoTrac and Excel spreadsheets used to compare the number of tests showing in EPIC as ‘preliminary result’ or ‘in process’ with the number of tests released from HistoTrac to EPIC. We collected data daily, and reported data weekly. The data were subdivided by the underlying reason that the test did not result as ‘final result’.
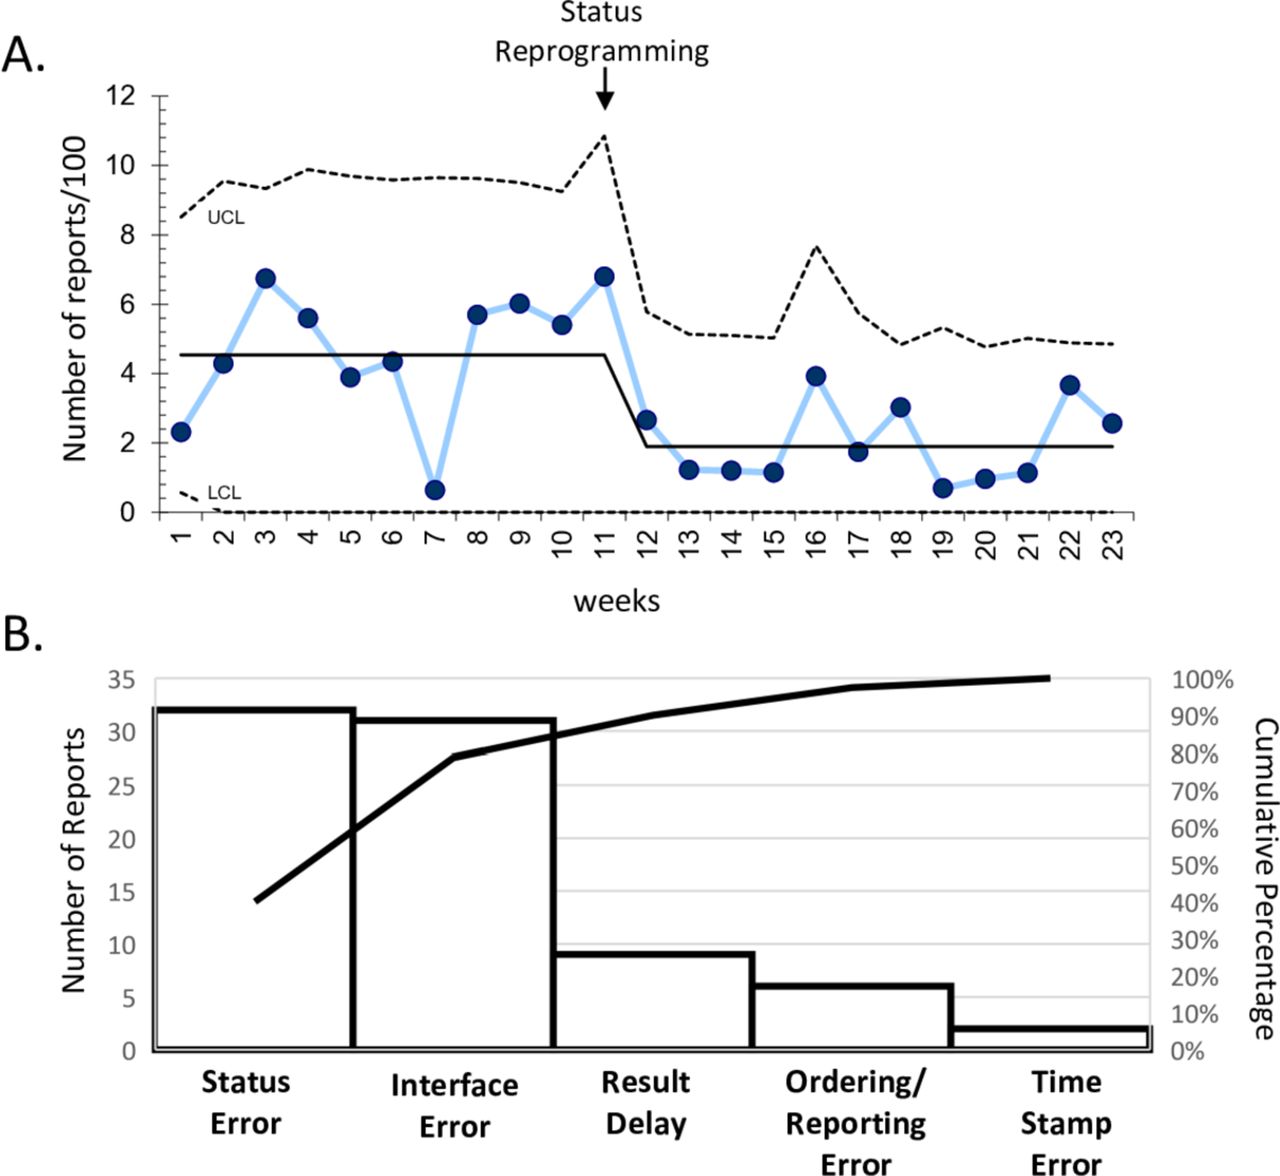
Baseline system performance data evaluated over a 10-week period (weeks 1–10) showed that ~4.5/100 tests were not resulting as ‘final result’ (figure 2A).

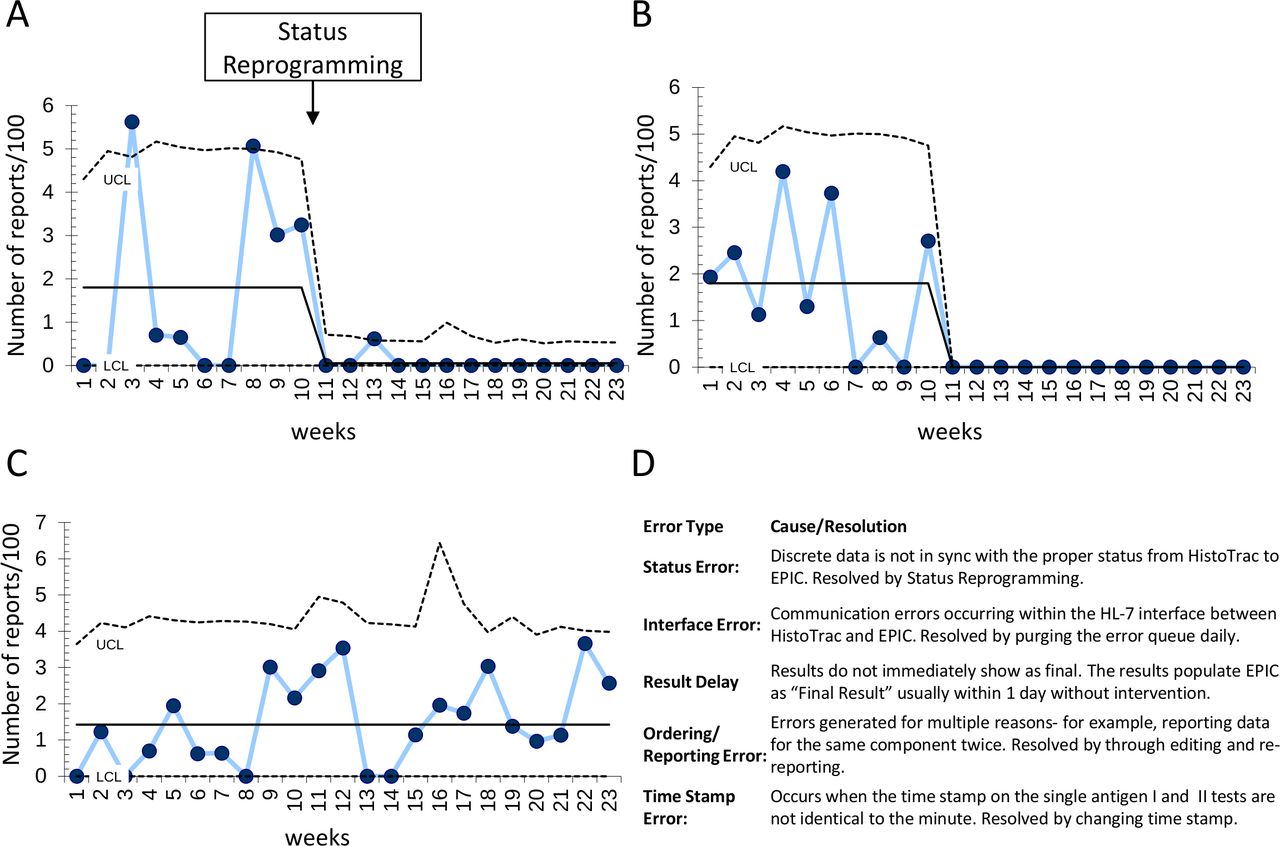
Control and Pareto charts. (A) Control chart (u-chart) indicating the number of tests reporting to EPIC as ‘preliminary result’ or ‘in process’. Initial control limits were generated using baseline system performance data gathered through weeks 1–10. Approximately 4.5/100 reports did not result to EPIC as ‘final result’. An intervention was designed to test the hypothesis that reprogramming of the status message sent with the data report from HistoTrac to EPIC would significantly reduce the number of tests that did not result as ‘final result’. A system shift was identified after the intervention was put in place (week 11) with eight consecutive points below the initial mean resulting in a new stable system with 1.9/100 reports not reporting as ‘final result’. (B) Pareto chart identifying system-level failures during the period of baseline system performance evaluation (weeks 1–10). The status error and interface error accounted for 79% of failures for reports to show as ‘final result’ in EPIC. Bar graph, number of reports. Line graph, cumulative percentage.
Design
To improve the process, the Model For Improvement was used. A Pareto Analysis was performed to identify common system level failures. Two failures accounted for ~79% of improper reporting—status error and interface error (figure 2B). The status error occurs when discrete data leaving HistoTrac via the HL-7 interface to the EMR is not sent with the proper status message—‘final result’. Interface errors are communication errors occurring within the HL-7 interface between HistoTrac and EPIC when a test is not resulted because a test ahead of it in the send out queue ‘errored out’. A result delay occurs when test results were released from HistoTrac to EPIC, and do not immediately show as final, but show as ‘final result’ usually within 1 day without intervention. Ordering/reporting errors can occur for a variety of reasons such as misaccessioning a test request from EPIC into HistoTrac as the wrong test, or reporting data to EPIC with errors that do not allow matching of HistoTrac results with EPIC result components. Time stamp errors occur when the time stamp of the single antigen I and single antigen II test are not identical to the minute.
We established a SMART Aim of reporting 100% of single antigen tests to EPIC with ‘final result’ status. We hypothesised that correcting the status error with programming would eliminate that error, and eliminate, or at least significantly reduce, the number of interface errors. The remaining errors were resolved with staff training.
Strategy
To address the status error, an intervention was designed and tested using the Plan Do Study Act cycle. The SAB I/II test is ordered in EPIC as one test, but accessioned into HistoTrac as separate SAB I and SAB II tests. The test is then reported to EPIC with two messages—one for SAB I and another for SAB II—that file back to one test request. The initial programming language was designed to allow the EPIC status to change from ‘in process’ to ‘preliminary result’ when the first of these test messages was received, and then to ‘final result’ on receipt of the second message. We hypothesised that rewriting the programming language so that the status would only change from ‘in process’ to ‘final result’ after both test messages for SAB I and II were received would significantly reduce the number of status errors.
Results
The project measured the number of SAB tests per 100 tests that resulted to EPIC as ‘in process’ or ‘preliminary result’. A time series analysis was performed using statistical process control methods. To address the status error, we proposed a change in the programming that would affect when the test changes from ‘in process’ to ‘final result’. The programming language was changed, and a system shift was identified at week 11 with 8 consecutive points below the initial mean resulting in a new stable system with 1.9/100 reports not reporting as ‘final result’ (figure 2A). We evaluated the effect of the reprogramming on the subgroups of error types (figure 3A,B). The data show a significant system shift at week 11 from 1.8/100 reports to 0.1/100 and 0/100 tests not resulting as ‘final result’ for the status error and interface errors, respectively.
Control charts and error types. Control chart (u-charts) showing quantitation of the individual error types during the baseline data window (weeks 1–10) and postintervention for the (A) status error, (B) interface error, (C) all other errors. Postintervention, a significant system shift is noted, and the number of tests not showing as final result due to the status error (A) or interface error (B) was significantly and sustainably reduced from 1.8/100 to 0.1/100 and 0/100, respectively. (C) The number of tests not reporting as final result due to any other error (result delay, ordering/reporting error or time stamp error), are not significantly changed by the intervention, but are identified by weekly audit, and addressed to allow accurate reporting of results. Through the quality improvement process, 100% of tests are resulted as ‘final result’. (D) Error types identified in Pareto analysis, and resolutions. HL-7, health level-7.
After the programming change, 1.9/100 test reports continue to show in EPIC with the incorrect status (figure 2A). Tests not reporting as final result due to result delay, ordering/reporting error or time stamp error are not significantly changed by the intervention (figure 3C), but are identified by weekly audit, and addressed to allow accurate reporting of results. Ordering/reporting errors are addressed and resolved through communication with ordering providers, and reporting laboratory technologists (figure 3D). Time stamp errors are resolved by altering the timestamp of the SAB class I and II data messages from HistoTrac to the identical time. Result delay errors are ‘self-resolving’. Through these interventions, our SMART Aim of resulting 100% of tests to EPIC as ‘final result’ is reached (figures 2 and 3).
Lessons and limitations
Our goal was to improve the reporting workflow for SAB tests from the laboratory information system HistoTrac to the electronic medical record EPIC:CareConnect. Our SMART Aim was to report 100% of tests to EPIC as ‘final result’. To achieve this goal, classic process improvement methods were employed to identify common system-level failures. The two most common system-level failures were status error and interface error. We hypothesised that an intervention that addressed the status error would eliminate, or at least significantly reduce the interface error. A programming intervention was designed and tested to address status error. After implementation, a sustained system shift was observed (figure 2A). Evaluation of the tests that did not result appropriately according to root cause showed a significant impact was made on the number of tests that result as ‘preliminary result’ or ‘in process’ due to status error and interface error (1.8/100 tests to almost none) after the status reprogramming (figure 3A,B). While a system shift was not observed for the other subgroups of tests—ordering/reporting error, result delay and time stamp error- each of these errors is identified through an audit system, investigated and resolved (figure 3C) such that 100% of tests result to EPIC as ‘final result’ therefore achieving the SMART Aim.
This new electronic reporting system and process improvement are critically important to the field of Immunogenetics and Histocompatibility laboratory operations. Our approach offers the specific advantage of reporting discrete data from the SAB test, including all antibody MFI’s, and eliminating the need to upload PDF’s to the EMR. While other histocompatibility laboratories have designed methods to electronically report from HistoTrac to the EMR,9 10 we are the only laboratory reporting SAB test results with antibody specificity strengths to EPIC:CareConnect from HistoTrac as discrete data. The data are used by transplant programmes in both the pretransplant and post-transplant settings for donor selection, risk assessment and correlation to biopsy results. Accurate and timely reporting of SAB data to the EMR is essential to allow high-quality patient care. Discrete patient data are also accessible for downstream quality improvement and clinical research projects. We hope that the description of this project and process improvement will serve as a model for other Immunogenetics and Histocompatibility laboratories who are similarly challenged with difficulties in reporting patient data to the EMR.
One limitation of our study is our inability to directly test the relationships between the status error and interface errors. We hypothesised that test results that were not reporting as ‘final result’ due to the interface error were at least partially due to status errors occurring with tests that were released from HistoTrac to EPIC ahead of them. Since the sole programming intervention was to address the status error, and a significant response was observed in the number of interface errors, we conclude empirically that the two errors are interdependent.
Our laboratory has adopted a culture of continuous process improvement. The SAB test reporting workflow was significantly improved through this process improvement project as evidenced by a sustained system shift. In reviewing the outcomes, we continue to be challenged primarily with reporting errors and time stamp errors. Efforts to address these errors are part of our strategic plan for quality improvement throughout the laboratory. Furthermore, this project provides a first step towards the development of more sophisticated reporting platforms within EPIC to allow longitudinal tracking of antibody MFI’s and potentially integrate additional clinical endpoints such as creatinine and biopsy results for renal transplant patients. In current state, longitudinal monitoring of antibody strength in EPIC is possible, but cannot be restricted only to show the strength of DSA.
Conclusion
Classic quality improvement methods allowed us to identify common system-level failures that contributed to SAB tests not reporting to EPIC as ‘final result’. Addressing the status error through reprogramming of the status message resulted in significant improvement in the reporting workflow, and a sustained system shift from 4.5 to 1.9/100 tests incorrectly reporting. The remaining tests that do not initially report as ‘final result’ are identified and resolved. Through the process improvement project, the SMART Aim of reporting 100% of SAB tests as ‘final result’ from HistoTrac to EPIC:CareConnect was achieved.
Footnotes
Contributors All coauthors made substantial contributions to the manuscript. MJH conceived and designed the quality improvement study, performed data analysis and drafted the manuscript. ST and BW contributed the programming intervention that lead to a sustainable system shift. SK and LIG gathered baseline and postintervention data. SK, LIG, BW, ST and EFR aided in data analysis and interpretation. All authors contributed to reviewing and revising the initial and revised submissions of the manuscript, and provided a final approval of the manuscript’s content, and are accountable for all aspects of the accuracy and integrity of the work.
Funding The authors have not declared a specific grant for this research from any funding agency in the public, commercial or not-for-profit sectors.
Competing interests ST and BW are employees of SystemLink. SystemLink is a vendor that receives payment to perform database and interface development services for UCLA.
Patient consent for publication Not required.
Provenance and peer review Not commissioned; externally peer reviewed.
Data availability statement All data relevant to the study are included in the article or uploaded as supplementary information.