Article Text

Abstract
Over 90% of patients with head trauma seen in emergency departments (EDs) are diagnosed with minor head injuries. Over-utilisation of CT scans results in unnecessary exposure to radiation and increases healthcare utilisation. Using recommendations from the Choosing Wisely Canada (CWC) campaign and quality improvement (QI) methodology, we aimed to reduce the CT scan rate for head injuries by 10% over a 6-month period.
Baseline CT scan rates were determined through a 27-month retrospective cohort review. We used stakeholder engagement and provider surveys to develop our driver diagram and Plan-Do-Study-Act (PDSA) cycles, which included (1) improving provider knowledge about the CWC campaign recommendations; (2) testing, refining and implementing a modified Canadian CT Head Rule checklist; (3) developing CWC-themed head injury–specific patient handouts; and (4) feedback on CT scan group ordering rates to providers. Our primary outcome measure was the number of CT scans performed for patients with head injuries. Process measures included the number of checklists completed and ED length of stay (LOS). Our balancing measure was return ED visits within 72 hours (with or without admission).
Baseline CT scan rates prior to our interventions was 46.1%. Our QI initiative resulted in a ‘shift’ in the Statistical Process Control chart of the weekly CT scan rates, associated with the first and second PDSA cycles, resulting in a 13.9% reduction in CT rates during the initial 3 months, and a sustained reduction of 8% at 16 months (p<0.05). Mean ED LOS for all patients with head injuries decreased by 1.5 min (p=0.74). 33% of checklists were completed. 72-hour return visits did not change significantly (p=0.68).
Through provider and patient education, and the creation of a user-friendly evidence-based tool, our local QI initiative was successful in achieving long-term reduction in CT rates for patients presenting to EDs with head injuries.
- emergency department
- quality improvement
- PDSA
This is an open access article distributed in accordance with the Creative Commons Attribution Non Commercial (CC BY-NC 4.0) license, which permits others to distribute, remix, adapt, build upon this work non-commercially, and license their derivative works on different terms, provided the original work is properly cited, appropriate credit is given, any changes made indicated, and the use is non-commercial. See: http://creativecommons.org/licenses/by-nc/4.0/.
Statistics from Altmetric.com
Problem
The University Health Network is an adult-only academic tertiary care centre in Toronto, Canada, which includes two distinct ED sites that see approximately 120 000 ED visits on an annual basis. Of these, approximately 2000 visits are for head injuries. Several national and international organisations have recently highlighted the issue of unnecessary utilisation of diagnostic imaging for patients with minor head injuries, including the Choosing Wisely Canada (CWC) Campaign, the Canadian Association of Emergency Physicians and the American College of Emergency Physicians.1–3 They also recommend the use of validated clinical decision rules to determine when CT scan imaging is necessary.1 2 The Canadian CT Head Rule (CCTHR) is a clinical decision rule that has undergone robust clinical validation, is highly sensitive for detecting clinically significant head injuries and provides clear recommendations on which patients with minor head injuries need diagnostic imaging.4–6
To understand the scope of the problem locally, a 27-month retrospective chart review of our institution’s electronic health record (EHR) data for all patients with head injuries was completed. This showed that approximately one in two patients presenting with a head injury underwent a CT scan of the head.7 Furthermore, a detailed manual review of 200 patient charts with a discharge diagnosis of head injury showed that 79% of all CT scans done were not indicated by the CCTHR, which is a significant quality issue in terms of safety, efficiency and resource utilisation. A comparison of CT scan rates before and after the launch of the CWC campaign at our institution did not show a significant difference in the proportion of CT ordered for patients with head injuries, and this highlighted the need for quality improvement (QI) methodology to tackle our local issue of over-utilisation. Hence, our aim through the Checklist for Head Injury Management Evaluation Study (CHIMES) was to achieve a relative reduction of 10% in CT scan utilisation for patients presenting to our EDs with a head injury over a period of 6 months.
Background
Head injuries are common presentations to EDs globally, with over 2 million annual visits to North American EDs, and over 400 000 annual visits in the UK alone.6 8 9 Despite heterogeneity in the mechanism of injury, studies have shown that over 90% of these patients do not have a clinically significant traumatic brain injury (ie, requiring neurosurgical intervention or admission to hospital with neurosurgical follow-up).5 6 CT scan, the most common form of imaging used for the evaluation of head injuries in high-resource settings, has been consistently over-utilised for patients with minor injuries, with studies showing that a third of CT scans done are potentially avoidable.10 Despite national recommendations by several organisations to use clinical decision rules when ordering CT scans for minor head injuries, CT scan over-utilisation remains an issue in many EDs.11 12
The CCTHR is a widely accepted and well-validated clinical decision rule used for ED patients with minor head injuries. Several studies have shown the rule performs better than other clinical decision rules and is highly sensitive at detecting clinically significant head injuries.4 6 13–15 However, the effect of the CCTHR on reducing CT scan utilisation has yielded mixed results, with some studies showing decreased CT use with the CCTHR, while others showing increased use of CT scans post-implementation.6 16
Studies that failed to show a reduction in CT scan use have identified several challenges with the implementation of the CCTHR. Major themes identified involve knowledge translation around decision rules, physician comfort and medico-legal concerns with using the CCTHR, patient preference and ease of access to diagnostic imaging.6 17 More recently, Sharp and colleagues used a multimodal intervention that included decision support, leadership buy-in and physician education to decrease CT scan use over during a 6-month period.13 In addition, work done in paediatric head injuries have shown that patient/provider education can reduce overall healthcare utilisation.18 However, studies showing long-term changes in physician behaviour surrounding CT scan utilisation for head injuries are lacking, and using QI methodology to tackle this issue has not been reported.
Measurement
Baseline measurement
Baseline measurements were determined through a retrospective cohort study. Patients aged 16 years or older with a primary or secondary discharge diagnosis of head injury were identified using International Classification of Diseases codes (ICD-9 or ICD-10) for diagnoses pertaining to head injury. CT scan rates were obtained using electronic medical records for identified patients through decision support at our institution.
There were 4322 qualifying visits at our sites during the 27-month period preceding our planned QI initiative. The median presenting age was 44.1 years (IQR 27.8–67.5), the median Glasgow Come Scale (GCS) score was 15 (maximum score 15; IQR 15–15), and the majority of patients presenting were of intermediate acuity (Canadian Triage and Acuity Scale score of three out of five levels). Overall, 43.2% of patients arrived via ambulance, and 10.5% of patients were admitted to hospital. In total, 49.2% of patients underwent a CT scan of the head. Overall length of stay (LOS) for patients who were discharged from the ED was 3.4 hours (IQR 2.2–5). LOS for patients who were discharged without a CT scan was 2.6 hours (IQR 1.7–3.6) compared with 4.5 hours (IQR 3.4–6.2) for those who underwent a CT scan. We compared the rates of CT scan utilisation in the 12 months pre-launch and post-launch of the CWC campaign, and we did not find a statistically significant difference in the rates (50.4% vs 47.7%, p=0.07). A detailed chart audit of 200 randomly selected patient charts with a final diagnosis of head injury showed that 93.5% of patients had an initial GCS score of 13–15, and 86.5% met eligibility criteria for the CCTHR. Seventy-nine per cent of all CT scans done were not indicated by the CCTHR.
We also electronically surveyed ED providers to better understand practice patterns and potential reasons for CT scan over-use prior to any planned interventions. In total, 72 out of the 100 staff providers who ordered CT scans in our ED (ie, physicians, nurse practitioners, physician assistants) responded to the survey. Moreover, 90.3% of respondents stated that they routinely used a clinical decision rule to make diagnostic imaging decisions, with the CCTHR being used exclusively; 84.7% of respondents felt that CT scans were over-used for patients with head injuries in our EDs. When asked to estimate overall CT scan utilisation for patients seen in our EDs for head injuries using deciles, the most frequent response was 40%–50% (30.6% of respondents), followed by 50%–60% (20.8% of respondents). However, when asked to estimate their own utilisation, the most frequent response was 20%–30% (34.7% of respondents), followed by 30%–40% (19.4% of respondents).
Ongoing measurements
Measures used to study our interventions were obtained through a combination of EHR and paper records, with an emphasis on clinically meaningful outcomes and patient-oriented outcomes. We used descriptive statistics (means) and statistical process control (SPC) charts to report our data. Accepted SPC chart ‘rules’ were used to detect special cause variation in our data and report any changes from baseline measurements.19 For our SPC chart analysis specifically, data from the preceding 10 months were used to establish a baseline. Tests for statistical significance were done using χ2 analysis for categorical data; the Mann-Whitney U test for continuous data. The following measures were collected for our project:
Outcome measures
Primary
Percentage of patients with an ED discharge diagnosis of head injury who underwent a CT scan of the head.
Secondary
ED LOS (in minutes) for patients with a discharge diagnosis of head injury.
Process measures
Percentage of patients with a discharge diagnosis of head injury that had our new checklist (from PDSA 2) added to their chart.
Percentage of checklists completed (when added to chart).
Balancing measures
Percentage of patients with a discharge diagnosis of head injury with a return visit to the ED within 72 hours.
Percentage of patients with a discharge diagnosis of head injury with a return visit to the ED within 72 hours and resulting in admission to hospital.
Design
Prior to our team starting this initiative, there was anecdotal agreement that CT scan over-utilisation for head injuries was an issue in our EDs. Awareness and urgency regarding over-utilisation of CT scans, and its relevance to local practice patterns, was accomplished initially by performing a retrospective cohort study at our institution, as described previously. Data from our study were presented at the monthly business meeting to ED providers. This allowed us to create a burning platform, to gauge interest in the project, and to identify potential champions.
All relevant stakeholders were engaged in the project, and they were continuously involved in various aspects of the PDSA cycles. These included the ED Chief and Assistant Chief, QI Committee leads, nursing and administrative leads, front-line medical doctors (MDs), physician assistants (PAs), nurse practitioners (NPs), registered nurses (RNs), trainees and clerical assistants. Root-cause analysis was done using a combination of electronic surveys and focus groups to elicit information. The results were used to develop an Ishikawa diagram, and QI interventions that were deemed feasible and achievable by our project team were designed, tested and implemented to achieve our aim (figure 1).
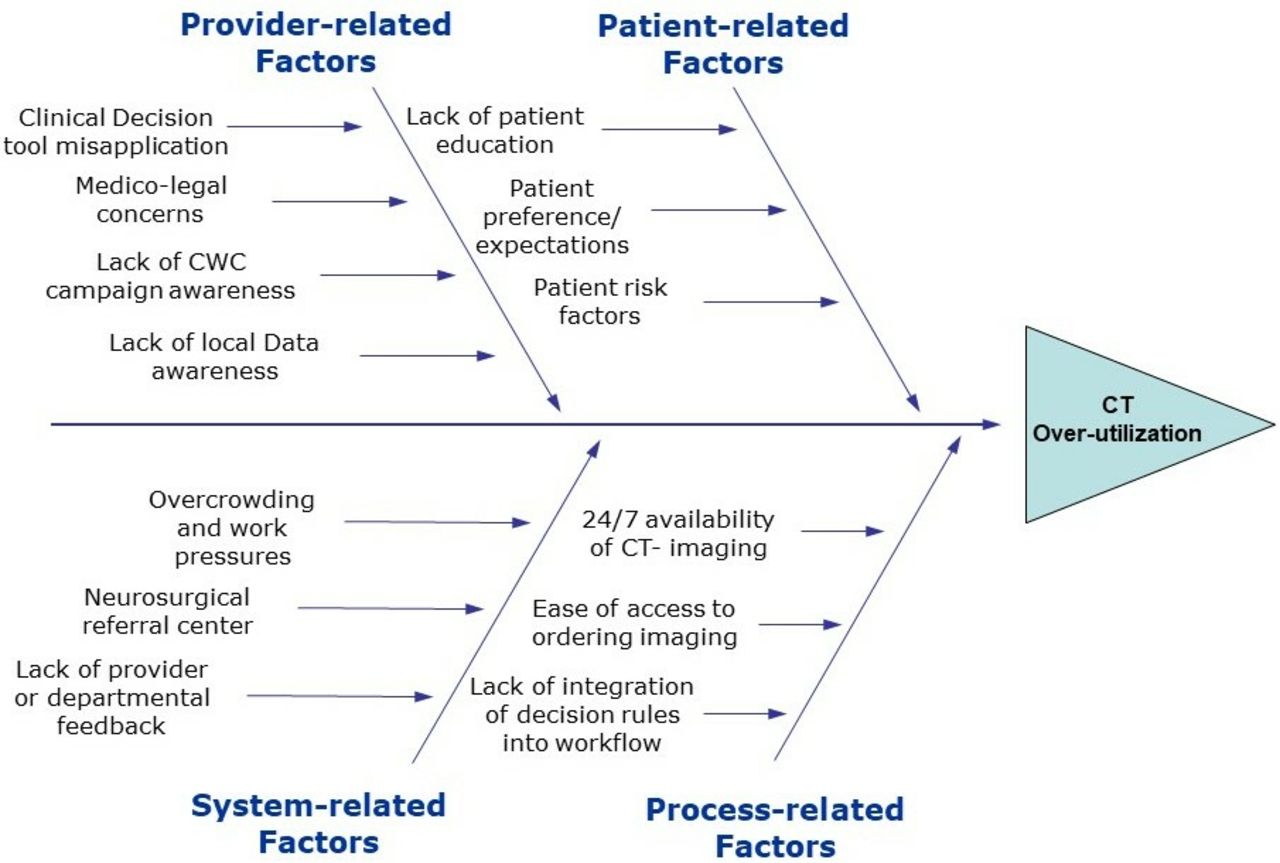
Ishikawa diagram showing results of root-cause analysis for CT over-utilisation for patients with head injury. CWC, Choosing Wisely Canada.
Strategy
Our project aim was to achieve a relative reduction of 10% in the percentage of CT scans performed by ED providers for patients presenting with head injuries over a period of 6 months. Our PDSA cycles, described below, included several small iterative improvements within each cycle. We present here the final product of each PDSA, as they were implemented in our EDs.
PDSA cycle 1: education and dissemination of the CCTHR and the CWC Campaign recommendations (weeks 1–3)
We targeted ED providers affected by our initiative including MDs, NPs, PAs and RNs. Electronic links to the CWC Campaign’s recommendation on head injuries were sent to them through our monthly ED newsletter which was accessed by 75 of the 100 targeted providers.2 In addition, we engaged MDs, NPs and PAs during one of their monthly rounds presentations by creating awareness and urgency about the project’s aim, the local baseline CT scan rates, the CWC Campaign’s recommendations and the effectiveness of validated decision rules such as the CCTHR in decreasing CT scan utilisation. Similarly, RNs and registration clerks were targeted during their daily morning huddles by creating awareness about the project’s aim to reduce CT over-utilisation and the necessity to use validated clinical decision rules.
PDSA cycle 2: introduction of new CHIMES Checklist (weeks 4–11)
One of the themes that emerged during our root-cause analysis was the inappropriate application of the CCTHR to patients with minimal head injuries (GCS score 15 and without loss of consciousness, amnesia or disorientation), instead of those with minor head injuries (GCS score 13–15, with loss of consciousness, amnesia or disorientation).20 As such, the application of a clinical decision rule to a population with a lower pre-test probability of clinically significant injury would lead to an increase in the number of CT scans done without an improvement in detection rate and hence result in a higher false-positive rate.21 Consequently, through multiple iterative cycles, we re-formatted the well-known but inadequately understood CCTHR (figure 2) in order to conspicuously show the inclusion and exclusion criteria (figure 3). With each iterative cycle, we sought feedback from front-line clinicians to ensure that we had broad acceptance and ongoing engagement prior to implementation in the ED. For example, one of the suggestions we received was to adopt a ‘flow-chart’ format for the intervention instead of a ‘checklist’ format as seen in the original CCTHR (figure 2). Our final version (figure 3) incorporates this ‘flow-chart’ format that was revised through several iterations.
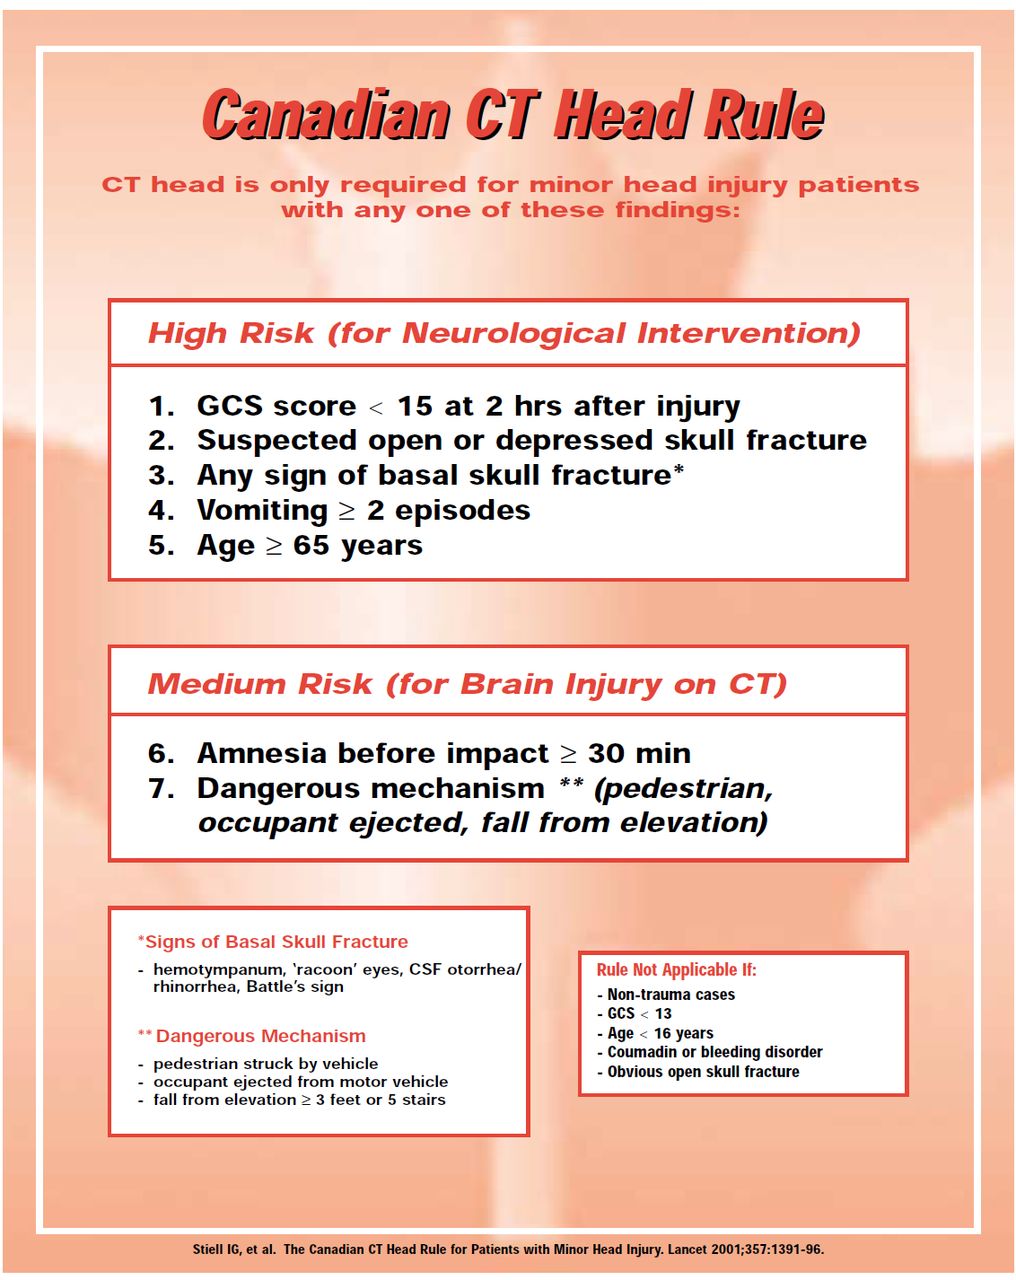
Canadian CT head rule poster as published by Stiell et al5 (reproduced with permission). CSF, cerebrospinal fluid; GCS, Glasgow Coma Scale.
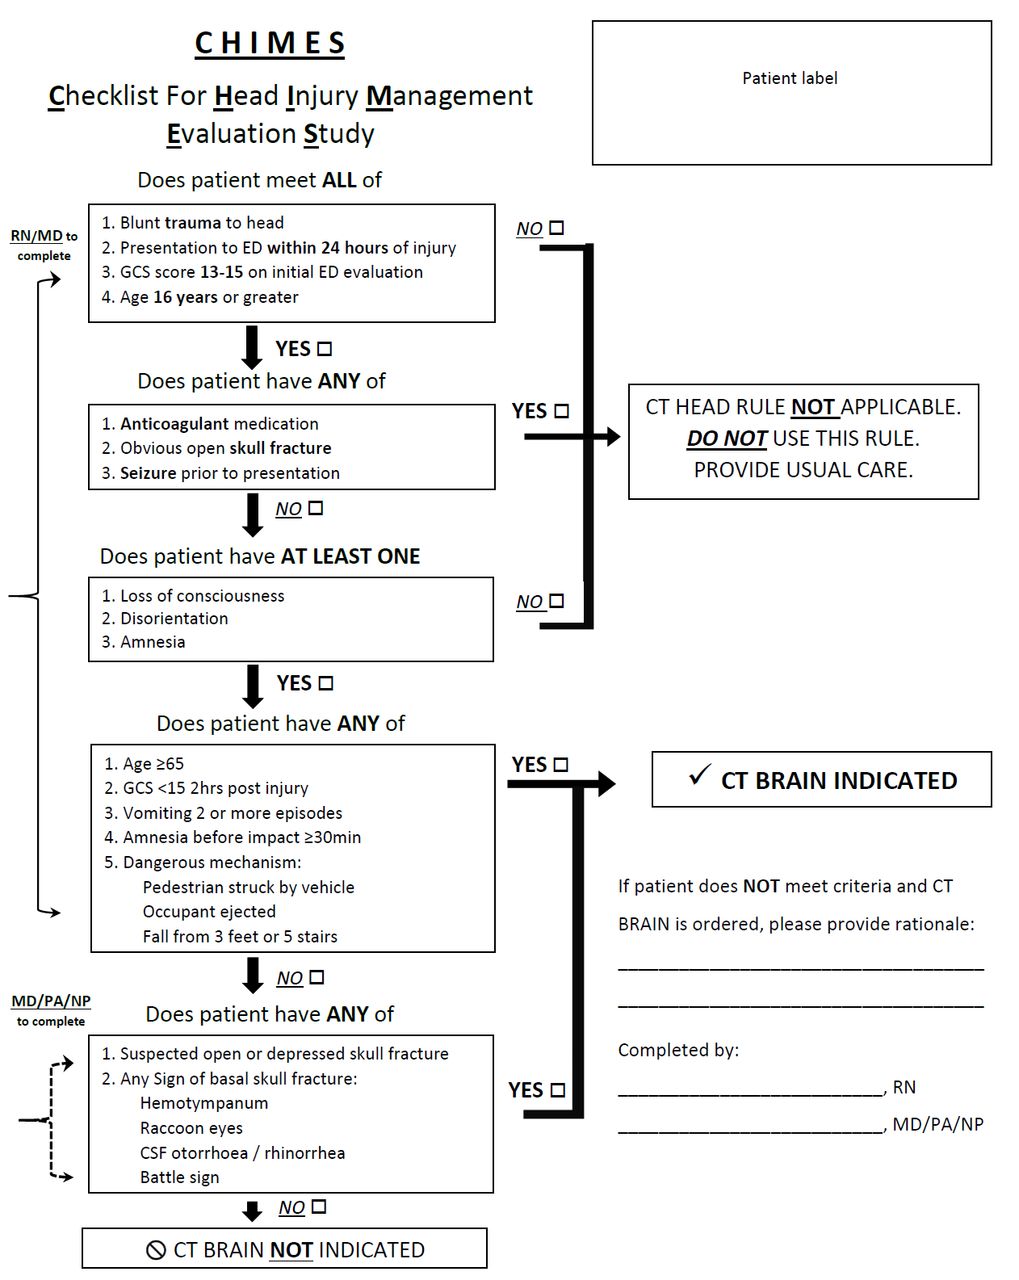
CHIMES Checklist developed by the project team, which is based on the Canadian CT head rule in figure 2. The final version of the checklist is shown which was the product of several PDSA cycles resulting in iterative improvements. CSF, cerebrospinal fluid; GCS, Glasgow Coma Scale; MD, medical doctor; NP, nurse practitioner; PA, physician assistant; RN, registered nurse.
A significant challenge we encountered during the testing and implementation phase was integrating the checklist into existing workflows, given the busy environment of the ED. Traditionally, the CCTHR has been employed at the point of CT scan order entry, which occurs after the provider–patient interaction has occurred and therefore after the clinician (MD, NP or PA) has already committed to ordering diagnostic imaging.13 16 We felt that providing reminders and cues earlier in the care process would have a bigger impact on nudging clinician behaviour since it would allow them to incorporate the CCTHR as part of their assessment and engage patients in the process before committing to ordering a CT scan.
We identified patient registration and nursing triage as the ideal times to have our new Checklist incorporated in the care process, which would serve as a flag to the treating clinicians even prior to the actual patient encounter. Our high-low process map shows how the CHIMES checklist was implemented into our existing ED workflow (figure 4). Triage nurses and registration clerks identified patients with potential head injuries based on their presenting complaint and added the Checklist to their chart. This was re-enforced through frequent reminders by the project team and posters in the triage and registration zones. Various locations were trialled for placement of the posters and checklists to ensure optimal visibility, based on feedback from the registration clerks and triage nurses, prior to deciding the final location.

High–low process map showing integration of PDSAs 2 and 3 into existing workflows in the emergency department. CWC, Choosing Wisely Canada; MD, medical doctor; RN, registered nurse.
We also encouraged bedside nurses to complete part of the Checklist that pertained to historical features of the clinical history, which to our knowledge has not been done in previous studies. Since this information was already being routinely collected as part of their nursing assessment, it did not require any change in the nursing scope of practice. The treating clinician verified and completed the checklist to aid in decision-making (figure 3).
PDSA cycle 3: CWC-themed patient handout (weeks 12–18)
Recognising that patients’ expectations are an important factor in CT scan over-utilisation, we created a patient handout that was adapted from the CWC Campaign’s patient handout (figure 5). Our handout aimed at educating patients on the limited utility of CT imaging for the vast majority of head injuries, prior to their interaction with the treating clinician. While we did not formally engage patient representatives in the development of this handout, the original CWC handout we used as a template was developed in consultation with various patient advisors, so our team felt that it would likely be user-friendly for patients.22 The one-page handout was added to patients’ charts by the triage nurse or registration clerk, and it was given to patients by the bedside nurse. This specific workflow was a key element of our intervention since we hypothesised that having the bedside nurse deliver the handout to patients (as opposed to the triage nurse) would potentially prevent patients from leaving without being assessed by a provider, especially during busy days when wait times could be longer than usual. It also allowed for a potential discussion between the treating clinician and the patient regarding indications for imaging in head injuries.
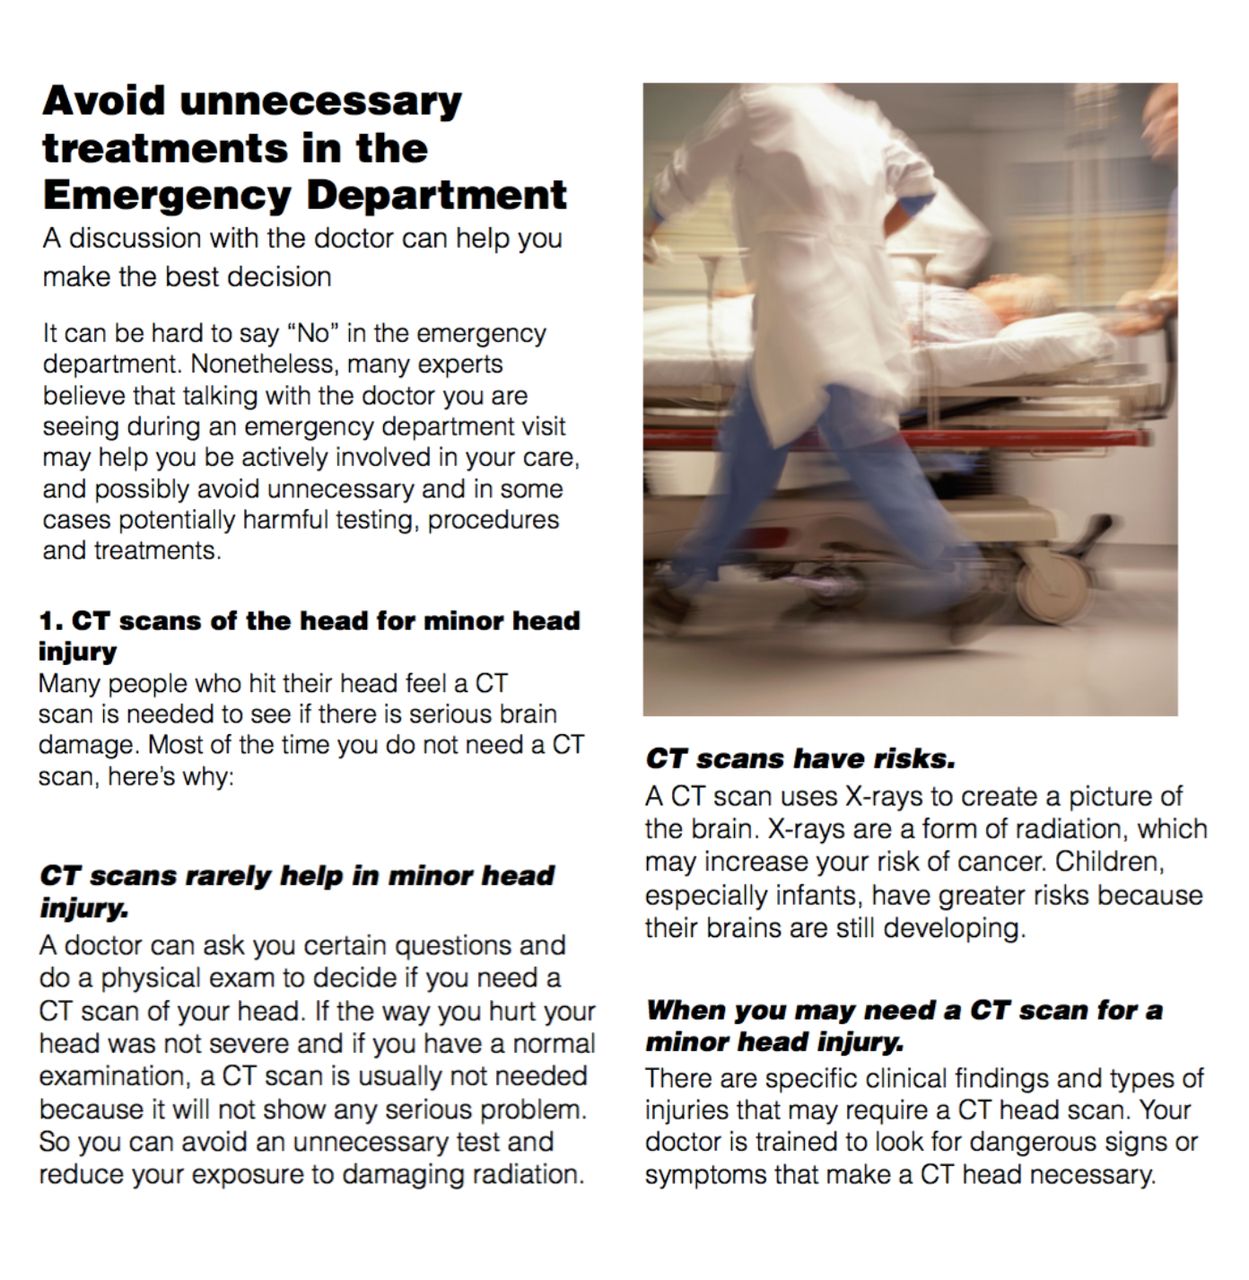
Choosing Wisely Canada–themed patient handout that was developed and implemented based as part of PDSA 3.
PDSA cycle 4: reporting of CT scan rates to providers (weeks 19–50)
Aggregate rates of CT scans done for patients with head injuries during the project period were presented to physicians on a monthly basis during business meetings and to nurses during daily morning huddles on a bi-monthly basis. These avenues were deliberately chosen to ensure that feedback could be provided in a sustainable format, without the need for any additional time away from clinical work. We also worked with our local Decision Support team to produce automated weekly data for our chosen outcomes. Rates for the preceding 2 weeks were compared with our baseline rate and presented as actual numbers of potential CT scans avoided to provide context and allow providers to see tangible benefits. This feedback also served as reminders about the project’s aim and nudged providers to continue engaging in the ongoing PDSA cycles.
Results
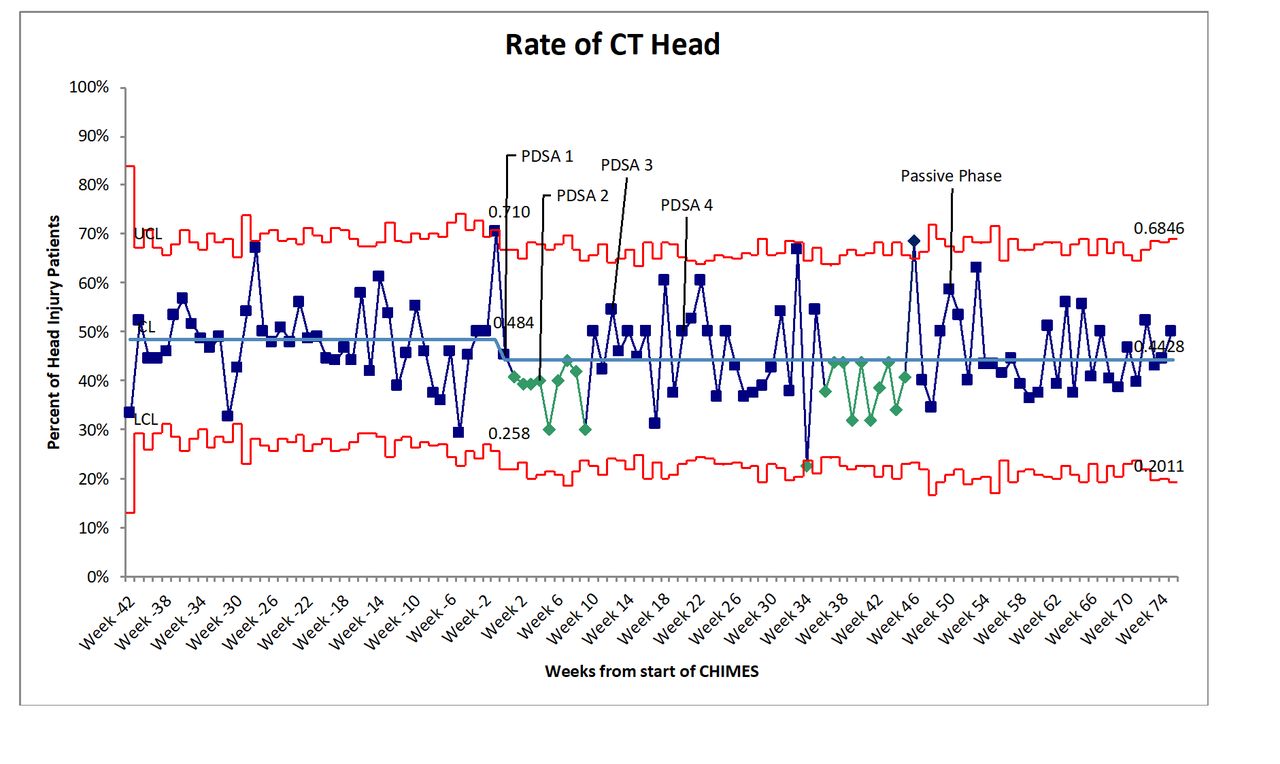
The mean weekly CT scan rate for patients with head injuries prior to the start of our project was 48.1%. We observed a 13.9% relative decrease in our primary outcome of CT scan rates at 3 months and 7.4% at 6 months. To assess sustainability, we measured CT scan rates 6 months after completion of all four PDSA cycles (16 months from the start of the project) and found that an 8.0% reduction was maintained (48.1% vs 44.3%, p<0.05). Figure 6 shows the SPC chart for our interventions with ‘shifts’ as per accepted SPC chart rules in mean weekly CT scan rates seen with the first and second PDSA cycle clusters, and prior to the start of the ‘passive’ phase of the project when weekly feedback was no longer provided.

Statistical process control p-chart showing changes in CT rates during and after the study period. PDSA cycles indicated by 1=education and dissemination of Choosing Wisely Canada (CWC) Campaign recommendations; 2=introduction of the new CHIMES Checklist; 3=distribution of the CWC patient handout; 4=bi-monthly feedback on CT-scan rates to providers. A ‘shift’ is seen with PDSA cycles 1 and 2, and prior to the start of the ‘passive’ phase.
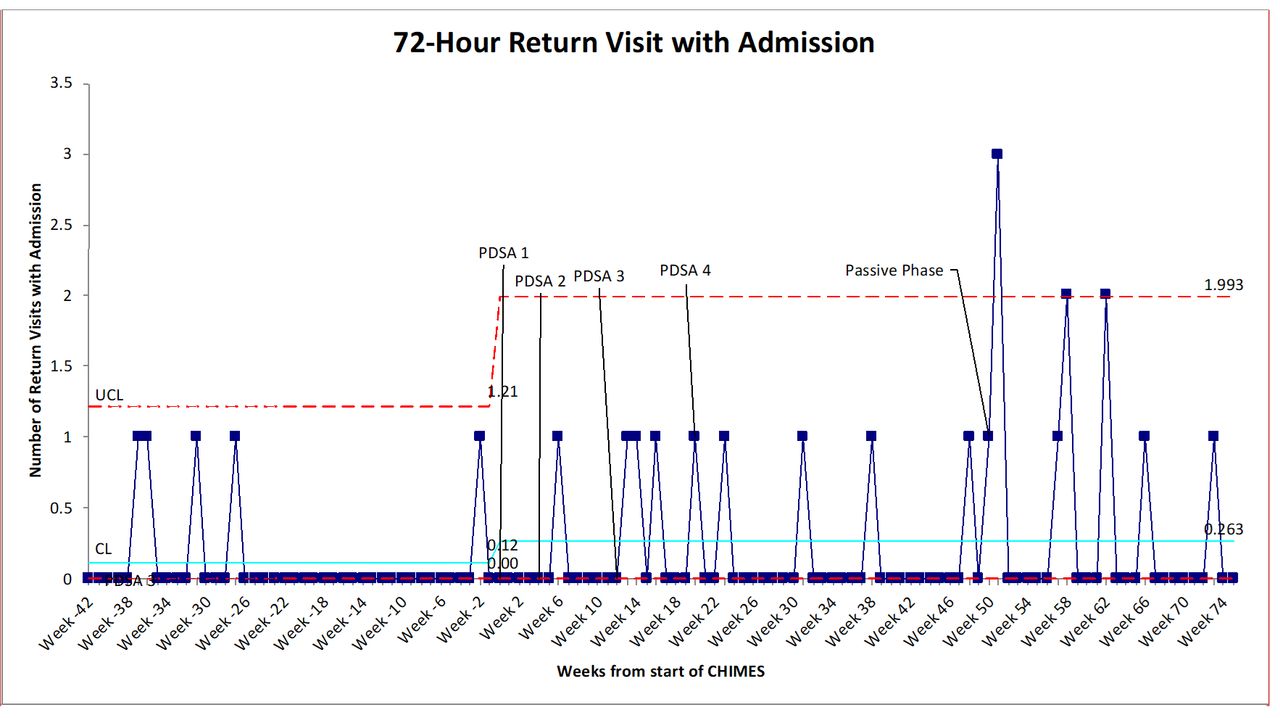
Mean ED LOS for patients with head injuries saw a small reduction of 1.5 min per ED visit, which was supported by a ‘trend’ in the SPC chart (figure 7) seen after PDSA 3 (238.9 min vs 237.4 min, p=0.74). This affected all patients with head injuries, regardless of whether a CT scan was performed, and saved a total of 84.2 hours (3.5 days) of ED LOS during the study period. Rates of 72 hours ED return visits (figure 8) did not show a difference over the study period (4.4% vs 4.6%, p=0.68). An astronomical point was observed in the SPC chart during the passive phase of the project, which was not clinically relevant on case review. Rates of 72 hours ED return visits resulting in admission to hospital (figure 9) also did not show a significant difference over the 16-month study period (0.2% vs 0.6%, p=0.08). An astronomical point observed at week 52 (3 return visits) was not deemed to be clinically significant on chart review, and no injuries were missed on the initial visit. To assess our process measures, 75 randomly selected charts of patients diagnosed with head injuries during the 6 months following our interventions were audited. In total, 33.3% of patients had a Checklist added to their chart, of which 84.0% were completed by ED providers.
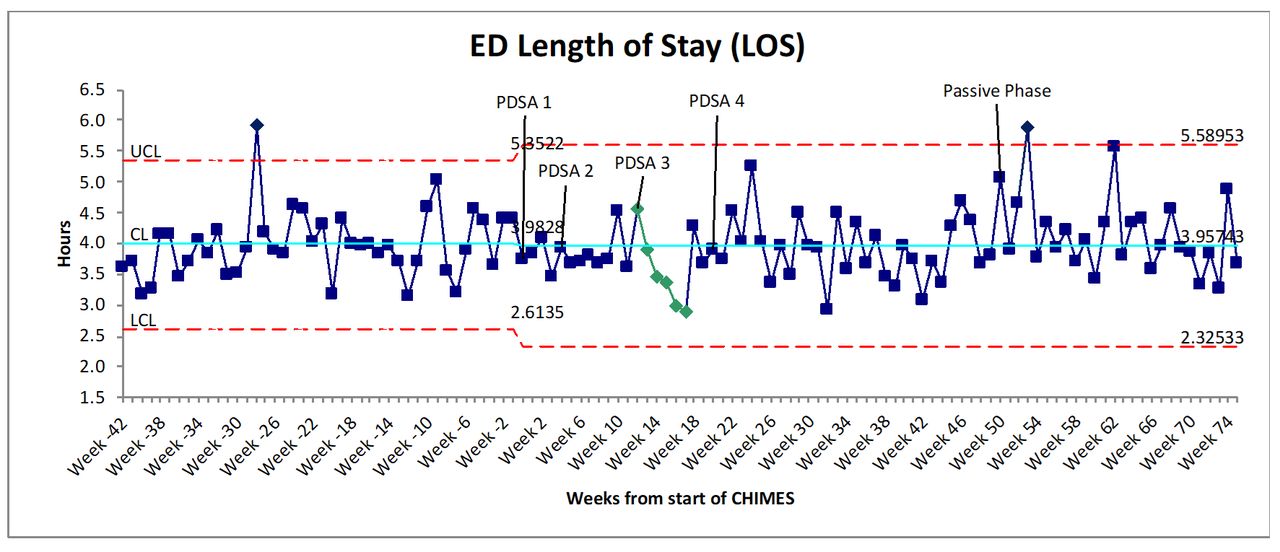
Statistical process control XmR-chart showing changes in emergency department length of stay during and after the study period. PDSA cycles indicated by 1=education and dissemination of Choosing Wisely Canada (CWC) Campaign recommendations; 2=introduction of the new CHIMES Checklist; 3=distribution of the CWC patient handout; 4=bi-monthly feedback on CT-scan rates to providers. A ‘trend’ towards decreased length of stay is seen with PDSA cycle 3.
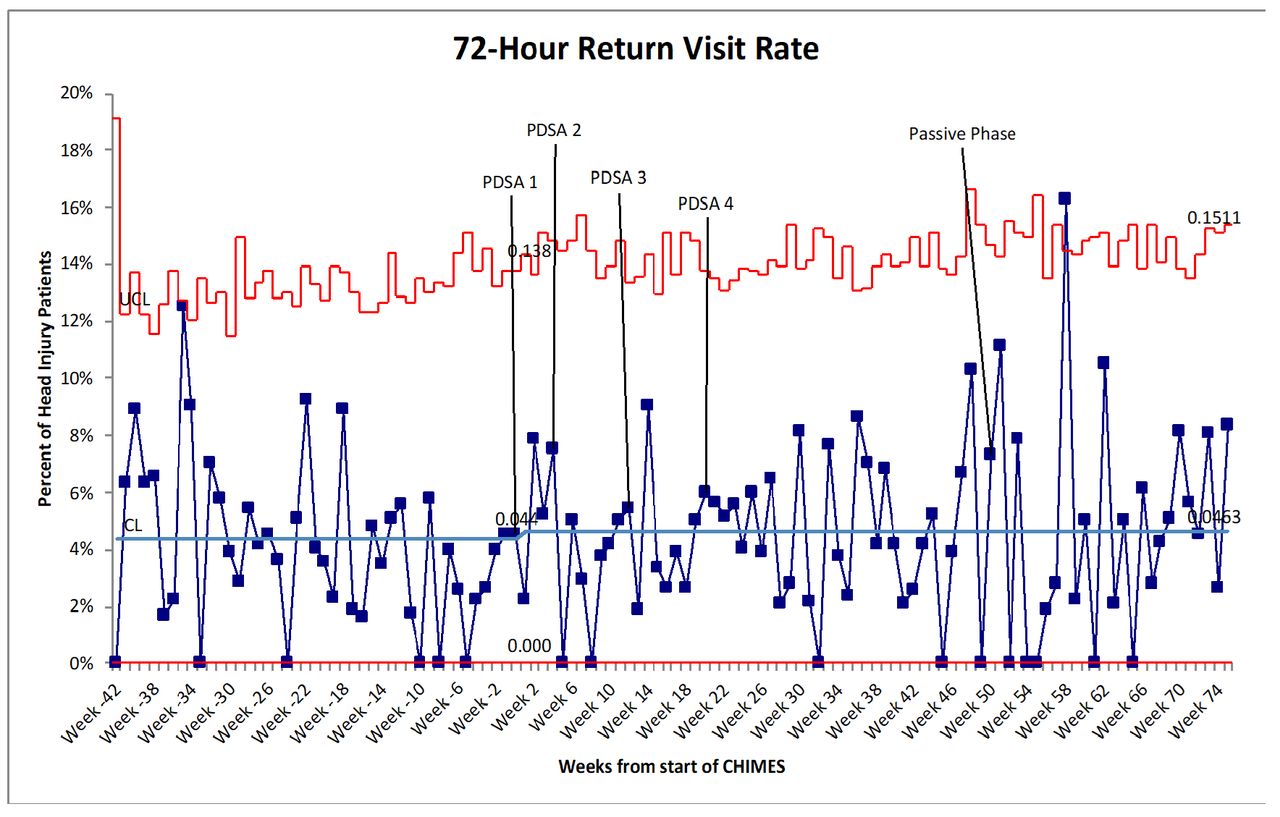
Statistical process control p-chart showing rates of return visits to the emergency department for patients discharged with a diagnosis of head injury. PDSA cycles indicated by 1=education and dissemination of Choosing Wisely Canada (CWC) Campaign recommendations; 2=introduction of the new CHIMES Checklist; 3=distribution of the CWC patient handout; 4=bi-monthly feedback on CT-scan rates to providers. An ‘astronomical point’ is seen at week 58.

Statistical process control p-chart showing rates of return visits to the emergency department for patients discharged with a diagnosis of head injury that resulted in an admission to hospital. PDSA cycles indicated by 1=education and dissemination of Choosing Wisely Canada (CWC) Campaign recommendations; 2=introduction of the new CHIMES Checklist; 3=distribution of the CWC patient handout; 4=bi-monthly feedback on CT-scan rates to providers.
Lessons and limitations
The overall goal of our project was to reduce the number of CT scans performed for patients with minor head injuries. We aimed to create interprofessional interventions that would mirror our EDs’ natural workflow. Previous work by Stiell and colleagues has demonstrated that nurse-initiated use of decision rules for patients with cervical spine injuries is effective and reliable.23 Hence, we engaged nurses to complete part of the CCTHR by completing sections that aligned with their existing assessments of patients. Given that this is the first nurse-initiated CCTHR implementation we are aware of, we worked closely with our Nurse Educators to ensure that it was within the existing scope of practice for nurses. Involving nurses in the data-gathering process was an important aspect of our intervention that was well received by both nurses and physicians, and it improved their engagement in our initiative. Findings documented by the nurses were verified by the treating clinician, and all decisions pertaining to use of imaging were made by the treating clinician.
An important consideration for our team was to engage staff at various stages of the care continuum, with the aim to create redundancy in workflow processes and improve uptake of our interventions. However, engaging non-clinical staff in interventions that may result in an increase in their workload (ie, putting a checklist on relevant patients’ charts) was challenging due to their limited involvement in the downstream clinical course and lack of immediate relevance to their roles. The issue of decreased engagement and sustainability as a result of increased workload has been demonstrated before in our ED before.24 This was reflected in the low percentage of checklists added to charts, which likely impacted our overall outcome. Indeed, if checklists were added to patients’ charts, they were completed 84% of the time, suggesting that the initial process of adding the checklist was an important factor that determined its use. This underscored the importance of using different approaches and incentives to engage non-clinical staff. In reviewing our interventions post hoc, we identified that our interventions were biased towards clinical staff involved in direct patient care, and likely contributed to the variable engagement that we observed.
From a data standpoint, while the focus of our interventions was on patients with minimal or minor head injuries, our EHR-based outcome of head injury was an all-encompassing outcome that did not distinguish between minimal, minor, moderate or severe head injuries. While minimal and minor head injuries are relatively benign and do not generally require inpatient neurosurgical care, moderate to severe injuries typically do. This was an inherent resource limitation of using a more pragmatic electronic dataset over individual chart reviews. Due to the lack of complete patient-level information, for the 10.5% of patients who were admitted, we were unable to determine whether these patients were admitted for neurosurgical intervention or for other reasons. To compensate for the lack of granular information available from our EHRs, we did a manual paper-chart review of 200 random patients to ensure validity of our EHR-based outcome measure by comparing it with data from patient charts. From our chart review, it was apparent that 98% of patients with an EHR discharge diagnosis of head injury seen in our EDs met the definition of minimal or minor head injury at presentation, and hence we felt that our use of EHR-coded diagnosis of head injury was a reasonable surrogate to use despite its limitations. Using more readily available EHR data was essential to the success of our project, both in terms of implementing our interventions through rapid cycle PDSAs and in disseminating our success early to keep existing stakeholders engaged. Another limitation of working in a low-fidelity setting where most workflows are paper based was the logistical and financial feasibility of rapid-cycle PDSAs. While we were able to use smaller iterative cycles in the development of the checklist (PDSA 3), once implemented, further PDSAs were restricted due to resource limitations of having to wait until existing paper checklists were used before being able to replace them with an improved checklist. We anticipate that these challenges would be easily overcome in an EHR-optimised environment where rapid changes to workflows may be more easily feasible.
We saw the biggest reduction in CT scan rates in the initial 3 months post-implementation. This correlated with the first three PDSA cycles of our project, where engagement levels were highest as providers and stakeholders were receiving education around the initiative and a new checklist was being introduced. While there was a decline in effect seen at 6 months, this effect was sustained well beyond the active phase of the project. This decline in effect correlated with a shift in emphasis of the project from education towards feedback, which may have been less engaging compared with the initial PDSAs since it involved less direct interaction with the project leads. Prior to the start of the passive phase of the project, as providers were re-engaged and reminded about the end of weekly feedback, we saw an increased effect as seen in the SPC chart with a ‘shift’ (figure 6). This finding underscores the importance of continued engagement in QI projects, that mechanisms to keep staff continuously engaged can be challenging, and that education and feedback can be powerful tools for change above and beyond modifications in the system alone. Sustainability in QI initiatives is often challenging and many well-designed projects are not sustained beyond the initial phases25 A sustained effect seen well beyond the active phase suggests the establishment of a new ‘norm’ in our EDs, which has been described as an important element of sustainability in QI projects.26 Mechanisms that allow staff to be continually engaged through either automated feedback processes or by using local champions may allow for even larger effects in the long term.
Conclusion
Head injuries are common presentations seen EDs and over-utilisation of CT scans is an issue in many EDs. We used QI approaches and rapid-cycle methodology to change clinician behaviour and reduce CT ordering for head injuries. Through a combination of patient-oriented (ie, patient handout) and provider-oriented (ie, education and dissemination of CWC recommendations, CHIMES Checklist implementation, provider feedback) interventions, we were able to show a reduction in CT scan rates over a 16-month period. Our study highlights the importance of using QI methodology in effecting change at a local level and improving the adoption of guideline recommendations. The success of our ED-based project has resulted in institution-wide adoption of our methodology, and a similar initiative is now being developed to address CT scan over-utilisation for in-patient falls that result in head injuries. We believe that our project’s methodology and interventions are very amenable to being replicated in similar settings and the lessons learnt would be transferable to other projects that focus on resource utilisation.
Acknowledgments
The study authors would like to acknowledge the contribution of the following individuals to the project for support and suggestions in the design and implementation of the project: Steve Casey (Nurse Educator), Brittany Jenkins (Nurse Educator), Kathy Bates (Nurse Manager), Deborah Davies (Nurse Manager), Jason Dickson (Administrative Coordinator), Rita Ramnarine (Administrative Coordinator) and Meredith Kuipers (Research Coordinator).
References
Footnotes
Twitter @masood_sameer, @chartierlucas
Contributors SM and LBC designed the study and interventions. SM conducted the literature review. SM and JHY were responsible for data collection and abstraction. SM and VW conducted the analysis. SM wrote the first draft of the manuscript. All authors meaningfully contributed to revisions, have reviewed the final manuscript and have provided permission to publish the manuscript.
Funding The authors have not declared a specific grant for this research from any funding agency in the public, commercial or not-for-profit sectors.
Competing interests None declared.
Patient consent for publication Not required.
Ethics approval Our study was approved by the institutional research ethics board, and an exemption was granted given its use of quality improvement methodology.
Provenance and peer review Not commissioned; externally peer reviewed.
Data availability statement All data relevant to the study are included in the article.