Article Text

Abstract
Introduction A zoning system is used to ensure that service users receive appropriate levels of support while they are using community mental health team (CMHT) services. Patients are split into red, amber and green zones and are discussed in a daily morning meeting to ensure management plans are in place. We identified that the meeting was an area for improvement as initial feedback indicated that the meeting was repetitive, newcomers to the team found that they did not understand why patients were in different zones and discussions were not being documented. Our three aims for the project were to improve staff-rated satisfaction by 25%, to improve weekly documentation of discussions to 100% and to improve the quality of information handed over by 25% over 4 months.
Methods We used the Model for Improvement and "plan, do, study, act" (PDSA) cycles to test change ideas such as having someone chair the meeting, use of a ‘situation, background, assessment, recommendation, decision’ (SBARD) format to handover, introduction of a blue zone for inpatients and documentation in a specific part of the electronic notes at a specific time.
Results We did not find our PDSA cycles led to a consistent change in satisfaction, quality and efficiency. We found an improvement of SBARD use up to 100% although this was not always consistent and an improvement in documentation to 100% for 3 weeks however this was not sustained.
Conclusion On examining barriers to change, we found the key to sustaining improvement is in ensuring multidisciplinary team member involvement at all stages of the Quality Improvement project.
- mental health
- quality improvement
- quality improvement methodologies
- teamwork
- PDSA
This is an open access article distributed in accordance with the Creative Commons Attribution Non Commercial (CC BY-NC 4.0) license, which permits others to distribute, remix, adapt, build upon this work non-commercially, and license their derivative works on different terms, provided the original work is properly cited, appropriate credit is given, any changes made indicated, and the use is non-commercial. See: http://creativecommons.org/licenses/by-nc/4.0/.
Statistics from Altmetric.com
Problem
Our community mental health team (CMHT) is a rehabilitation and recovery service with a caseload of around 140 patients with predominantly chronic psychotic illness and high levels of need living in residential care or highly supported accommodation in an inner-city London borough. The team of around 12 staff is multidisciplinary with psychiatry doctors, mental health nurses, occupational therapists, social workers and psychologists. Zoning is a clinical system whereby a caseload of patients are stratified into zones according to the levels of support they need that is used widely across the trust in both community teams and inpatient teams as part of a wider programme of measures aimed at improving safety.1 Depending on the remit of the team, the zoning system is used differently, for example, an inpatient ward often relates each zone to a discharge pathway whereas our team, that looks after patients with chronic severe and enduring mental health problems for long periods of time, use recovery as a goal.2 We identified that our team’s daily zoning meeting was an area for improvement as initial feedback indicated that the meeting was repetitive, newcomers to the team found they did not understand why patients were in different zones and discussions were not being documented.
We hoped to improve our team's zoning meeting in order to make the meeting more useful to staff and better recorded for more robust risk management. Our three aims were to improve staff-rated satisfaction and quality of information handed over by 25% as this was already rated as 6-7/10 at baseline and to improve weekly documentation of discussions to 100% as only 36% of discussions were documented at baseline and this was a clinical safety issue.
Background
‘Zoning’ is a pragmatic system used to ensure that service users receive appropriate levels of support while they are using CMHT services by facilitating the delivery of targeted mental health, physical health and social interventions according to need. It consists of displaying a team’s caseload of patients on a white board with different traffic light-coloured zones (red, amber and green) in which patients are moved within according to the level of support they require. The different ‘zones’ have set inclusion criteria to guide staff on their use.3
In our team, the green zone was for patients who are stable in mental state and social functioning with no current concerns and are engaging well in their current care plan. The interventions for these clients are focused on discussing recovery plans, step down and discharge planning. Amber zone is for patients with increased levels of need or early signs of relapse that are causing concern but not currently presenting with a major or immediate risk. They may also be irregularly engaging or have increased social needs. Interventions focus on increased reviews, liaison with care home staff and keyworkers and consideration of extra support from the Home Treatment Team or other agencies. Red zone patients are in crisis or are showing significant signs of relapse, at increased risk of harm to themselves or others, have complex social or safeguarding issues or have disengaged from services. Interventions include senior (Consultant/Team Leader) reviews, consideration of the Home Treatment or admission either informally or following a Mental Health Act Assessment. Each morning, the team meets for 30 min to discuss all of the patients in either the red zone or the amber zone to ensure that there is a robust management plan in place for each of them.
In terms of the literature on zoning, Ryrie et al3 produced a descriptive study introducing the concept of zoning in an inner-city CMHT and investigating if it could enhance service delivery. They identified that the daily meeting encouraged staff members to follow operational policies more closely and allowed a forum for expressing difficulties with cases and sharing clinical knowledge allowing for informal support. Limitations discussed were that it required staff to be committed to the process and was only one part of wider supervision. It did not measure clinical outcomes, however, so could not comment on these types of benefits. Further descriptive studies have highlighted benefits in inpatient units in freeing up staff to offer individual users time for interventions4 and service evaluations have stated that it is considered to be of value to staff, service users and families.5 The authors are not aware of any other studies that aim to improve the process of zoning.
SBAR (situation, background, assessment, recommendation) is a tool widely used in healthcare settings that have been shown to improve communication between clinicians6 and is recommended by the National Health Service (NHS) Institute for Improvement.7 It was already being used by teams in our trust in a modified format with the addition of a ‘D’ for ‘Decision’.8 We decided to use this modified version of the tool not only to adhere to trust guidelines but also because the key outcome of a zoning meeting discussion is a shared ‘decision’ made about patient care.
Measurement
We measured staff rated satisfaction with the meeting, quality of information handed over (eg, background details of why the patient is in the zone they are in) and efficiency. Each item (satisfaction/quality/efficiency) was rated on a scale-out of 10 immediately post-meeting with 1=unsatisfied/poor quality/poor efficiency and 10=very satisfied/high quality/high efficiency. This was measured via a written questionnaire twice weekly with three questions that took <5 min to fill out. It also had space for qualitative comments so staff could specifically state what they felt was useful or not and give any further ideas for improvement.
We also measured the percentage of patients handed over in a ‘situation, background, assessment, recommendation, decision’ (SBARD) format two times a week, in order to get an objective measure of the quality of information handed over. This was done by one of the authors observing team members in the meetings to assess whether SBARD had been adhered to. We measured the duration of the meeting in time two times a week. The percentage of patients in the red zone with documentation in the electronic notes system was measured once a week by the authors reviewing patients’ notes.
We started taking these measures for 6 weeks prior to the project and calculated a median in order to get a baseline which was 7/10 for satisfaction, 6.85/10 for quality and 7.7/10 for efficiency. Baseline documentation of red zone discussions was only 36%. The use of SBARD at baseline was 0%. We continued to take these measures throughout the project and used them to assess how effectively our PDSA (plan–do–study–act) cycles were leading to change.
Design
The QI project was led by the medical team with support from the rest of the multidisciplinary team. Baseline data were collected over a period of 6 weeks in order to get a snapshot of the problem. Following this, the whole team met and collaboratively developed a driver diagram (figure 1). In this, the zoning meeting was broken down into actions taken pre, during and post meeting in order to generate a list of change ideas that could then be tested out in PDSA cycles using the Model for Improvement over a period of 4 months from April to July 2018. As PDSA cycles were tested, data were continuously collected. Feedback and next steps in the project were discussed at monthly multidisciplinary meetings. The ‘LifeQI’ web programme9 was used to input data in order to produce the figures and graphs. This report was written using the SQUIRE (Standards for Quality Improvement Reporting Excellence) guidelines.10

Driver diagram. PDSA, plan–do–study–act; SBARD, situation, background, assessment, recommendation, decision. CC, care coordinator; EPJS - electronic patient journey system; CTO - community treatment order.
Patient and public involvement
As the zoning meeting is a service provision tool we did not plan to involve the patient’s during this preliminary pilot. However, if our PDSA cycles did lead to sustained improvements, one of our next steps would be in measuring patient outcomes and collecting patient opinions as this would be important in assessing the utility of any interventions.
Strategy
PDSA 1: duty person chairs meeting
Our first change idea tested was to have a staff member chair the meeting. We felt this would improve the staff rated efficiency of the meeting by giving it structure. The team made this change and it became embedded as a regular part of the meeting within 2 weeks. No consistent improvement in satisfaction, quality or efficiency was seen—however, the change was unfortunately introduced, due to the enthusiasm of the team, before baseline measures could be fully completed, therefore it is difficult to comment on whether this affected the baseline data. Qualitative feedback comments were positive, ‘the duty person gives the meeting structure’, and as the team felt this was a useful change it was continued. Future improvements ideas were linking this to other change ideas to sustain positive changes, for example, by the duty person encouraging the use of SBARD or by having a ‘duty book’ to write down specific jobs.
PDSA 2, 3 and 4: use of SBARD
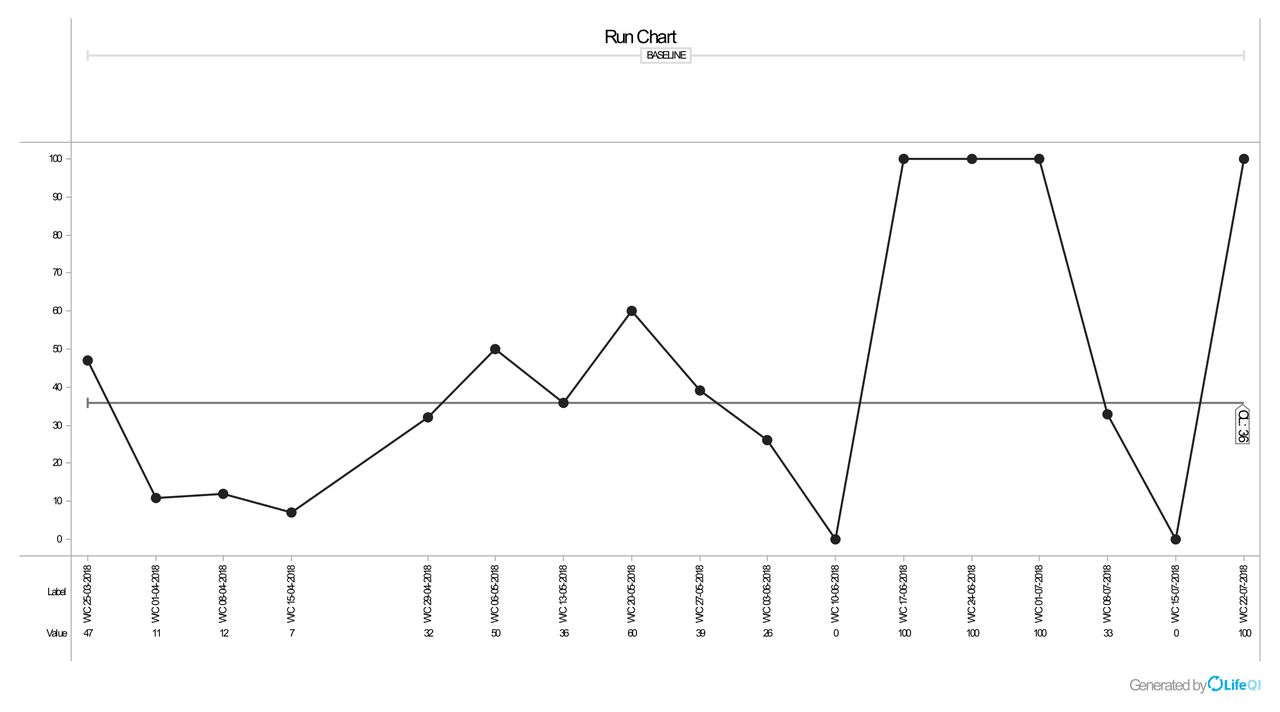
Our next PDSA ramp was focusing on improving the quality of information handed over by using an SBARD format to handover each patient. We ran a short training session on how to use the format, produced an SBARD crib sheet for staff to have during the meeting and ran an example zoning meeting where staff members could practice the format without any pressure. People were initially anxious about the change feeling it would make the meeting repetitive but after the training session staff gave positive feedback comments that ‘SBARD worked well’. The number of people using SBARD increased to 100%, however, this dropped back down 56% within 2 weeks (figure 2) Given our measurements showed the change could not be sustained in our next PDSA cycle we next tried using a ‘huddle’ (where the whole team gathered around the board in the morning) as we thought this could remind people to use the system by passing around a laminated SBARD crib sheet to each team member as they handed over. People engaged well at first with positive feedback comments ‘huddling gave me a sense of focus’ ‘huddling around the white board is a good warm up for the day’. However, despite positive comments, the use of SBARD continued to decrease rather than increase and negative comments also started to appear in the feedback ‘I do not like the huddle—I prefer to sit’. By the next week, people had stopped using the huddle, so we discussed this in a multidisciplinary team meeting and there were mixed feelings about its usefulness. As there was no measured sustained increase in SBARD use or satisfaction we made the decision not to continue with this change idea. Our 4th PDSA cycle was following a discussion in the team about why people had stopped using SBARD—people described that it felt repetitive to repeat the name, age and diagnosis. We discussed the important information that continued to be missed out in the handover—the reason for the patient being in the zone they are in. We decided to update our SBARD format to be more succinct and focus on this. We edited our SBARD crib sheet to combine Situation and Background. SBARD use increased to 100% for the next 3 weeks before falling back down again. By the end of the project, we had increased SBARD use from a baseline mean of 0%–56%. Future ideas for embedding this change and improving further were having the duty person act as a reminder and having two further QI champions who would promote the changes.

Run chart for SBARD use. SBARD, situation, background, assessment, recommendation, decision.
PDSA 5: introduction of the blue zone
We noticed that most of the patients discussed in the red zone for long periods were inpatients in the hospital who were being treated by an inpatient team and had different needs to an acutely relapsing patient in the community. We felt it was important, we continued to discuss them but not as frequently as three times per week. Therefore, we thought we could increase the efficiency of the meeting and reduce the time of the red zone discussion by introducing a new ‘blue zone’ for inpatients. We agreed to discuss these patients once per week on Monday and for the team leader to feedback after the bed management meeting on Wednesday. Interventions in this zone consisted of liaising with inpatient teams and care homes in order to get regular updates and to allow discharge planning. We added a new area to the whiteboard and informed all team members of the change. Qualitative feedback comments were positive ‘it frees up the red zone’ ‘meetings are less repetitive’. However, there was no significant improvement in staff-rated efficiency. Given the positive feedback from the whole team, we re-wrote our team zoning policy to include a blue zone.
PDSA 6, 7: documentation of red zone discussions
Our baseline measures found that only 35% of red zone discussions were being documented weekly. Our initial change was having one team member completing the zoning entries on a Friday on the electronic notes system. The team junior doctor nominated themselves to complete this and it took around 35 min to document eight patients. This led to an improvement of documentation up to 100%, however, this was not sustainable as when the team member was then on leave the documentation dropped to 0% over the next 2 weeks. For our next PDSA cycle, we needed a more sustainable change so asked the team leader to dedicate a 10–15 min slot after the meeting on a Friday for each team member to document their own patient’s entries. A training session was completed to ensure each person knew where to document and they were reminded each Friday by the team leader. If a team member was away, then another staff member was nominated to complete their patients at the zoning meeting. This increased documentation of up to 100% (figure 3)
Run chart for documentation of red zone.
Results
Overall, our data did not show any significant improvement in staff-rated satisfaction, efficiency or quality following any of our PDSA cycles. This meant that we did not meet our aim to improve staff satisfaction with our zoning meeting by 25% in the time period we were able to complete the project. We did manage to improve the level of documentation from 0% to 56% but this also did not meet our target aim of 100%. Although we did not manage to improve the staff-rated quality of information handed over during the meeting, we did improve the SBARD use from a baseline of 0% to a mean of 56% which met our target of improving by 25%. We noticed in all cases, however, that we found it difficult to sustain any changes we made. We did end up missing some data from week to week due to the data collector being on annual leave or on-call duties. This may have affected the ability to detect more sensitive changes. There were no costs related to any changes and we did not find any interventions made any of our measures significantly worse.
Lessons and limitations
The major problem we faced as a team was in maintaining the positive changes we had seen in SBARD use and documentation. We discussed the barriers to change as a team and identified several factors that may have influenced our data. These included the existing admin burden of care coordinators meaning that they felt overwhelmed by new changes in the zoning meeting, reliance on one team member to promote changes meaning that when this team member was away, people would slip back to their old habits. We also noticed a difference in opinion between team members in what changes were helpful when looking at qualitative comments. As we noticed these barriers to change, we tried to overcome some of these by regularly feeding back and discussing the progress of the project at monthly team meetings, we also nominated two other team members as QI champions and a team away day was organised in order to address any other human factors that could be impacting on the collaborative nature of the project. Another limitation was not involving patients on this initial project. Patients were not involved as the zoning meeting is a service provision tool and this first project focused on increasing usefulness for staff. However, it is done in order to benefit patients so the next step would be in taking some objective patient data measures, for example, readmission or relapse rates in order to see if there was any change in this.
The scales we used to measure subjective satisfaction, quality and efficiency were not validated measures; they were scales of 1–10 developed by the authors, which may have affected the validity of our results and meant that our measures were not sensitive to small changes. There were often different numbers of team members at the meetings which may have had an impact on scoring and duration of the meeting. Measuring whether each team member had adhered to SBARD was also a subjective decision by the author which could have affected validity. We would have liked to collect more data in order to ensure our results were not due to chance but were limited by the authors moving onto subsequent jobs. We feel the results are broadly generalisable to similar CMHTs and by learning from some of the lessons and limitations of our project there is scope to make and sustain more impactful changes with more sensitive or patient-focused measures.
Conclusions
Overall despite zoning becoming a widely implemented measure across inpatient and community mental health services, there is little research or literature on how it should be effectively conducted in order to lead to service improvements for patients and staff members. Given the qualitative nature of previous research, we knew it would be important to collect qualitative ‘free text’ comments as well as subjective and objective quantitative measures. We met only one of our three aims and although we found the collection of data was sustainable within the project, the nature of leading a project as a junior doctor who will move on from the job within a 6-month period meant that embedding positive changes was more difficult. On assessing the barriers to change, we found the key was in engaging the whole team collaboratively at all stages of the project. In order to ensure our work continued, we handed over the methods of data collection and recording, and other change ideas to subsequent team members in the hope they could continue testing change ideas in PDSA cycles and sustain changes. We hope the project can be expanded further and look into patient-level data, which is limited in this area and next steps could be examining whether changes such as the introduction of a ‘blue zone’ or use of SBARD reduced admission rates or enhanced timeliness of care provided for patients in the red zone. This study could be replicated in other CMHTs within our Trust or across other organisations.
Acknowledgments
All members of the Lewisham Enhanced Recovery Team; Rachel Leaton, South London and Maudsley Quality Improvement Team.
Footnotes
Contributors AA, JP and SY: conceived the project idea and designed the project; approved the final submitted version. RL: from the South London and Maudsley Quality Improvement team gave advice from a methodology perspective. AA and JP: collected data. AA: analysed and interpreted the data and discussed with SY, JP and the whole Enhanced Recovery Team in monthly team meetings the projects progress;submitted the paper and is the guarantor. The article was drafted by AA with revisions and input from JP and SY.
Funding The authors have not declared a specific grant for this research from any funding agency in the public, commercial or not-for-profit sectors.
Competing interests JP has previously been employed by BMJ Quality.
Patient consent for publication Not required.
Provenance and peer review Not commissioned; externally peer reviewed.
Data availability statement Data are available upon request.