Article Text

Abstract
Background Long waiting times in accident and emergency (A&E) departments remain one of the largest barriers to the timely assessment of critically unwell patients. In order to reduce the burden on A&Es, some trusts have introduced ambulatory care areas (ACAs) which provide acute assessment for general practitioner referrals. However, ACAs are often based on already busy acute medical wards and the availability of clinical space for clerking patients means that these patients often face long waiting times too. A cheap and sustainable method to reducing waiting times is to evaluate current space utilisation with the view to making use of underutilised workspace. The aim of this quality improvement project was to improve accessibility to pre-existing clinical spaces, and in doing so, reduce waiting times in acute admissions.
Methods Data were collected retrospectively from electronic systems and used to establish a baseline wait time from arrival to having blood taken (primary outcome). Quality improvement methods were used to identify potential implementations to reduce waiting time, by increasing access to clinical space, with serial measurements of the primary outcome being used to monitor change.
Results Data were collected over 54 consecutive days. The median wait time increased by 55 min during the project period. However, this difference in waiting time was not deemed significant between the three PDSA cycles (p=0.419, p=0.270 and p=0.350, Mann-Whitney U). Run chart analysis confirmed no significant changes occurred.
Conclusion In acute services, one limiting factor to seeing patients quickly is room availability. Quality improvement projects, such as this, should consider facilitating better use of available space and creating new clinical workspaces. This offers the possibility of reducing waiting times for both staff and patients alike. We recommend future projects focus efforts on integration of their interventions to generate significant improvements.
- ambulatory care
- emergency department
- healthcare quality improvement
- lean management
- patient-centred care
This is an open access article distributed in accordance with the Creative Commons Attribution Non Commercial (CC BY-NC 4.0) license, which permits others to distribute, remix, adapt, build upon this work non-commercially, and license their derivative works on different terms, provided the original work is properly cited, appropriate credit is given, any changes made indicated, and the use is non-commercial. See: http://creativecommons.org/licenses/by-nc/4.0/.
Statistics from Altmetric.com
- ambulatory care
- emergency department
- healthcare quality improvement
- lean management
- patient-centred care
Problem
Waiting times in accident and emergency department (A&E) and in acute admissions are the highest they have been in 10 years.1 Despite the mandated standard of care in which all patients must be admitted, transferred or discharged within 4 hours, in the year 2016–2017, 11% of patients were kept waiting for over 4 hours.1 Our project was based in the hospital’s ambulatory care area (ACA), within the acute admissions ward. It receives referrals from general practice surgeries and patients stable enough to be seen outside of A&E. This project took place in a district general hospital in the South of England; the trust is comprised of two hospitals, each with a level 1 A&E, receiving a combined 138 000 visits per year.2 The local population mean age of 43.6 years is 10.66% higher than the national average.3 The British and Northern Irish ethnic group proportion of 92% is also higher than the national average of 80%.3
The aim of this project was to understand the reasons behind high patient waiting times on ACA and barriers to efficient patient flow. Long waiting times in acute services are multivariate in cause; while seasonal strain and staffing factors were identified as possible barriers to good patient flow, it was felt by the project team that changes to the infrastructure in ACA may provide a cost-effective solution. Our hard goal was to reduce the patient waiting time on ACA between arrival and bloods being taken from an average of 107 min to fewer than 90 min during a 2-month initial intervention period.
Background
Waiting times in A&E are often used as a performance measure for the National Health Service (NHS). Quality of referrals from the community, appropriate triaging by paramedic services, staffing levels in acute services and pressures on social services all impact waiting times in A&E. The 4-hour target was introduced in the year 2004; in 2017/2018, national performance against this measure was the worst it’s ever been, with only 76.8% of patients being assessed within 4 hours.4 The most recent year in which the standard was met annually on a national scale was 2013/2014.5 There is little data on waiting times in ambulatory care services, which were developed to provide fast-track streaming of patients from A&E and rapid review of urgent care patients not deemed to be emergency cases.6
The literature suggests that approaches focusing on streamlining patient flow are most effective in reducing waiting times.7–9 The split-flow approach to triage (where patients are triaged early and seen by the most appropriate specialty depending on the presenting complaint) has been shown to reduce total time spent in A&E, and in particular, time spent waiting to see a doctor.7 This method relies on a fast-tracked assessment and continuous flow of patients throughout the department. Another method—the streaming of minor injuries—has been shown to decrease waiting times for major injury patients.8
Combined with increased consultant staff levels, this type of streaming is hypothesised to increase flow by up to 50%.8 Some technological adjuncts have been shown to improve flow through A&E. For example, point-of-care testing has been used successfully in reducing overall waiting times, including the facilitation of rapid recognition of sepsis and faster discharge of stable patients.9
In addition to relieving pressures placed on A&E by stable (although unwell) patients, ACAs are structured to limit admissions. Developing measures to maintain the efficient flow of patients through ambulatory care is, therefore, vital.
Measurement
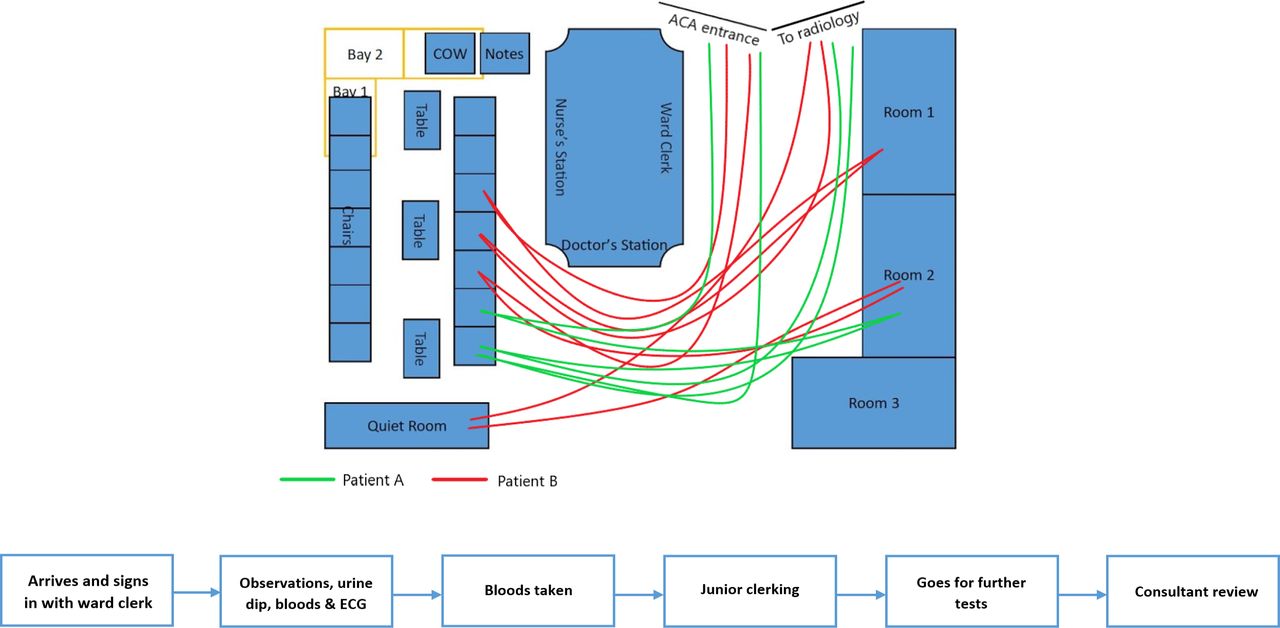
The patient journey was mapped from arrival in ACA to admittance/discharge using spaghetti diagrams (figure 1A) and a process map generated (figure 1B). A version of the process map was displayed on the wall in ACA for 7 days and staff were asked to annotate the map, identifying potential areas of ‘waste’ figure 1C. The time taken between check-in with the ward clerk and blood being taken was recorded and used as our primary outcome measure. This measure was chosen for its ability to be collected retrospectively and data were collected following a minimum of 7 days of observation, following each intervention over a 54-day period (15 days of baseline observation and 39 days of implementation cycles). Check-in time was collected from an electronic ‘whiteboard’ system, which the ward clerk completes in real-time. The time of venepuncture was gathered from the electronic laboratory reporting system. The difference between arrival and blood-taking was calculated and recorded as the primary outcome measure. The data were used to calculate a mean waiting time per day for both the baseline period and following the implementation of each intervention.

(A) Spaghetti diagram depicting the journey of two patients within ACA. (B) Process map depicting the typical patient journey in ambulatory care.
A baseline measurement of the outcome measure was calculated using data collected over a 15-day period, which ran continuously prior to the improvement cycles. Data were collected for patients who checked-in on the whiteboard system between 07:00 and 20:00; patients arriving outside these hours or those whose bloods were taken elsewhere (typically the emergency department) were excluded.
Design
When designing interventions, the project team strongly incorporated input from both staff and patients.
When informally surveying members of staff, the project team learnt the key factor contributing to waiting time was room availability. We displayed a process map (figure 1C) in the multidisciplinary team handover room, inviting staff to contribute factors they felt impeded patient flow.
The same three rooms were used by healthcare assistants and nurses for recording observations and for taking blood, as for clerking by junior doctors and review by seniors.
A root cause analysis facilitated an in-depth exploration of the space utilisation in this department, highlighting existing clinical spaces in the waiting area that were not being utilised. Four curtained bays were identified in the waiting room, which were occupied by tables, chairs and patient note trolleys (figure 2A), preventing the curtains from being drawn to provide a useable clinical space. Our interventions focused on facilitating the use of these curtained bays in order to increase the number of available treatment spaces, freeing up the use of the more private rooms for medical clerking and examination (figure 2B).

(A) Depicting waiting room layout prior to interventions. Key: COW—computer on wheels. (B) Depicting intended changes to waiting room layout to facilitate access to curtained bays. Key: COW—computer on wheels.
The project team felt that if these bays were made freely accessible, they could be used by staff for taking observations and blood, as this would not require the discussion of personal, confidential information within the waiting area. The project team gained the ward manager’s support for this endeavour, and spoke to staff working in ACA to verbally encourage the use of the newly available spaces.
We expected the interventions to work as they addressed the primary problem identified by staff, involved no extra work on behalf of the staff and would reduce the time staff were waiting to access clinical space, making patient flow more streamlined and efficient.
Additionally, in making changes to the waiting room infrastructure, as opposed to procedural changes, we expected our changes to remain in place, facilitating a long-term improvement.
Patient and public involvement
Although the hard goal of this quality improvement project was to reduce waiting times from arrival to having bloods taken, a driving factor was to improve the patient experience. Patients were approached by the project authors in the waiting room and surveyed on their opinions on the layout, comfort and accessibility of the waiting area (online supplementary appendix 1). Ten patient responses were considered in our choice of interventions.
Supplemental material
Overall, the patients were very happy with their experience of care in ACA, with a mean satisfaction rating of 8.3 out of 10. We learnt that patients were happily waiting to be seen, as long as they were comfortable, had been offered pain relief, had adequate sources of distraction and importantly, felt that they had not been forgotten by staff. Patients commonly reported the layout of the furniture which made it tricky to access the waiting chairs in the centre of the room, particularly for wheelchair users. They also reported that the tables in the waiting area were redundant, serving only to impede mobility. Thus, our intervention (remove tables and increase spacing between the centre chairs) served the dual purpose of improving patient mobility and usability of clinical bays.
Strategy
Our SMART goal was to increase space availability in the ACA, such that patients would wait for fewer than 90 min to have their blood taken. We undertook three PDSA cycles, with 9, 14 and 16 days of observation, respectively. At the end of each cycle, data were collected to calculate the daily mean waiting times.
PDSA cycle 1: Our initial intervention was to rearrange the waiting room furniture, rendering the four curtained bays accessible for use (figure 2A,B). We did this in the early morning before any patients had arrived. This did not result in a significant reduction in waiting time. Informal feedback from ward staff indicated that they preferred the old layout and had not been using the curtained bays for blood taking or observation making despite being able to access curtains in between the chairs. On checking the layout, we learnt that staff were returning furniture to previous positions.
PDSA cycle 2: In order to encourage the use of the bays, we created a mobile blood trolley for use within the curtained bays. This was stored in a prominent position in the waiting area, next to the nurses station. Additionally, when our clinical commitments allowed, we attended ACA to explain the changes to staff working in the department. This also did not result in a significant change in waiting time. On periodic checking of the trolley, when other commitments allowed, we observed staff moving the blood trolley into the clinical rooms or taking equipment from the mobile blood trolley to use in the clinical rooms. We suspected staff were still not using the bays, as demonstrated by the dismantling of the blood trolley to be used in the clinical rooms. This highlighted that staff were unaware of the purpose of the blood trolley, despite our efforts.
PDSA cycle 3: Our final cycle focused on staff engagement and education. We designed attention-grabbing posters and displayed them prominently on the curtains and the blood trolley, prompting staff to use the bays when no rooms were available. This too had no effect on waiting time. This intervention would remain in situ once we had left the team.
Results
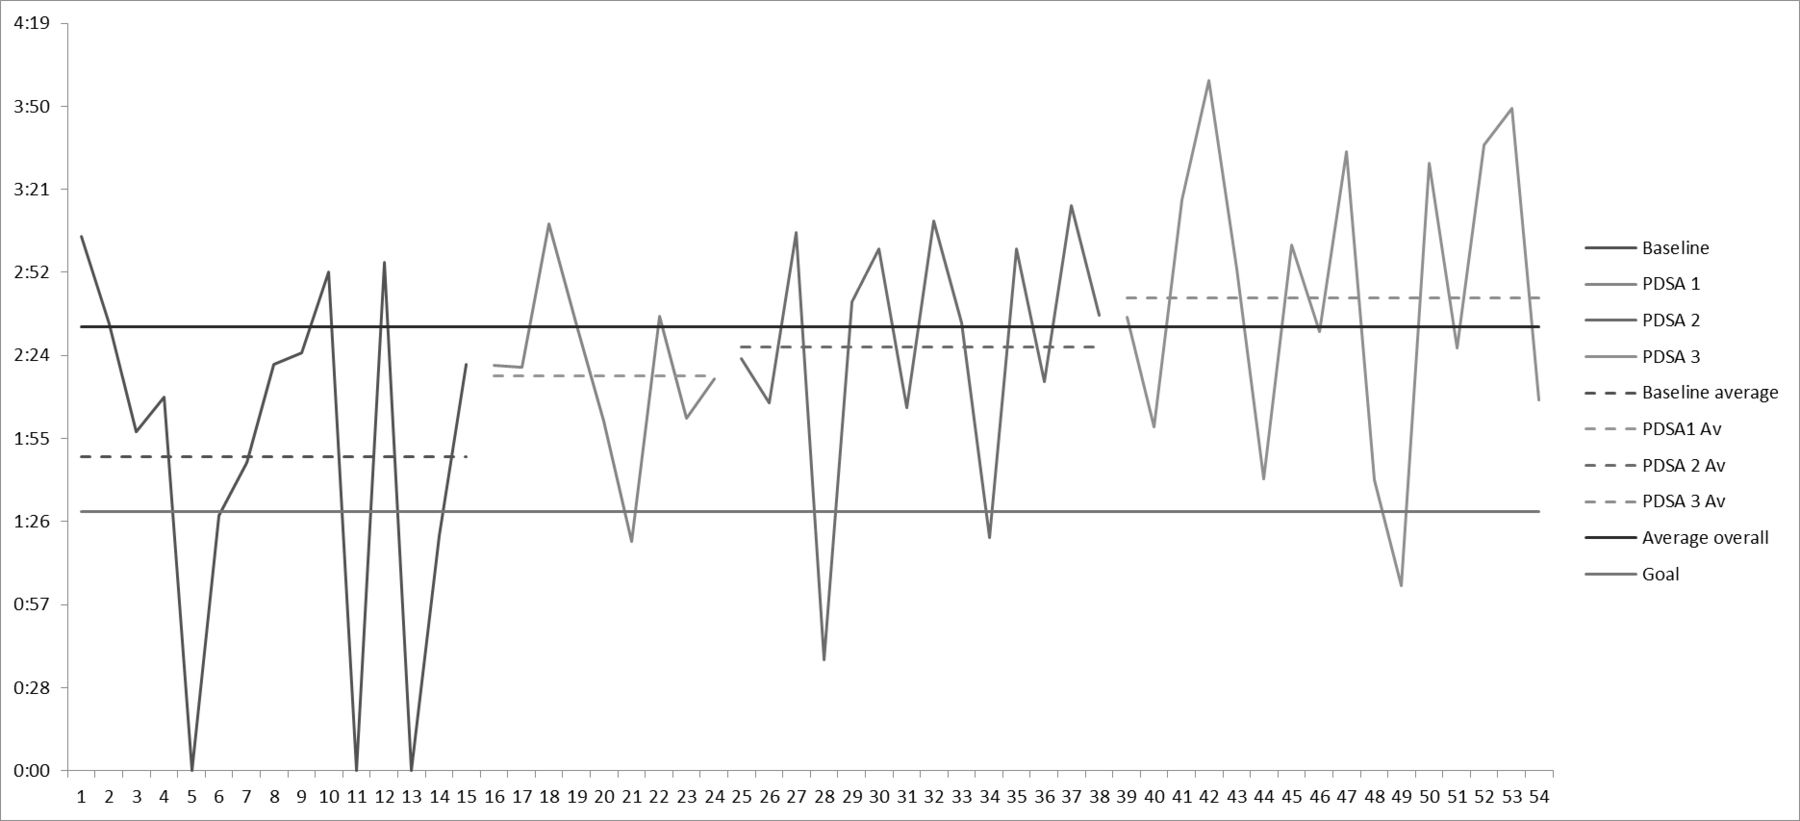
The primary outcome measure was the time (in minutes) waited by patients between checking in on the ward and having their bloods taken. Data were collected over 54 consecutive days; the baseline measurement revealed a median wait time of 107 min.
The median wait time per PDSA cycle showed a non-significant increase across the three cycles from 137 min in PDSA cycle 1 (p=0.419) to 127 min in PDSA cycle 2 (p=0.270) and 164 min in PDSA cycle 3 (p=0.350, Mann-Whitney U) (figure 3). A total of 25 runs were observed over the 39 observations on run chart analysis, confirming no significant change (non-significant range 14–26).
Run chart depicting waiting times at baseline, PDSA 1, 2 and 3. Av, average.
We attempted to control for the total number of patients attending ACA each day by dividing the median wait time by the total number of patients seen. However, there remained no significant change in the adjusted wait time across the three cycles from a baseline of 2.12 min/person to 2.33 min/person in PDSA cycle 1 (p=0.968); 2.75 min/person in PDSA cycle 2 (p=0.289) and 2.36 min/person in PDSA cycle 3 (p=0.226, Mann-Whitney U) with a non-significant number of runs (18 runs).
Lessons and limitations
While undertaking this improvement project, a number of efforts were made to engage the departmental team. This included attending safety huddles, presenting findings and actions at managerial meetings, inviting collaboration from staff and explaining our interventions to those working on the frontline. Despite these efforts, we found it challenging to encourage uptake of our interventions. This may partly be due to the requirement for procedural change by staff involved in service delivery, in order to lead to improvement. The main limitations to us achieving behavioural change were, first, the lack of a senior clinician to aid our integration into the team, to give us the autonomy to make changes and to support and champion our improvements. We felt that this was particularly important given our status as temporary students on the ward. This issue was felt to be the main barrier to intervention uptake, and thus any improvement in waiting times during our project and sustained change following its completion. While we succeeded in garnering the support of the managerial staff, having a junior clinical champion who was more permanently involved in service delivery in ACA, in addition to a senior clinical champion, would have been hugely beneficial. One way to address this in future projects would be to design the project with a clinical champion as a project member from the start. This could be the departmental lead for quality improvement, or a junior allocated the project as part of their mandatory QI participation. This reciprocal partnership would be mutually beneficial as it would empower students to affect change and provide support for juniors completing QI projects, who are already hugely stretched with clinical workload and service delivery.
Second, this quality improvement project was undertaken as part of the penultimate year medical school curriculum. As part of which, we were allocated one morning a week to complete our quality improvement project alongside additional clinical work. This made it challenging to engage with staff regarding the changes due to daily turnover and rota scheduling.
Another reason for the increasing waiting time during the project period may have been a seasonal strain. This project took place over the winter months (January and February) when demands on acute services are highest. There may have been more referrals from A&E due to increased pressure on the system. These patients would not have been captured in our data collection as we only considered those who had bloods taken while on ACA but would have had a knock-on effect on waiting times due to increased clinical demands on staff. Thus, it may have been prudent to control for time of year and for patient volume. Additionally, it would have been helpful to also collect data on a balancing measure, such as the time waited to see a junior doctor. This would ensure that any improvement we made during the first half of the patient flow process was carried through for the entirety of their stay.
An additional limitation of our study design was that of outcome measurement and controlled factors. In order to be measured accurately and fit within the remit of our project, any outcome measure must be collectible retrospectively and via electronic data systems. It was, therefore, not possible to collect data on the uptake of the new resources that we had made available (portioned areas for blood drawing), as this would have involved the project authors recording the usage of the curtained areas on a daily basis for the duration of the project period, or imploring the staff to do this. Given the barriers we faced with implementing our changes, relying on staff to accurately self-record their usage of the new resources was felt to be infeasible.
A limitation of our attempt to control for the number of patients seen is using the total number of patients seen in ACA. We felt this would best represent the demand for rooms. However, not all patients have their bloods taken on ACA. Therefore, some patients’ wait times are not captured if the time from admission to blood taking is used as a proxy for wait time.
Significance for local department
While our project unfortunately did not affect any change, we believe that the interventions have the potential to make significant improvements to patient flow on ACA. In addition, these improvements should have a positive impact on the patient experience based on the qualitative data we collected from patients at the start of the project. These implementations, however, need to come from within the local team for them to be adopted—and maintained—by the staff. The key learning point from this exercise was that staff engagement is the hardest, yet most vital, aspect of any improvement venture.
Significance for the NHS
This project is focused on a single department and tailored specifically to the demands of a local system. While we believe that for quality improvement projects to be most impactful, they must be tailored to the local setting; the principles from this project can be applied to any hospital. For example, surveying patients to acquire their thoughts on how to make their stay more comfortable can be carried out nationwide to increase patient satisfaction. Furthermore, an independent perspective is valuable for identifying solutions, which may be overlooked by staff engaged in service delivery.
Sustainability
This project required one-off changes to be made to the layout on ACA. Once these changes have been made, and as long as they stay in place, any improvements should be permanent. While the challenges outlined above with regard to engaging staff impedes change in the first place, it also affects the longevity of the project. With high staff turnover, procedural and operational changes may be lost and with them, any progress made. We designed a further poster to be left in the department once the project was completed; this was a reminder to top up the blood trolley daily. Ideally, developing a standard operating procedure that describes the use of the mobile blood trolley and the curtained bays would also help to promote sustainability. However, we were unable to implement this within the scope of our project.
Conclusion
Waiting time in acute services is at an all-time high, with services under pressure to address this problem. Research shows the most effective interventions to be ones, which focus on improving the flow of patients through acute medical departments. Our project looked specifically at whether small-scale and cost-effective interventions based on increasing access to pre-existent clinical spaces could improve patient flow. We were able to identify barriers to better patient flow and approach the local team with our ideas. By removing these barriers, the project team was able to facilitate improved access to clinical space. However, in this case, our interventions did not result in a reduction of waiting time.
In order to achieve this, more work must be done to engage the local team, including the appointment of local champions for change and incentives to use the new spaces. The outcome measure used was felt to be appropriate; however, a balancing measure would have proven helpful, as would controlling for confounding factors. Sustainability is readily achieved with the aid of an on-site clinical champion given that the interventions are one-off changes to the outlay of the department. We believe that this project is reproducible at other sites, but should be tailored to individual departments’ structural layout.
Acknowledgments
The project team would like to thank Sarah Atkinson and Adrian Richardson for their advice and support regarding quality improvement methodology before and during the project window. In addition, we would like to thank Karin Fair and the rest of the clinical team working on ACA who supported our improvements and whose insights into the daily work practice were invaluable in designing our interventions.
Footnotes
Contributors AvG and CMB contributed equally to the planning, conduct and reporting of the work described in this article.
Funding The authors have not declared a specific grant for this research from any funding agency in the public, commercial or not-for-profit sectors.
Competing interests None declared.
Patient consent for publication Not required.
Provenance and peer review Not commissioned; externally peer reviewed.