Article Text

Abstract
Background Good communication with families improves safety and drives patient/family satisfaction. Rapid cycle improvement for the communication is difficult in our emergency department as current mailed surveys provide little and delayed data. We had two aims in this quality improvement study: (1) to increase proportion of families responding ‘always’ when asked if they received consistent communication from nurses and providers from 52% to 80% and (2) increase families reporting their visit as excellent, reflecting higher family satisfaction.
Methods Key drivers of the consistent communication were determined using the model for improvement. Interventions focused on interprovider communication and parental knowledge of communication processes. Eight Plan-Do-Study-Act ramps were conducted focusing on each of the key drivers, with 1–10 cycles per ramp. A five-question in-person survey was conducted at the time of disposition by the research assistants. Process and outcome measures were tracked on the statistical process control charts.
Results Mean percentage of families who reported always receiving consistent communication increased from 52% to 70% over 12 months. Additionally, families reporting their visit as ‘excellent’ increased from 62.5% to 75%. Using in-person surveys,weekly responses increased from 3 to 22.
Conclusions Iterative processes to improve interprovider communication and inform families about their care led to improvement in families’ perceived communication consistency. Improved communication can lead to higher family satisfaction, most affecting those previously feeling neutral about their visit. In-person surveys can inform the real-time improvement efforts.
- emergency department
- patient satisfaction
- communication
- paediatrics
- quality improvement
This is an open access article distributed in accordance with the Creative Commons Attribution Non Commercial (CC BY-NC 4.0) license, which permits others to distribute, remix, adapt, build upon this work non-commercially, and license their derivative works on different terms, provided the original work is properly cited, appropriate credit is given, any changes made indicated, and the use is non-commercial. See: http://creativecommons.org/licenses/by-nc/4.0/.
Statistics from Altmetric.com
Background
Patient satisfaction is increasingly a focus in healthcare and can affect patient safety, as it has been associated with better patient treatment adherence.1 2 Assessment of patient satisfaction is most commonly assessed using longer, validated and standardised surveys.1 These surveys are useful for benchmarking given their widespread use, but are of questionable utility for those looking to drive rapid cycle improvement in the clinical setting, because the responses are delayed and tailored to either inpatient or outpatient settings.3 4 When used for benchmarking, the hospital results from these surveys are compared within several groups, such as similar patient volume or academic versus private hospital. In doing so, this suggests that hospitals of similar volume or type affect a patient’s experience in a similar manner. Perhaps for these reasons, very few studies have attempted to use these satisfaction survey tools to direct their improvement efforts.5 Studies focused on satisfaction often look at patients who are highly satisfied with their care, and review what aspects of care they rated highly.6 7 However, this method has demonstrated that drivers of satisfaction vary between populations.5 6,8–12 As an example, Otani et al noted that in a hospital care setting, being treated with respect by doctors and nurses was most highly correlated with overall satisfaction, while Nguyen et al found that older age was a strong factor predicting higher satisfaction. Additionally, few studies have been conducted in an emergency department (ED) setting, and even less in the paediatric ED, where much of the patient encounter involves family members’ input.7 13,14
While inconsistencies exist, one strong predictor of patient satisfaction is good communication between the providers and patients.6 7 12,14 Communication between team members and between care providers and their patients varies greatly depending on many factors including volume, staffing and physical layout of the environment; in an ED setting, these factors can quickly change due to the arrival of unexpected, emergent patients requiring significant time and resources. This makes the implementation of interventions to improve communication tested in other care settings difficult without observation of one’s own processes and setting. In review, our standardised survey results for the past year showed that in our patient population, consistent communication between families and providers rated poorly, and was highly correlated with rating of overall satisfaction.
Prior to beginning our project, rating of family satisfaction was assessed using a 40 question, validated, standardised survey that was mailed to an average of 15% of families discharged and resulted in feedback from an average of three families discharged from the ED per week, with responses typically received 8–12 weeks after their visit. Surveys excluded admitted patients, a group of patients who often use the most ED resources. This delayed and sparse feedback prevented us from accurately assessing the benefit of improvement efforts aimed at improving communication and limited our ability to do small scale, rapid cycle testing.
Given that consistent communication was associated with higher family rating of satisfaction, we theorised that if we improved the consistency of communication between all care providers, then families would receive consistent messages, so that they would better understand their child’s illness and plan of care, and, in turn, be more satisfied with their visit. To drive change, we created an in-person survey with questions tailored to specific interventions to increase the number and timeliness of responses, which we theorised would facilitate rapid assessment of small-scale tests of change around improved communication consistency and family satisfaction. Our aims in this quality improvement (QI) study were to: (1) to increase the proportion of families responding ‘always’ when asked if they received consistent communication from nurses and providers from 52% to 80% and (2) increase families reporting their visit as excellent, reflecting higher family satisfaction.
Methods
Context
Our improvement project was carried out in an urban, tertiary paediatric ED of an academic centre with a census of 65 000 patients annually. Patient population is approximately 56% Medicaid health maintenance organization (HMO), 27% commercial insurance and 15% Medicaid, with primary racial demographics being 45% African-American and 42% Caucasian. Primary patient care teams most commonly consist of an attending physician and an advanced practice provider (physician assistant or nurse practitioner) or trainee (resident or medical student) and a nurse. Certain lower acuity patients can be seen solely by an advanced practice provider. In our centre, use of the term provider relates specifically to a physician or advanced practice provider. Additionally, child life specialists were in the ED to help with patients 12 hours daily. Additional family experience projects included an interactive wall in the waiting area for family members of patients, though this was not actually set up until after the project transitioned into sustainment. During the project, a 20-person, multidisciplinary workgroup around patient experience met bimonthly to review the National Research Corporation (NRC) Picker’s data, which is a standard administered patient survey that assesses patient and family experience with a clinical visit. These data included any patients discharged who responded to the mailed paper survey. This method of mailed survey distribution with poor response rates made it particularly difficult to get data reliably and in a timely manner. To acquire more data reliably, our team opted to use an in-person survey. Our in-person survey included both patients planned to be admitted or discharged, and excluded patients without their primary caregiver present, non-English-speaking patients and patients seen between 00:00 and 08:00 hours as research assistants were not present in the ED during these hours.
Interventions
Due to down trending family rating of consistent communication between nurses and providers, the 20-person workgroup identified a physician lead to develop a project team to address this issue. A multidisciplinary team involving physician leaders, a physician trainee, nurses and a parent representative. Using the NRC data reporting web tool, a priority matrix confirmed that communication consistency was rated poorly and was highly correlated with overall family satisfaction. Our team then developed a failure mode effect analysis (FMEA) around a patient and family’s process through their visit, focusing on different points of communication (see online supplementary appendix 1).
Supplemental material
After identifying possible breakdowns in communication, we chose interventions aimed at preventing these failures based off previously studied interventions and local expert opinion on what was deemed feasible. Performing the FMEA helped our team develop our key driver diagram (figure 1).

Key Driver Diagram—shows overall aim of improving satisfaction, with specific aim regarding improving communication as described. The second column is the key drivers, blue represents drivers focused on provider communication, red represents drivers focused on family communication. The third column shows specific interventions affecting a given key driver. LOR, level of reliability.
Drivers were divided into two groups: the first four drivers were directed at decreasing variability in the communication process between providers and nurses and the second four drivers were directed at decreasing variability by which the family received messages from all provider team members. The model for improvement was used to drive change, with tests focusing on interprovider communication first, then on communication with families. Regular updates were given via monthly department meeting presentations, monthly updates in the department newsletter, statistical process control (SPC) charts posted in high-visibility areas in the ED, and monthly emails to learners that rotated through the ED.
Study of the intervention
Our team developed an in-person paper survey, designed to be administered at the time of decision to admit or discharge, and carried out several Plan-Do-Study-Act (PDSA) cycles assessing the understandability of questions, time to complete survey and ease of administration. Using qualitative questions to assess understanding of survey questions by family members, a ramp of three PDSA cycles was performed leading to the final version consisting of five questions. Two questions focused on our outcome measures, using a five-point Likert scale assessing families’ rating of their satisfaction with the visit and assessing the team’s communication consistency. These questions were written by the study team with the intention to reflect similar questions as assessed within the NRC Picker survey. Three additional questions were used that changed throughout the study period to assess a specific intervention’s outcome or balancing measures. Research assistants documented by check box on surveys whether whiteboard was observed to be used when surveying families (see online supplementary appendix 2).
Supplemental material
Research assistants administered the survey at the time of decision to admit or discharge. Initial sampling was performed by creating a list of the 22 ED rooms, in random order. The research assistant would progress down the list, and survey a family from the next room on the list until a patient from each room had been surveyed. This, however, provided fewer responses than desired and sampling process was adjusted after the 12th week. The second sampling process consisted of a monthly schedule, with 2-hour blocks, representing different times of day (morning, afternoon or evening), all 7 days of the week. During the 2-hour block on a given day, any patient being admitted or discharged was eligible to be surveyed.
Measures and analysis
Process measures tracked included: documentation of triage chief complaint description, provider comments in the electronic medical record, per cent of providers given phones and whiteboard use. Whiteboard use required that an in room whiteboard have providers names and roles written and next steps in care identified. Balancing measures included patient call light usage as well as provider and nursing satisfaction with new processes. Process measures were chosen to assess the adequacy of which a specific intervention was being performed to help better assess the interventions effect on the outcome measure. Once improvement in the process measure was noted using standard SPC chart rules, it was compared with the outcome measure charts to assess for improvement in association with the given intervention.
Outcome measures were tracked on SPC charts throughout the course of the study with data tracked weekly. Communication consistency was assessing whether or not a family felt they received the same messaging regarding their child’s condition and next steps in care by the nurses and providers they interacted with throughout their ED visit. Along with collecting in person survey responses, the validated, NRC Picker (standard administered experience survey) responses were collected for comparison. Family knowledge of their team members and next steps in care were outcome measures specific to whiteboard use that were additionally tracked while testing this intervention. During certain early test cycles in a ramp, both families with and without the intervention were surveyed to help with comparison. Shifts in centrelines were in response to special cause variation.
Additionally, a net promoter score was calculated by subtracting the number of good, poor or very poor scores (demoters) from the number of excellent scores for each week (promoters), then divided this by the total survey responses in that given week, resulting in the net per cent of families actively promoting their care experience.15 We grouped the bottom three scores into one because very few families rated their visit as poor or very poor.
Results
Family rating of communication consistency and satisfaction
Interventions tested to drive improvement in communication consistency were tracked on SPC charts for 12 months. Interventions tested are listed in the below table, along with the reasoning the given intervention was chosen, what was trialled and reasoning for abortion or adoption(table 1)
Interventions tested
Our specific aim at project onset focused on improving the number of families responding ‘always’ when asked if they received consistent communication between nurses and providers from 52% at baseline to 80% within 12 months. As shown in figure 2, we reached 70% communication consistency within 12 months. Data are portrayed weekly with variation in control limits secondary to varying number of survey responses within a given data point.
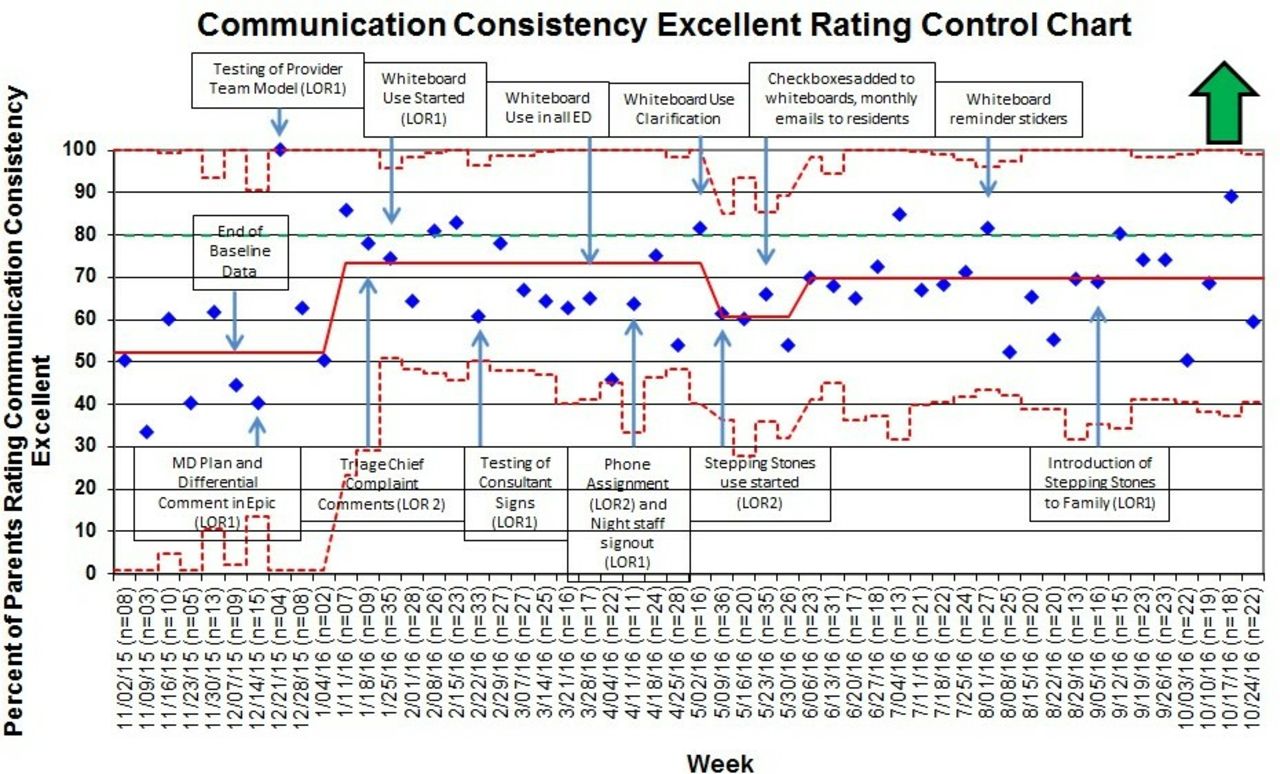
P-chart showing average percentage of families weekly rating communication consistency as ‘always’ on a five-point Likert scale (blue points). Solid red line is the mean rating. Dotted red lines are upper and lower control limits (3 SD from mean). The green dotted line is goal line. Boxes show interventions tested. ED, emergency department.
To better correlate improvement in our process with improvement in our outcome measure of communication consistency, improvement in process adherence and intervention specific outcome measures were also tracked (see online supplementary appendix 3).
Supplemental material
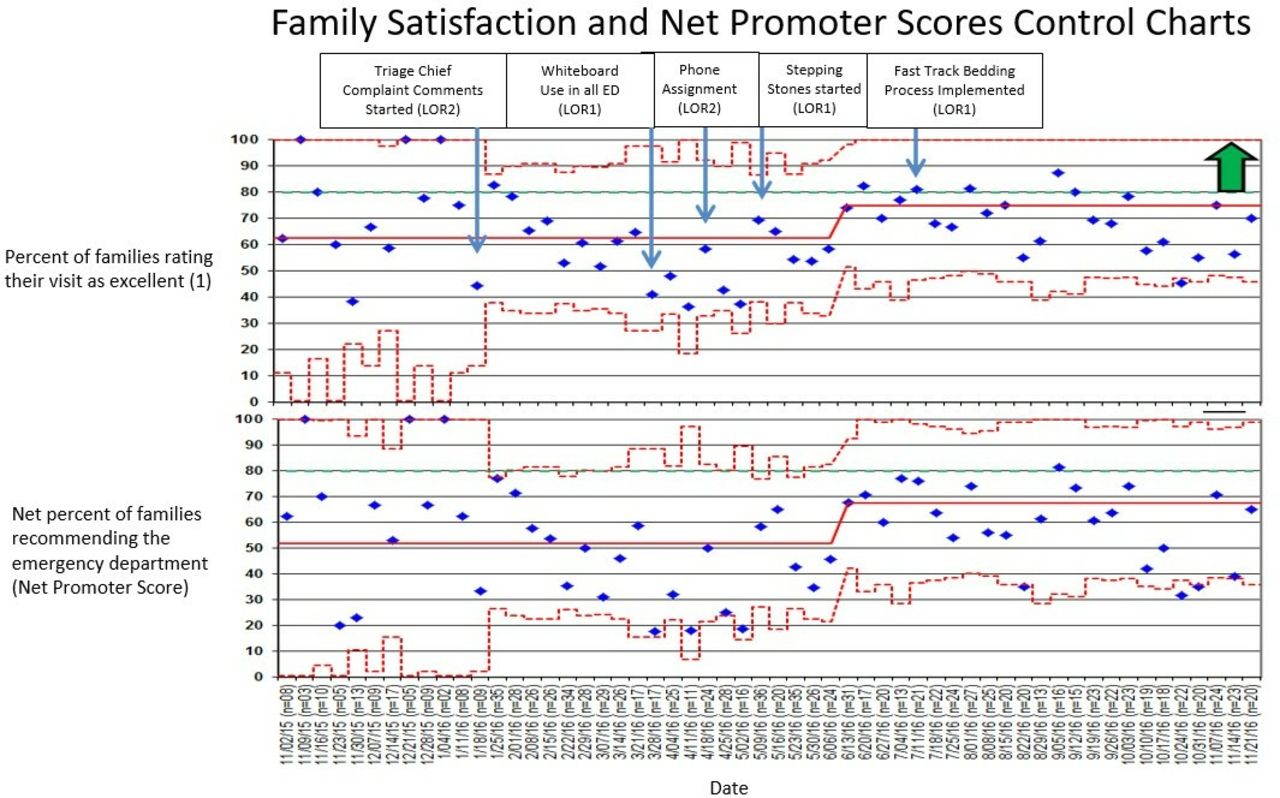
Given the association between improved communication with families and improved family satisfaction, our second aim was to improve family rating of satisfaction with paediatric ED visit. The per cent of families rating their satisfaction with their visit as excellent increased from 62.5% at baseline to 75% and the net promoter score increased from 52% at baseline to 67% at time of completion of all planned interventions (figure 3). The increase in families rating their visit as excellent was paired with a decrease in families rating their visit as very good, and no change in families rating their visit as good, poor or very poor.

P-charts showing per cent of families rating visit as ‘excellent’ on five-point Likert (top) and net promoter score (bottom). Centre red lines are the means. Dotted red lines are upper and lower control limits (3 SD from mean). Green dotted line is the goal line. Boxes show interventions when test was performed.
To compare interventions tested to improved family satisfaction, we used subgroups during early test cycles. Stepping Stones, a visual guide displaying the process of an ED visit, tests performed and roles of employees a family may meet, was an example of this (see online supplementary appendix 4). On the first five test days, half of the families were given the Stepping Stones guide while half were not. This allowed for families being surveyed at disposition to have otherwise experienced similar patient volume, wait times, nurses and providers. After 5 days of testing, those that received a Stepping Stones guide on arrival rated their satisfaction with their visit more positively and the intervention was ramped up in scale (see online supplementary appendix 5).
Supplemental material
Supplemental material
Increasing family feedback
Regarding improvement of survey responses, at study onset, we averaged three responses weekly from the NRC Picker survey. Our goal with use of in person surveys was to increase our response rate to 20 responses weekly. Using in-person surveys and our sampling protocol, we increased average survey response rate from 3 weekly using the mailed surveys to an average of 22 weekly on in person surveys. Additionally, using the five question in-person surveys, we had a 100% response rate.
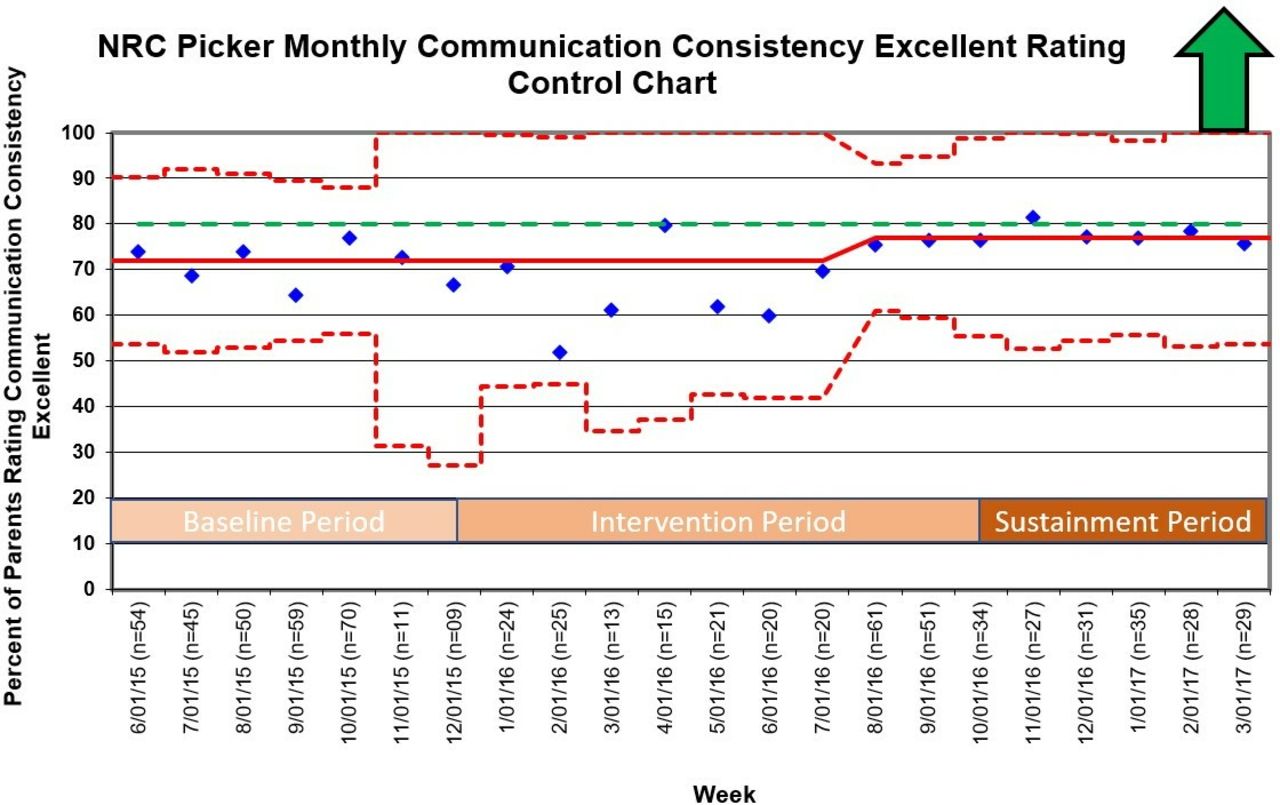
During the study period, the NRC Picker survey was continued to be distributed by the hospital as it was at the onset of the study to patients discharged from the ED. A related question on the NRC Picker survey assessing communication consistency between care providers showed an increase in excellent rating from 72% at baseline to 78% as study transitioned into sustainment (figure 4).
P-chart showing families rating communication consistency between nurses and providers as ‘excellent’ (9 or 10 on 10-point Likert). Centre red line is the mean. Dotted red lines are the upper and lower control limits (3 SD from mean). Green dotted line is the goal line. NRC, National Research Corporation.
Discussion
It has been previously noted that patients who rated a care team’s communication as excellent, tended to rate their experience positively (6, 7, 12 and 14). No studies attempted to prospectively test interventions to improve team communication with a global aim to improve family satisfaction. Additionally, the use of the model for improvement to improve communication consistency in a paediatric ED has not been published. In our QI study, we were able to improve families’ perception of consistent communication between care providers, and subsequently, show a significant improvement in overall family satisfaction with their visit. It is particularly interesting to note that the scores of the validated NRC Picker survey showed a significant improvement at the same time as the in-person survey.
One of the biggest challenges of this project was gaining buy-in. Frequent and rapid feedback emphasising improvements in process measures, and highlighting positive balancing measures was especially helpful. For example, staff felt writing their names on the whiteboard and identifying next steps in the patient’s care would take additional time. As we tracked improvement in whiteboard use by providers, we tracked the families’ knowledge of team members and knowledge of next steps in child’s care. On reaching 65% use of whiteboards, we saw a shift in these two measures, and shortly after the shift in these measures, we noted a shift in communication consistency. As a balancing measure, we tracked call-light usage by the families. It was noted that when staff wrote the next steps in care on the patient’s whiteboard, there was an average of 0.3 call-lights pushed per hour, compared with an average of 2.1 call-lights pushed per hour when not written. With response to a call-light requiring more time and effort on behalf of a nurse than updating the next step in care on the whiteboard, nursing staff quickly increased their use of whiteboards.
Regarding to family satisfaction, with improvement in family rating of satisfaction, there was an increase in the net promoter score. The greatest promoter effect was for families who would had previously felt neutral about their visit. This is intriguing, as it suggests that more families left the department promoting the hospital and the experience they had, potentially acting as an area of growth and increased revenue via patient driven referrals to our hospital system.
We also showed using a short, in-person survey can be useful to help assess small-scale tests of change, and help drive improvements that can impact responses provided on larger validated surveys. With a hindrance of these larger validated surveys being data lag time, the question of whether a short in-person survey could act as an adjunct to this is an important one. Given that we found the validated survey showed improvement at the same time as the in-person survey, our study suggests that an in-person rapid survey can allow for the rapid cycles needed for improvement and supplement these larger survey tools. Additionally, with rapid patient turnover, trainees, physicians, nurses, consultants and ancillary staff that a family may meet during their ED visit, our experience emphasises the importance of rapid feedback on a family’s experience for improvement. Lastly, cost of this improvement project totalled less than US$1000.
Limitations
It is important to note that surveying at time of decision to admit or discharge requires an additional individual or the nurse to conduct the survey. Additionally, though this process can help quickly assess and drive change, patients may not be as honest without appropriate time to reflect on the visit, or answer quickly so to not hold up their ED departure. The in-person survey’s lack of validation also limits the ability to compare directly across institutions. For this project, the in-person survey was given to both families being admitted and discharged to assess the effect of efforts on all patients, excluding the time periods between 00:00 and 08:00 hours while the NRC Picker survey tool only surveys families discharged from the ED and includes all times of day which could contribute to variation in experience.
Summary
We found that using the model for improvement and iterative processes to drive change, one can improve communication consistency with families and in turn improve family rating of satisfaction with their ED visit. Consistent use of personalised communication devices to communicate with team members, use of comments to explain a patient’s chief complaint, use of in room whiteboards to update care plans and use of a guide to help explain a child’s care process to the family, were the most useful interventions contributing to improved communication consistency and satisfaction. Additionally, short, in-person surveys help quickly assess and drive improvement, with the general association between the in-person surveys and larger validated surveys showing that the validated surveys can be used to follow sustainment.
Acknowledgments
Jessica Hughes, RN and Jane Mathews, RN for their contribution to the project development and communications with nursing staff. Marlene Melzer-Lange, MD for her executive sponsorship of the project.
References
Footnotes
Contributors NAK assisted in conceptualising and designing the study, data analyses and interpretation, drafted the manuscript, and approved the final manuscript as submitted. AKM and CCF assisted in conceptualising and designing the study, reviewed the data analysis and interpretation, reviewed and revised the manuscript, and approved the final manuscript as submitted.
Funding The authors have not declared a specific grant for this research from any funding agency in the public, commercial or not-for-profit sectors.
Competing interests None declared.
Patient consent for publication Not required.
Ethics approval This project was reviewed by the Medical College of Wisconsin’s Institutional Review Board. It was deemed a QI study, thus exempt and not human subject research. No other financial or ethical conflicts of interest were noted.
Provenance and peer review Not commissioned; externally peer reviewed.