Article Text

Abstract
Intravenous fluids are an essential component of patient care, but a 2013 National Institute for Health and Care Excellence (NICE) guideline noted that inappropriate prescribing or administration may lead to actual or potential patient harm in up to 20% of patients.1 This project aimed to improve prescribing documentation and communication between nurses and doctors regarding intravenous fluid management. This was done through the introduction of a fluid chart, in combination with teaching on appropriate fluid management. It was initiated within the medical department of Cecelia Makiwane Hospital in East London, South Africa. 309 patients were included and data were analysed over a 6-month period. The outcome measures were the standards of intravenous fluid prescribing set by the NICE guidelines. The process measure was the use of the new chart. Baseline data highlighted that there was no standardised location for fluid prescriptions within the bedside notes. Following the intervention, 81% of fluid prescriptions were on a fluid chart. The percentage of fluid scripts with a 24-hour fluid prescription, a recorded indication and recorded input increased after the intervention. Seventy six per cent of patients received more than 50% of the fluids prescribed following the intervention compared with 22% at baseline. These results indicated an increase in the doctor’s awareness of appropriate fluid prescribing and an improvement in the communication between doctors and nurses regarding the patient’s fluid management. The engagement of local stakeholders and staff was fundamental to the success of the project and allowed for this change in practice. Fluid management is a vital part of care in many specialties; therefore, a toolkit has been created to allow similar quality improvement projects to be implemented across other hospitals around the Eastern Cape.
- quality improvement
- patient safety
- communication
This is an open access article distributed in accordance with the Creative Commons Attribution Non Commercial (CC BY-NC 4.0) license, which permits others to distribute, remix, adapt, build upon this work non-commercially, and license their derivative works on different terms, provided the original work is properly cited, appropriate credit is given, any changes made indicated, and the use is non-commercial. See: http://creativecommons.org/licenses/by-nc/4.0/.
Statistics from Altmetric.com
Problem
Correct administration of intravenous fluid is essential for resuscitation, maintenance and replacement of fluid losses. Inaccurate prescribing of fluids can lead to significant patient harm.1
The main aim of the project was to improve intravenous fluid prescription and administration for hospital inpatients on the medical wards at Cecilia Makiwane Hospital within a 6-month period. A new fluid and output chart were introduced, and training on the chart’s use was linked to teaching on the importance of appropriate fluid management.
The Improving Global Health (IGH) through Leadership Development programme is working in partnership with the Eastern Cape Department of Health to develop projects to improve local healthcare.
This project ran in a 155-bed internal medicine department at Cecelia Makiwane Hospital (CMH) in Mdantsane, Eastern Cape, South Africa. The Eastern Cape has a high burden of HIV and tuberculosis.2 At presentation, patients are often dehydrated due to poor intake associated with severe illness, gastroenteritis and accelerated insensible loss due to high ambient temperatures. Inadequate correction of dehydration was considered by local clinical leaders to be a significant contributor to both morbidity and mortality. Doctors at CMH expressed concern that prescribed fluid was not reliably administered while nurses commented that prescriptions were often incomplete or unclear.
Background
In 2013, National Institute for Health and Care Excellence (NICE) released a new intravenous fluid prescribing guideline following reports that postulated that up to 20% of patients receiving intravenous fluids suffer adverse events.1 There is a lack of similar studies untaken within South Africa. Following the National Confidential Enquiry into Perioperative Deaths report in 1999, NICE recommended that fluid prescription should be given the same status as medication prescribing: a fluid prescription should detail the type of fluid, rate and total volume. The fluid management plan should be reviewed daily, and a 24-hours prescription should be present.1
It has been observed that intravenous fluid prescription and fluid balance documentation is often poorly performed,3 which can then impair clinical decision making.
There was no standardised location for prescribing fluids for patients at CMH, and sometimes fluids were administered by the nurses without any prescription.
Measurement
Baseline data were collected over 3 weeks to assess the quality of intravenous fluid prescriptions. Information from 45 medical patients on intravenous fluids was included. The main findings were as follows: there was no standardised location for fluid prescriptions, only 50% of fluid scripts had a prescriber’s signature and 33% had a recorded indication. Only 7% had a total input calculated, and in 71% of patients, the total fluid given could not be determined, 7% had less than 50% of prescribed fluids given, 4% had between 50% and 75% given, and only 18% had over 75% given.
After the intervention, information was collected from all the patients on intravenous fluids. The outcome measures related to the NICE guidelines and the process measure related to the use of the new chart were recorded. This was done initially weekly for 13 weeks to identify problems and adapt any required training. Further data were collected over the subsequent 10 weeks.
A standardised paper audit tool was used to collect the data. Subsequently, the audit tool was transferred to Epicollect5 Data Collection, V.1.0.6, allowing for more efficient data collection. A team of medical doctors and nurses was involved in data collection and teaching throughout the project.
Design
The problem of accurate fluid management was identified by local doctors within a quality improvement (QI) session run by the IGH fellows. A project group was initially made of two local junior doctors, one IGH fellow and the head of internal medicine. Their role was to design the project, come up with a solution, and collect and present data back to the medical department. The aim of the project was to improve the quality of intravenous fluid prescriptions and therefore increase the percentage of prescribed fluids, administrated for hospital inpatients on the medial wards at CMH.
Information on QI methodology was taken from ‘How to, Guide to Quality to Improvement’ by the Aurum Institution.4 The IGH fellow acted as a mentor to the group but also contributed to data collection.
A root cause analysis using the ‘five whys’ technique was used to assess the problem and to develop an initial strategy for the first plan–do–study–act (PDSA) cycle. This was used as an easy method to find the underlying cause, which had many contributing factors.
An audit tool was created by the project group to collect baseline and postintervention data. The data was collected prospectively from the current medical inpatients as access to medical notes after discharge was difficult. The data was used to identify any specific teaching or training needs.
The development of a standardised chart for intravenous fluid prescribing was created as a solution to improve the poor documentation of the full standards of a fluid prescription as found in the baseline data. It also acts as a solution to improve clarity of the fluid management plan between doctors and nurses. Compliance with the use of the chart was chosen as one outcome measure, along with its completion as per universal prescribing standards as these were specific and easy to measure. The chart was adapted and a separate output chart was added. This adaptation was made after feedback from doctors and nurses; feedback was gathered on a weekly basis by the project team.
The project was bolstered by support from key hospital leaders among the medical and nursing staff in internal medicine; lack of key stakeholder support and engagement had been cited previously as contributing to past QI project difficulties within the hospital.
A further potential barrier to the project’s success was the frequent staff rotations of the junior doctors involved in the project, along with the rotation of IGH fellows.
Strategy and improvement cycles
PDSA 1
The plan was to identify the root cause behind the poor fluid management of the medical patients using QI methodology. The root cause analysis identified a lack of a standardised fluid prescription. Baseline data was collected weekly over a 3-week period using an audit tool created by the project team. This looked into whether and where fluid prescriptions were documented. It also assessed whether the prescriptions met the standards from the NICE guidelines: rate, type, volume, indication, 24 hours’ prescription and prescriber’s signature. Data was collected to assess whether it could be determined from the documentation how much of the fluid prescribed was administered to the patient, as an indicator of the level of communication between the nurses and doctors. The project team analysed the data using Microsoft Excel 2010 . The results were used by the project team to brainstorm solutions to improve the documentation and level of communication of patients’ fluid management. The project team proposed the introduction of a new fluid chart, which acted as the process measure. The outcome measures were the NICE guideline standards for intravenous fluid prescribing.
The results from the audit were presented in a medical meeting with the head of department, matron, senior sisters and medical doctors. The meeting also provided an opportunity to introduce the new chart and to describe expected standards of intravenous fluid prescribing. An objective strutured clinical examination (OSCE)exercise was performed at the end of the training to check staffs’ understanding and to reinforce the learning points.
PDSA 2
The plan was to introduce the new chart on one medical ward as a pilot. This was done by providing the ward with the new chart and removing the old chart. Group teaching was done on the ward for the doctors and nurses as a lecture-based teaching session followed by an OSCE-style exercise. The OSCE-style teaching was a helpful way to demonstrate everyone’s understanding and highlighted any questions. Data was collected weekly using a standardised audit tool. This assessed (1) the process measure (the use of the new chart for the fluid prescription), (2)the outcome measures (the NICE guidelines standards) and (3) how much of the fluids prescribed (as %) were administered. Data were collected weekly using the audit tool. Run charts were created to clearly display the weekly results and trends. We found an initial improvement: within the first 2 weeks as the new chart was being used more than 60% of the time; however, this dropped to 20% in the following 2 weeks. A similar trend was found with adherence to the outcome measures. Feedback highlighted that many of the nurses had not received the training because they had been off shift and were unfamiliar with the chart. It was difficult to ensure that all the staff had the training due to shift patterns. The project team had to dedicate more of their time to provide more frequent training. Laminated posters with instructions were also put up on the wards as an aid. There were also difficulties with the supply of the new chart as it was piloted on this ward. The printer often did not work; therefore, old charts were taken from other wards. The IGH fellow looked into the process of getting a new printer; however, this was found to be time-consuming and involved finances the hospital did not have. The project team had to personally print and supply the charts on the ward during the pilot.
PDSA 3
The plan was to implement the new chart across all the medical wards in combination with further ward-based teaching and training as described above. There were many difficulties as this involved building relationships with new staff and providing teaching to a larger cohort of staff, which was very time-consuming. Data was collected weekly using the same audit tool used in the second PDSA cycle. This highlighted poor adherence to the process measure as the new chart was being used in only 50% of prescriptions. Qualitative feedback highlighted that some of the nurses were reluctant to use the new chart without a standard operating procedure (SOP) to legitimise its use. This cycle occurred over the Christmas period, which meant there was a low level of staffing and a change in medical interns. This was thought to be a large contributor to the poor adherence to the chart. Teaching was provided for the new interns as soon as they started to embed the practice in early clinical work.
PDSA 4
The plan was to improve compliance with using the new chart on all medical wards. This was done by more ward-based training on the new chart. We also encouraged staff on the ward to teach their colleagues. This involved getting the support of key stakeholders, such as each of the ward’s sisters and matron. The creation of the SOP, which had the backing of the head of nursing, seemed to be a motivating factor for use of the chart. Data was collected weekly using the same audit tool. The results were analysed to help focus future teaching on areas that needed improvement.
Over time, the project team was able to build relationships with the ward staff, which helped improve compliance with using the chart. The project team also started to get more frank feedback from the ward staff. It was vital the team then clearly acted on this feedback to maintain their trust and the relationship. The nurses expressed their preference for an additional fluid output charting document and felt the lack of patients’ understanding of fluid management and the importance of maintaining their own cannula were contributing to poor fluid administration. The audit data demonstrated an increase in the use of the new chart during this cycle to 80%.
PDSA 5
The plan was to improve the features of the chart based on feedback received. An option to calculate fluid intake was added to the original chart and a separate output chart was created. A patient-directed leaflet on cannula maintenance was developed by a nurse and distributed in the wards. The audit tool was adapted to assess if the output chart was being used. Audit data highlighted an increase in adherence to the process measure to 92%. The data highlighted increased compliance to all outcome measures; 67% prescriber’s signature, 60% indication, 80% 24 hours’ prescription and 50% indication. To ensure the charts would remain embedded within the system, the IGH fellow looked into the ward’s procurement process. A meeting with the head of procurement was arranged to ensure that the supply of new charts would continue across all wards.
Results
Information on 309 medical patients was collected: 45 patients were assessed during the baseline data collection period (ie, PDSA cycle 1), 122 during the interventions period (ie, PDSA cycles 2 and 3), and 142 postintervention (ie, PDSA cycles 4 and 5). The intervention period occurred over 6 weeks between late November and early January 2017. Data collected solely to improve the chart design were not included in the results. The intervention period was slower than anticipated as there was a change of staff over the Christmas period therefore additional training had to be done. There was no data available in March due to a technical fault with the online data collection application. Information from 18 patients was gathered in July to assess sustainability.
Table 1 highlights the results of the baseline data, intervention period, and during and postintervention periods. The baseline data demonstrated that only 34% of fluid scripts were on the old fluid chart, 42% were found on the drug chart and 24% were in other locations, such as referred to in the medical notes. The new fluid chart was used for 81% of fluid prescriptions following the intervention. As hoped, the old chart was not used on the wards 3 months after the intervention. Figure 1 demonstrates that after the intervention, there was less variability in the location of the fluid script.
Percentage of fluid scripts meeting the process and outcome measures

Comparing the location of the fluid prescriptions, as a percentage of the patients included, before and after the intervention.
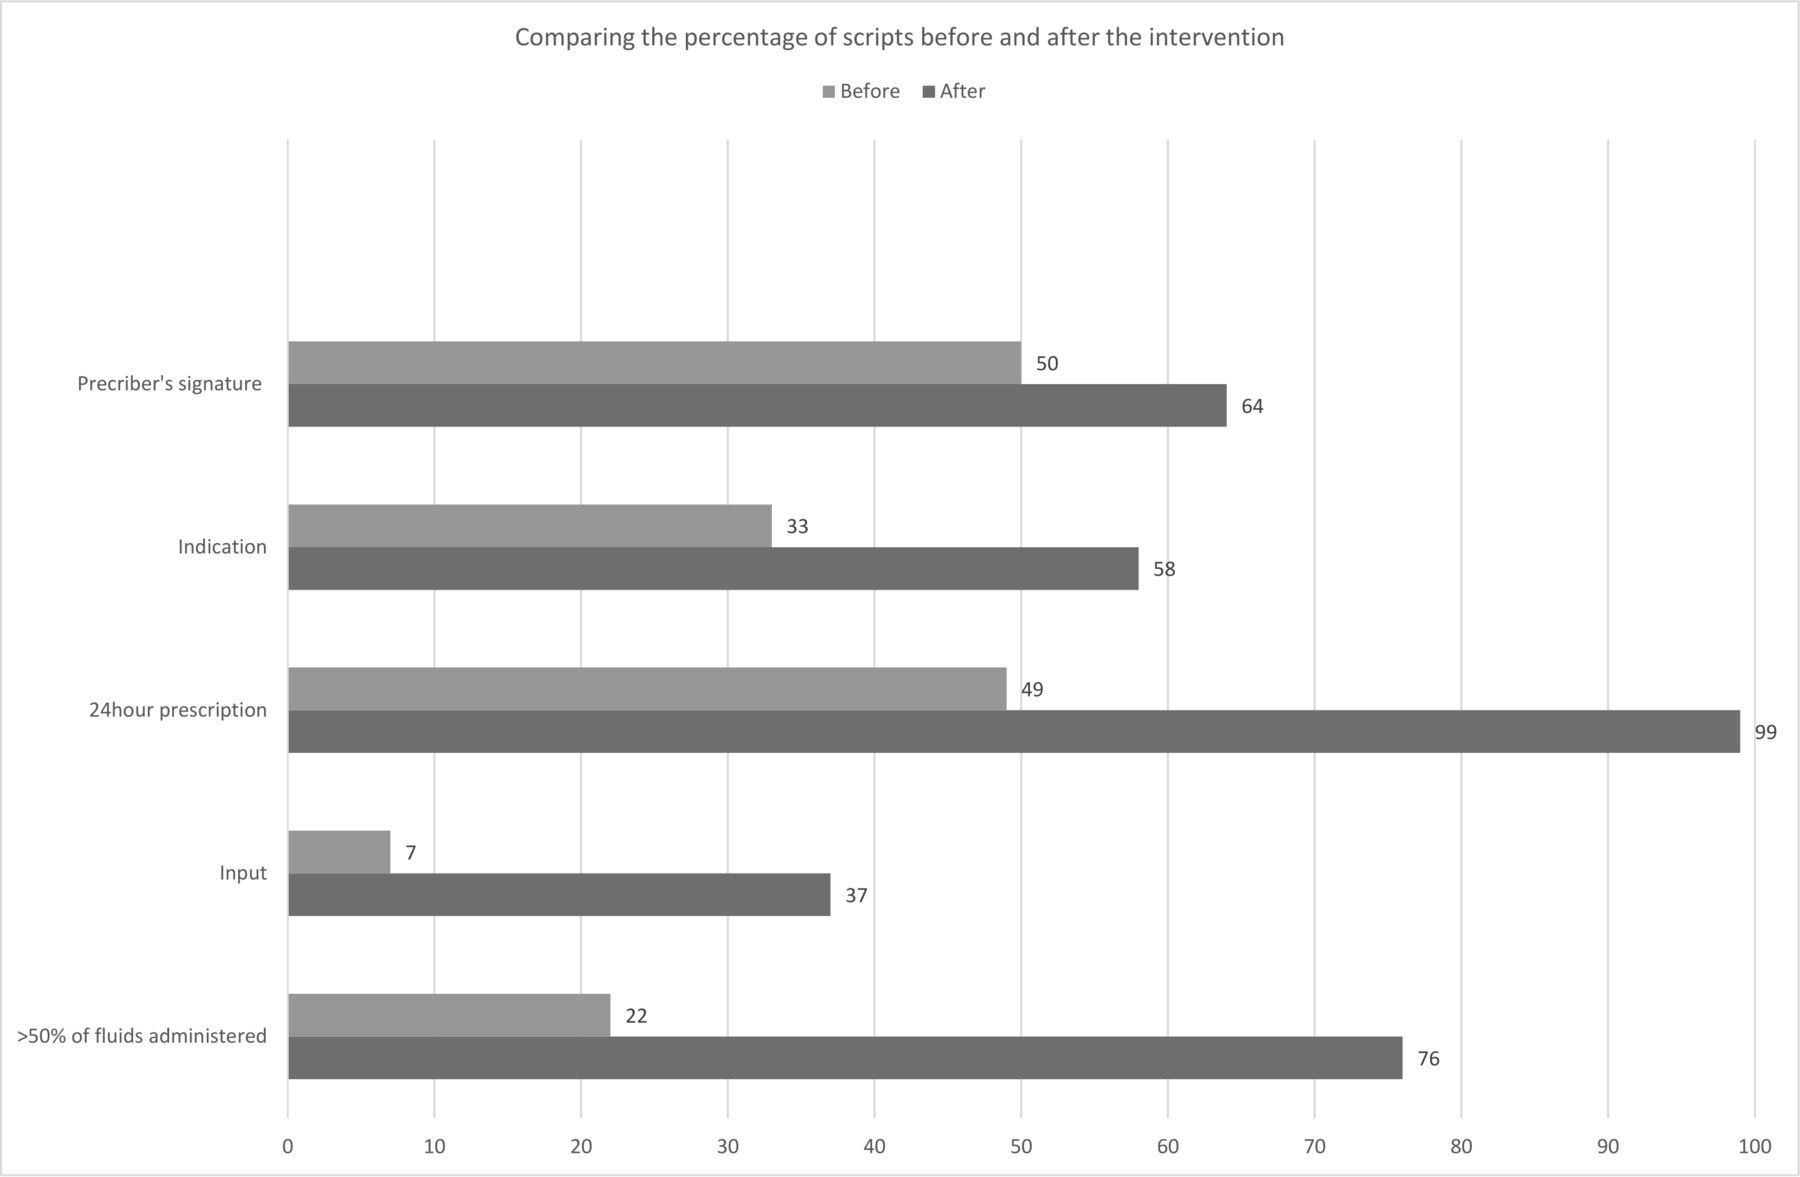
Figure 2 highlights an increase in the trend of prescription quality measures (prescription, indication, 24 hours’ prescription and input) being recorded after the intervention. Interestingly, the highest percentage of fluid scripts that were actually signed by the prescriber were found during the intervention period, but this fell back to the baseline of 50% postintervention.

Comparing the percentage of fluid prescriptions meeting the intravenous fluid prescribing standards before and after the intervention.
Seventy-six per cent of fluid prescribed was administered to the patient after the intervention, compared with 22% before—this had been a serious issue previously.
It is difficult to assess whether the use of these new charts has improved the general fluid management of these patients, as patient outcome measures, such as fluid status, were not within the scope of this project. The increase in doctors’ awareness of appropriate fluid prescribing is reflected by the increase in the presence of fluid prescription and indication. The increase in the amount of fluid prescribed and administered reflects an improvement in communication between the doctors and nurses. The increase in input calculated highlights an improvement in the nurses’ understanding of and engagement with fluid management.
Data were collected 2 months after the intervention period, anticipating that some of the project improvements may not have been sustained without active efforts from the project team. Table 1 demonstrates that the follow-up period results were similar to those at the end of the project. This showed that the new chart was still being used and that, generally, the improved standards of prescriptions were being maintained.
Lessons and limitations
Reinforcing this project’s goal to the key stakeholders made it easier for the nurses and doctors to understand the purpose of the project and to adapt to the change.
The delay in formalising the new chart by creating a SOP impaired the dissemination across all medical wards according to the timescale in the project plan and was an issue that had not been anticipated by the team. Gathering frank feedback can be difficult but is vital to the success of any QI project. The development of relationships with staff allowed for open discussion and feedback.
The local staff’s involvement in the execution of the project increased its chance of success as they had already developed internal relationships and understood practicalities of the hospital. The staffs’ acceptance of the intervention helped to sustain the change to practice as they can reinforce the new practice and teach new staff. The data collected 2 months after the intervention was helpful to show that the new chart continued to be used; however, it would be useful to repeat the audit 6 months to 1 year later to really assess sustainability.
The main challenges were ensuring all staff were trained and the new intervention was embedded within the department. To mitigate this, a project team of multidisciplinary professionals was formed to deliver ongoing training regarding the new fluid chart.
Acceptance of the new chart did take many weeks, but a change in practice was shown. The signing of the prescription was still done poorly and indicated an ongoing need to align clinician fluid prescribing with script writing behaviour. Ongoing reminders by clinical leaders of the potential harms of suboptimal fluid prescribing will be helpful.
The use of the online data collection application did reduce the time to collect and upload the data; however, a technical fault did lead to loss of results from one data collection.
The timing of a project is important as its success can be hindered by a loss of momentum; therefore, initiation over a holiday period should be avoided.
The project did not review if the fluid prescribed was appropriate for the patient. This would be harder to assess but, if done, would give a better indication if the patient was receiving an adequate amount of fluid and whether improving prescriptions improves patient morbidity/mortality.
Fluid management is an important part of patient management in many other specialties such as surgery, paediatrics and intensive care. The individual approach may vary between departments; therefore, the project may have to be adapted. A toolkit including all of the project materials used was collated in order that this project could be replicated in other departments and hospitals across the Eastern Cape.
Conclusion
This project found suboptimal fluid prescribing and weak communication of fluid prescriptions between staff in a regional hospital within the Eastern Cape Province of South Africa. This has also been shown to occur internationally and may cause patient harm.1
Staff needed to understand the impact of good fluid prescribing on patient outcomes. They also needed to understand their role in ensuring patients actually received the fluids prescribed. The introduction of the new chart and teaching aimed to address this.
The results have shown an acceptance of the new chart and an improvement in staff awareness and understanding of accurate fluid documentation. The involvement of all stakeholders within the medical department was fundamental to the project’s success.
Dedicating a significant amount of time to teaching and training enabled more staff to understand and accept the new chart. This eventually led to a change in practice within the whole department, continued 2 months after the project ended. Adding fluid prescribing to induction training for new staff and maintaining stakeholder engagement may lead to sustainable change.
There is little evidence regarding quality of intravenous fluid prescribing in South Africa; however, similar problems may function in smaller district hospitals. The creation of a ‘QI toolkit’ of project resources will allow it to be used in other health facilities and hopefully improve the prescription and administration of intravenous fluids across the Eastern Cape.
Acknowledgments
The authors thank Nombewu Lukhangele, Sharon Harbor, Nabeelah Conrad, Joss Kiiza and Beatrix Erasmus for being part of the project team. They helped design the plan–do–study–act cycles, implement the training and collect data.
Footnotes
Contributors CL was involved in the design of the project after the first plan–do–study–act cycle, data collection, data analysis and interpretation; teaching and training throughout the project; and drafting and writing of the final version of the paper. RS was involved in the design of the project, data analysis and interpretation. AP was involved in the design of project and in providing critical advice on the paper.
Funding Improving Global Health through Leadership Development, Thames Valley and Wessex Leadership Academy.
Competing interests None.
Patient consent for publication Not required.
Ethics approval Ethical approval was sought and approved by the East London Hospitals' Ethical Board.
Provenance and peer review Not commissioned; externally peer reviewed.