Article Text

Abstract
Background and method In care homes, staff well-being, job confidence and opinion of the care provided to residents are central to morale and care quality. In this study, care home staff in the East Midlands region of England completed self-reported outcome and experience surveys in two rounds. Mean scores for each home are shown using a scale from 0 (all chose lowest option) to 100 (all chose highest option). High scores are good.
Results In round 1, 332 staff in 15 homes submitted responses; in round 2, 207 staff in 9 homes. Mean scores in round 1 and round 2 were similar, although those of some homes scores differed significantly, cancelling each other out. Overall, Work Wellbeing mean score was 83 (care home range 48–97), with worthwhileness (92) the highest ranked item and anxiety at work (78) the lowest. Job Confidence mean score was 84 (range 59–94), with able to manage the work (86) highest and involvement in decisions that affect staff (79) lowest. Care Provided mean score was 86 (range 59–97), with treat people kindly (91) highest and well organised (80) lowest. Homes rated as outstanding by the Care Quality Commission had higher scores on average than those rated good, which were higher than those rated as needing improvement.
Conclusions This study has demonstrated the practicality of measuring staff views of their Work Wellbeing, Job Confidence and Care Provided in care homes. Rather than wait for adverse quality outcomes to be detected, this approach offers a way to track staff morale and declared capability over time.
- nursing homes
- quality management
- surveys
- performance measures
- evaluation methodology
This is an open access article distributed in accordance with the Creative Commons Attribution Non Commercial (CC BY-NC 4.0) license, which permits others to distribute, remix, adapt, build upon this work non-commercially, and license their derivative works on different terms, provided the original work is properly cited, appropriate credit is given, any changes made indicated, and the use is non-commercial. See: http://creativecommons.org/licenses/by-nc/4.0/.
Statistics from Altmetric.com
Introduction
Staff morale and the quality of care delivered are fundamental to the experience of care home residents and managers. When positive, they reflect staff resilience and the operational capability of care homes to deliver good resident experience.1 2 Neither staff morale nor quality of care is easy to measure routinely. A simple method to measure and monitor these in individual care homes and across a range of homes over time could facilitate proactive interventions, rather than waiting for service failure to prompt a reactive response.
Here, we describe a study in which staff in 15 care homes across the East Midlands region in England used a short one-page survey to report their well-being at work, confidence to do their job and the quality of care they provide. The main purpose was to assess the feasibility of the method and the usefulness of the results.
Method
Staff perceptions
The survey was presented on a single side of A4 paper with six sections, making it quick and easy to complete anonymously. All questions were optional. See example of survey figure 1. Fields include:
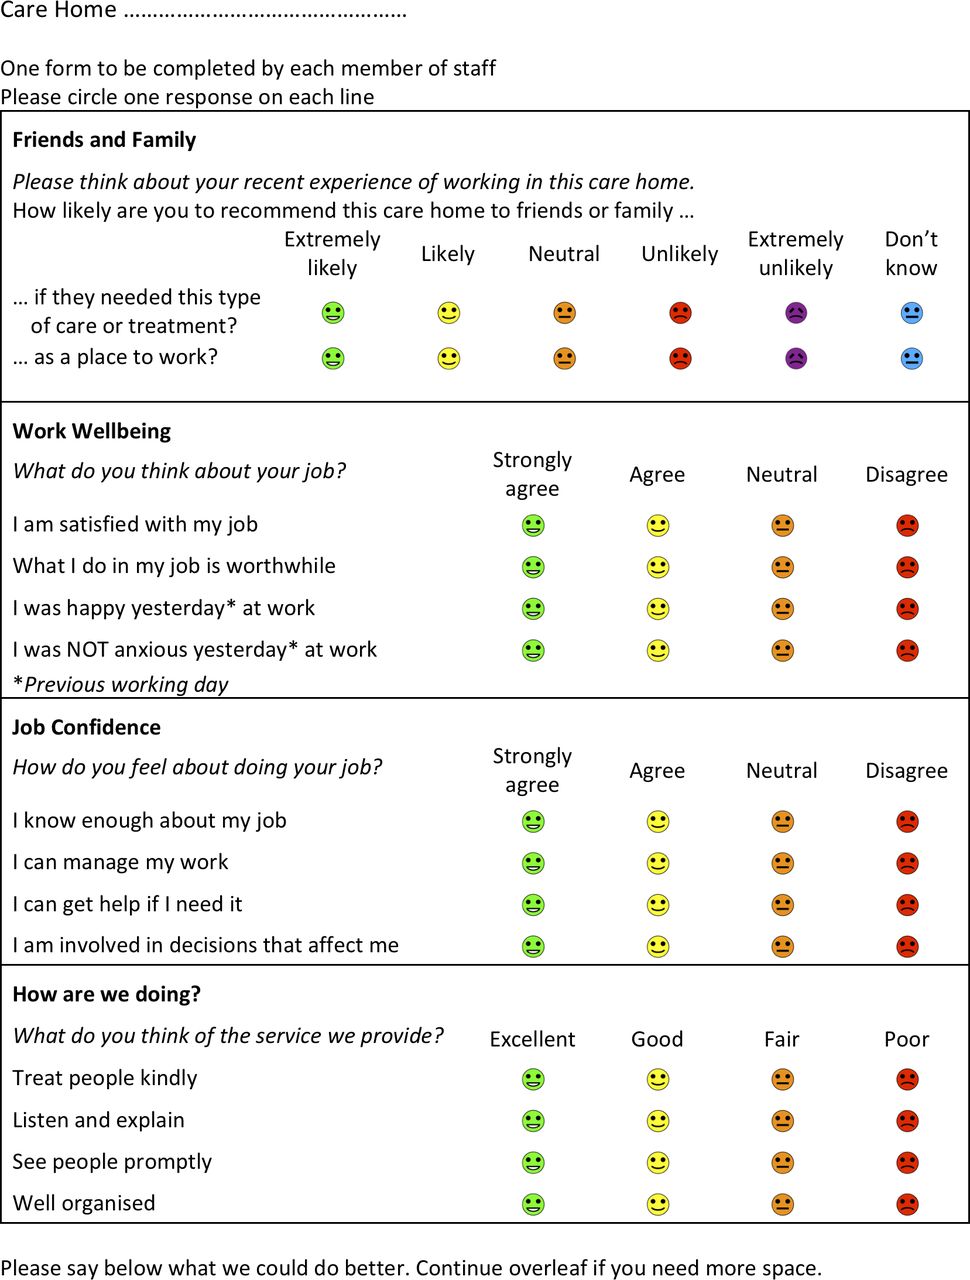
Form used to capture care home staff views.
Care home name.
Friends and Family (Staff FFT) asks staff how likely they are to recommend their care home to friends or family (a) if they were to need this type of care (for Care) and (b) as a place to work (for Work).3 4 The Staff FFT has been used in all National Health Service (NHS) trusts providing acute, community, ambulance and mental health services in England since April 2014. However, it is not widely used in care homes, which are not part of the NHS.
Work Wellbeing is based on the Personal Wellbeing Score adapted for well-being at work.5 This is based on items used by the Office of National Statistics (ONS) to measure personal well-being across the UK (ONS4).6 The first two items are reflective, about job satisfaction and worthwhileness. The third and fourth items focus on recent positive experience and anxiety at work. All items are positively worded, which is why the anxiety item is prefixed by ‘NOT’.
Job Confidence is based on the Health Confidence Score.7 This covers job knowledge, capability and self-efficacy, help and support, and collaborative decision-making.
How are we doing? (Care Provided) is based on the howRwe patient experience measure, adapted to focus on how staff regard the service they provide for residents.8 The items cover staff opinions of their kindness, communication, promptness (eg, time to respond to a bell call) and home management.
Space for free text comments.
Date was recorded automatically on entering data into the computer.
These measures were developed by R-Outcomes Ltd (apart from the Staff FFT). These measures share a common look and feel, with four items and four response options; each item is scored from 0 (worst) to 3 (best).9 A summary score was calculated by summing the four item scores of each measure, giving a scale with range 0 (all worst) to 12 (all best).
For groups, such as all responses from a care home, the mean scores are transformed linearly to a scale from 0 (all worst) to 100 (all best). This shows mean item and summary scores on the same scale. In general, scores over 80 are high, between 60 and 79 are moderate, from 40 to 59 are low and under 40 are very low. High scores are always desirable, although each result must be considered in context.
Recruitment, data collection and analysis
Thirty-one care homes were initially invited to take part. Homes were not incentivised and participation was voluntary. To simplify data collection and to ensure staff anonymity, no data were collected about individual raters. For analysis, each home was allocated a random identifier, which they were told. In round 1, 15 care homes took part and 9 in round 2.
Blank forms were sent to each care home, with a short instruction sheet and a stamped addressed envelope for returning completed forms for data entry at the centre.
Each care home was sent a report after each round showing their own results and those of other anonymised homes. Statistical differences between rounds were assessed using Student’s t-test (two-tailed 95% CI). Analysis was performed using Microsoft Excel.
The Care Quality Commission (CQC) inspects all care homes and publishes quality ratings on its website, rating each home at one of four levels (outstanding, good, requires improvement or inadequate). We used online published CQC data to check details of each care home and their CQC quality rating.10
Ethics statement
Ethics approval was not sought nor required because data collection was anonymous and undertaken by staff to evaluate the current services without randomisation.11
Patient and public involvement
Patients were not directly involved in this study.
Results
Participation
Table 1 shows the results for all participating are homes by round. In round 1, 332 staff in 15 care homes completed the survey (mean 22.1 surveys per home, range 8–74). In round 2, 207 staff in nine care homes completed the survey (mean 23.0 surveys per home, range 5–40). All homes that did not partake in round 1 were invited to participate in round 2, but none did so.
Results for all care homes (differences between columns are not significant)
Missing data
Missing value rates are also shown in parentheses for each item. Overall, the missing data rate was 4.1%. The item with most missing data was the Friends and Family Test for work—How likely are you to recommend this care home as a place for work? (12.0%). The second highest number of missing values was for Work Wellbeing—I was NOT anxious yesterday at work (6.8%). The item with the lowest missing data was Care Provided—Treat people kindly (0.6%). Summary scores for each group of items are not calculated for data sets with any missing values.
Overall differences between rounds
Between rounds, none of the items have statistically significant differences overall at the 95% confidence level. However, there were quite large differences at the level of individual homes as discussed below.
Staff Friends and Family Test
FFT results are reported as the percentage of staff who responded extremely likely or likely to each question and the percentage that chose not to answer (missing %). It is likely that those who did not answer would not recommend.
The Staff FFT scores for these care homes are high in comparison with similar data from NHS organisations (quarter 2 2018–2019, n=130 555) for both Care and Work.12
Recommend for Care: Round 1 all 90%; all NHS organisations 81%.
Recommend for Work: round 1 all 86%; all NHS organisations 64%.
At the individual care home level, two of six homes, which took part in round 1 but not round 2, had poor Staff FFT scores for both Care and Work (range 74%–78%). Of homes that completed both rounds, one improved from 50% to 85% for Care and from 50% to 84% for Work. In another home, the Staff FFT scores fell from 80% to 60% for Care and 80% to 75% for Work.
Work Wellbeing
The mean Work Wellbeing summary score for all homes was 83 (care home range 48–97). The highest Work Wellbeing item score was for What I do in my job is worthwhile (92). The lowest score was for I was NOT anxious yesterday at work (78).
Overall, the mean Work Wellbeing score shows little difference between round 1 (82) and round 2 (84).
At the individual home level, in two homes Work Wellbeing summary score improved significantly (from 48 to 71 and 82 to 97) and in two homes scores fell significantly (from 69 to 54 and 90 to 79), cancelling each other out.
Job Confidence
Mean Job Confidence summary score was 84 (care home range 59–94), with top mean score I can manage my work (86) and bottom I am involved in decisions that affect me (79). There was little difference in the mean Job Confidence summary score in round 1 (83) and round 2 (84).
At the individual home level, the Job Confidence summary score improved significantly in two homes (from 59 to 76 and 84 to 94) and in one home fell significantly from 92 to 82. In the first home, the biggest gains were for I can manage my work and I can get help if I need it. In the second home, the largest gain was for I am involved in decisions that affect me. The biggest fall was for I can get help if I need it.
Care Provided
For Care Provided, the mean summary score was 86 (care home range 59–97), with top score for Treat people kindly (91), the bottom for Well organised (80). There was little difference in the mean scores in round 1 (86) and round 2 (87).
At the individual home level, one care home improved significantly (76 to 96) and one fell significantly from 97 to 89. In both care homes these changes were across all items.
Psychometric assessment
Internal correlations between Care Provided items are high and Cronbach’s α is 0.91. This suggests that all four Care Provided items are measuring aspects of the same underlying dimension.13
Internal correlations of some Work Wellbeing and Job Confidence items are low or moderate, with Cronbach’s α of 0.62 and 0.72, respectively. This suggests that these measures capture more than one underlying dimension. For example, the item I know enough about my job has low correlation with I can get help if I need it (r=0.16).
Correlation between the summary scores for Work Wellbeing and Job Confidence is r=0.68, with Care Provided is r=0.66; between Job Confidence and Care Provided r=0.62.
CQC ratings
Thirty-one homes were invited to take part in this study. Three homes were rated outstanding by CQC and all partook in both rounds (100%). Twenty-two homes were rated good by CQC, of which eight participated in round 1 (36%) and four in round 2 (18%). Six homes were rated inadequate or needs improving by CQC, four took part in round 1 (67%) and two in round 2 (33%).
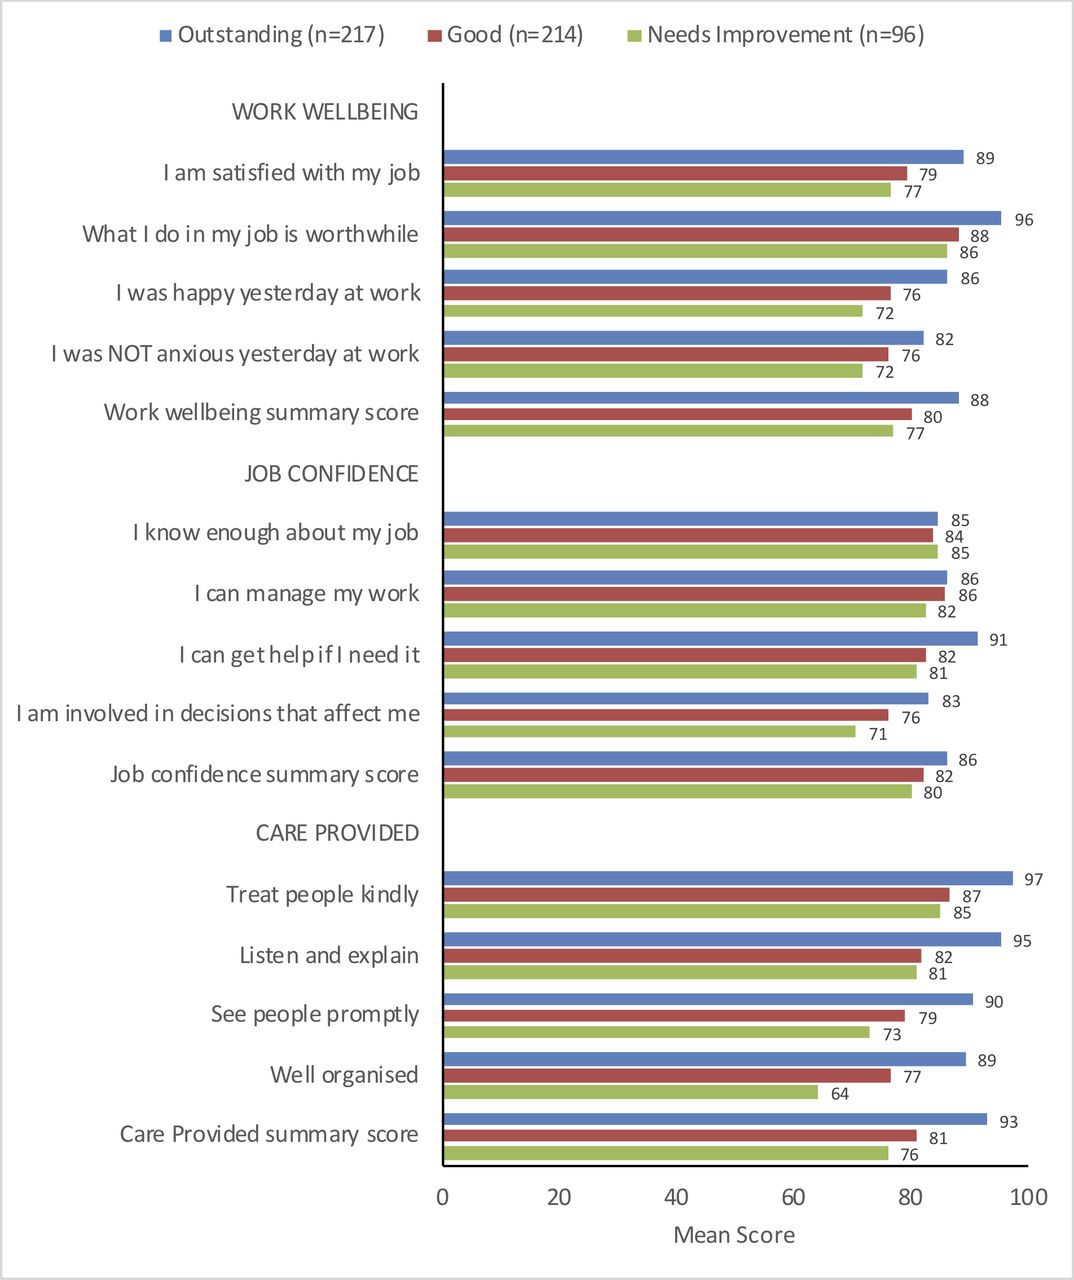
Figure 2 shows the mean item and summary scores for Work Wellbeing, Job Confidence and Care Provided, classified by CQC rating of each care home.

Mean scores for each item and summary scores for all data by Care Quality Commission rating of care homes.
Homes rated by CQC as outstanding have higher scores than those rated good, which were generally higher than those rated as needing improvement or inadequate.
CQC ratings are associated with mean Care Provided scores for each care home (r=0.40) and with the Staff FFT for care (r=0.39) and for work (r=0.39).
Two Job Confidence items were only weakly associated with CQC ratings: I know enough about my job (r=0.04) and I can manage my work (r=0.10).
There is a clear association between CQC ratings and Care Provided and Work Wellbeing, which are about the care home as whole, but less with Job Confidence, which is about the individual staff member.
Discussion
An innovative aspect of this study was to ask care home staff to rate their well-being and confidence at work and the level of care they provide. These ideas have been developed from those tested in a large international study and other projects in which about 400 care homes took part.14 In earlier work, the focus was on residents’ perceptions of their care, but it is difficult to obtain this type of data from people with dementia, other cognitive impairments or near their end of life.
Care homes do not routinely record staff opinions of their Work Wellbeing, Job Confidence and Care Provided to residents. However, these aspects are known to be associated with the quality of care home leadership15 and are likely to be associated with resident outcomes.16
We found significant positive and negative changes in individual care home mean scores in the two rounds separated by about 6 months. These scores could help managers see the results of operational changes or indeed the impact case mix, spot problems as soon as possible and show the regulator (CQC) that they are responsive.
In this study, the staff ratings are high overall, which may reflect the population of care homes that took part. We have comparable scores for residents’ ratings of the Care Provided, collected in a survey of 10 609 residents in 287 care homes, where the mean scores were lower.14
Limitations of this study include that the care homes were self-selected and participation was voluntary without any incentives to participate. To preserve anonymity, we did not collect detailed information about characteristics of the respondents, although homes were encouraged to ask all staff to take part. The results are not likely be representative of the sector as a whole but demonstrate how the method can be used and results can be presented.
Our original proposal was to survey about 500 staff in 10–15 care homes in each round. In round 1, we obtained responses from 322 staff in 15 care homes. In round 2, we received 234 responses from 9 care homes. Three care homes rated outstanding by CQC took part in both rounds.
Two homes had outlying results. One, which was rated as inadequate by CQC, reported the highest scores for Care Provided in round 1, but did not partake in round 2. Another home, which was rated as needs improvement by CQC, had scores in the lower half in round 1 and reported the highest scores across all dimensions in round 2. We excluded these two outlying data sets.
Staff found it straightforward to complete the surveys, and data completeness was satisfactory. This project used paper forms, but surveys may be completed digitally, using smart phone, tablet or personal computer.
Response rates to surveys in care homes are notoriously poor, whether these are to be completed by residents or staff.17 18 The brevity and simplicity of the forms, and relevance of the questions helped mitigate this. In this study, the missing data rate was 4.1% overall. Missing data may indicate either that a question is difficult to answer or that people are not willing to state what they really think. For example, the question with the the highest level of missing data was the Staff FFT question about whether they would recommend this home as a place to work. It is likely that the second explanation applies here.
One lesson from this project was the desirability of close engagement with care home managers. The original plan was to appoint a local part-time project coordinator, but this was not feasible. Instead, the project was managed remotely (from about 100 miles away) and after a short initial meeting, communication with care homes was by post, email and telephone. Face-to-face engagement is desirable at the start and to deal with any issues or queries. We received limited feedback from the participating care homes during this study (less than five emails), which may reflect the pressure of work in most care homes.
Conclusions
This study has demonstrated the practicality and value of measuring self-reported staff opinions of Work Wellbeing, Job Confidence and Care Provided in care homes. The study identified significant differences in the mean scores of different homes in two rounds of data collection. Quality assurance in care homes is vital, and this type of measure may help care home managers and commissioners track their performance over time at the individual care home level.
Acknowledgments
We are grateful to the care home staff and managers who took part.
Footnotes
Contributors TB designed the surveys with CB and wrote the first draft of the paper. TB and JS performed the analyses. JD managed the data collection. All authors contributed to the final text, read and approved the final manuscript.
Funding The study was funded by the East Midlands Academic Health Science Network Patient Safety Collaborative (EMAHSN PSC).
Competing interests TB reports grants from East Midlands AHSN, during the conduct of the study; he is a director and shareholder of R-Outcomes Ltd, which owns the copyright of the Work Wellbeing, Job Confidence and Care Provided measures and provides quality improvement and evaluation services in the health and social care sectors. JD and JS worked for R-Outcomes on this project. CB is a non-executive director of AKARI Care Homes, FINCCH and Invatech Health, all of which have interests in care homes and social care. Please contact R-Outcomes Ltd if you wish to use these measures in care homes.
Patient consent for publication Not required.
Provenance and peer review Not commissioned; externally peer reviewed.
Data availability statement Data are available on reasonable request.