Article Text

Abstract
Background Current patient satisfaction assessment results are delayed and obtained from select patient surveys. As a result, these assessments may not represent the experience of the entire patient population. This study developed a method to measure and evaluate all patients’ experiences while they are within the care episode and link it to processes within the organisation.
Methods Using the Six Sigma methodology, sites assembled diverse teams to categorise and analyse negative experience comments from patients to understand the drivers of dissatisfaction. These customer expectations lead to the development of the four components in the Patient Experience Bundle (PEB): communication, environment, basic needs/comfort and logistics. Individual process elements were ranked to create a numerical relationship between service and the needs expressed by the voice of the customer. Sites created surveys incorporating questions that focused on the bundle elements and measured daily bundle compliance. Graphical analysis and hypothesis testing enabled sites to determine key drivers of patient dissatisfaction within the bundle elements. Improvement strategies were developed and implemented to address the key drivers of patient dissatisfaction.
Results After implementing process improvements focused on issues identified by the PEB, bundle compliance improved from an average of 51% to an average of 82.5% and Press Ganey Likelihood to Recommend (PG LTR) scores improved from an average of 64.73% to an average 74.64%. The data demonstrated that the trends in improving PEB are followed by meaningful changes in PG LTR scores.
Conclusion This work is built on the identification of common elements of care that impact patient satisfaction and detailed mathematical analysis of the relationship between factors. Using the bundle concept, these improvement efforts maintain highly reliable processes to drive outcomes and provide real-time feedback on patient experience.
- patient satisfaction
- six sigma
- process improvement
This is an open access article distributed in accordance with the Creative Commons Attribution Non Commercial (CC BY-NC 4.0) license, which permits others to distribute, remix, adapt, build upon this work non-commercially, and license their derivative works on different terms, provided the original work is properly cited, appropriate credit is given, any changes made indicated, and the use is non-commercial. See: http://creativecommons.org/licenses/by-nc/4.0/.
Statistics from Altmetric.com
Introduction
Choosing a hospital is a complex and personal decision that reflects individual needs and preferences. In order to assist patients/families with this difficult decision, Hospital Compare was created through the efforts of the Centers for Medicare and Medicaid Services (CMS) in collaboration with organisations representing consumers, hospitals, doctors, employers accrediting organisations and other federal agencies. The Hospital Compare overall rating summarises up to 57 quality measures into a single star rating. The purpose of this rating is to make it easier to compare hospitals side by side. The CMS star rating has information about the quality of care at over 4000 Medicare-certified hospitals across the USA. One key component of this measure, accounting for 22% of the overall star rating is patient experience. Patients are admitted to the hospital in one of two ways: direct admission which is expected and scheduled, bypassing the emergency department (ED), or an ED admission which is unforeseen and unscheduled. Within Northwell Health, a 23-hospital health system located in New York, patients admitted through the ED voiced a lack of privacy, comfort and communication while experiencing extended wait times for an inpatient bed. Challenges and inefficiencies in transition-of-care processes negatively impact patient and clinician engagement, patient and family satisfaction, and community perception of care delivery. In addition, these concerns result in significantly lower Press Ganey Likelihood to Recommend (PG LTR) scores from patients admitted after an ED visit when compared with direct admits.1
Northwell Health has been recognised as one of the top hospitals and health systems for the fifth consecutive year for its commitment to diversity and inclusion. This geographic area has the largest foreign-born population of any metropolitan region in the world and is home to 7 of the 25 wealthiest counties in the USA by median household income which coexist next to neighbourhoods below the poverty line. Historically, the focus of Improvement Science process improvement work has been to reduce the wait time for inpatient beds for patients holding in the ED; however, during the study period, ED volume increased by 10% at the system’s tertiary facilities and patients being held in the ED was an ongoing reality. Although admitted patients are still physically in the ED awaiting an inpatient bed, clinical care is transferred to the hospitalist service line and is no longer the responsibility of the ED clinicians. The miss-matched location to care team can increase uncertainty and confusion and cause discomfort for patients. An increase in ‘access block’ or holds/boarders is also associated with worse clinical patient outcomes such as hospital length of stay and mortality.2–6 Patient satisfaction was the focus of this study for the following reasons: first, in the USA, financial reimbursement is linked to patient satisfaction; second, improving patient experience has an inherent value to patients and families and therefore is an important outcome in its own right; third, patients with better care experiences often have better health outcomes.7 8 Studies have shown actual waiting time is not a predictor for overall patient satisfaction, but perceptions regarding waiting time, information delivery and quality are more accurate predictors.9 Keeping patients informed and managing expectations may be a more effective strategy to improving patient satisfaction in the ED than decreasing actual waiting time.9 Strategies incorporating additional amenities have not been found to be statistically important loyalty indicators.10 The Institute of Healthcare Improvement developed the concept of ‘bundles’ to assist healthcare providers in reliably delivering the best possible care for patients. A bundle ties the changes together into a package of associated interventions that people know must be followed for every patient, every single time.11 Bundle elements, when performed collectively and reliably, have been proven to improve patient outcomes in cases of sepsis and central line infection rate.12 Applying this concept led to the creation of a bundle of elements which would lead to an improved patient experience with higher likelihood to recommend scores on patient satisfaction surveys.
The research question this study was designed to answer is: Would using a process-driven bundle containing the components of communication, comfort, logistics and environment, within a patient’s care episode improve patient satisfaction scores for PG LTR?
Study design
Initially, five tertiary hospitals within Northwell Health participated in this project. The sites chosen represented different geographic and socioeconomic areas of the Health System. All were tertiary hospitals ranging in size from 341 to 827 beds encompassing an urban and suburban area. Sites assembled teams of five to seven participants from diverse backgrounds, which included culture leaders, ED nurses, ED physicians, hospitalists, administration and unit nurses.
Methods
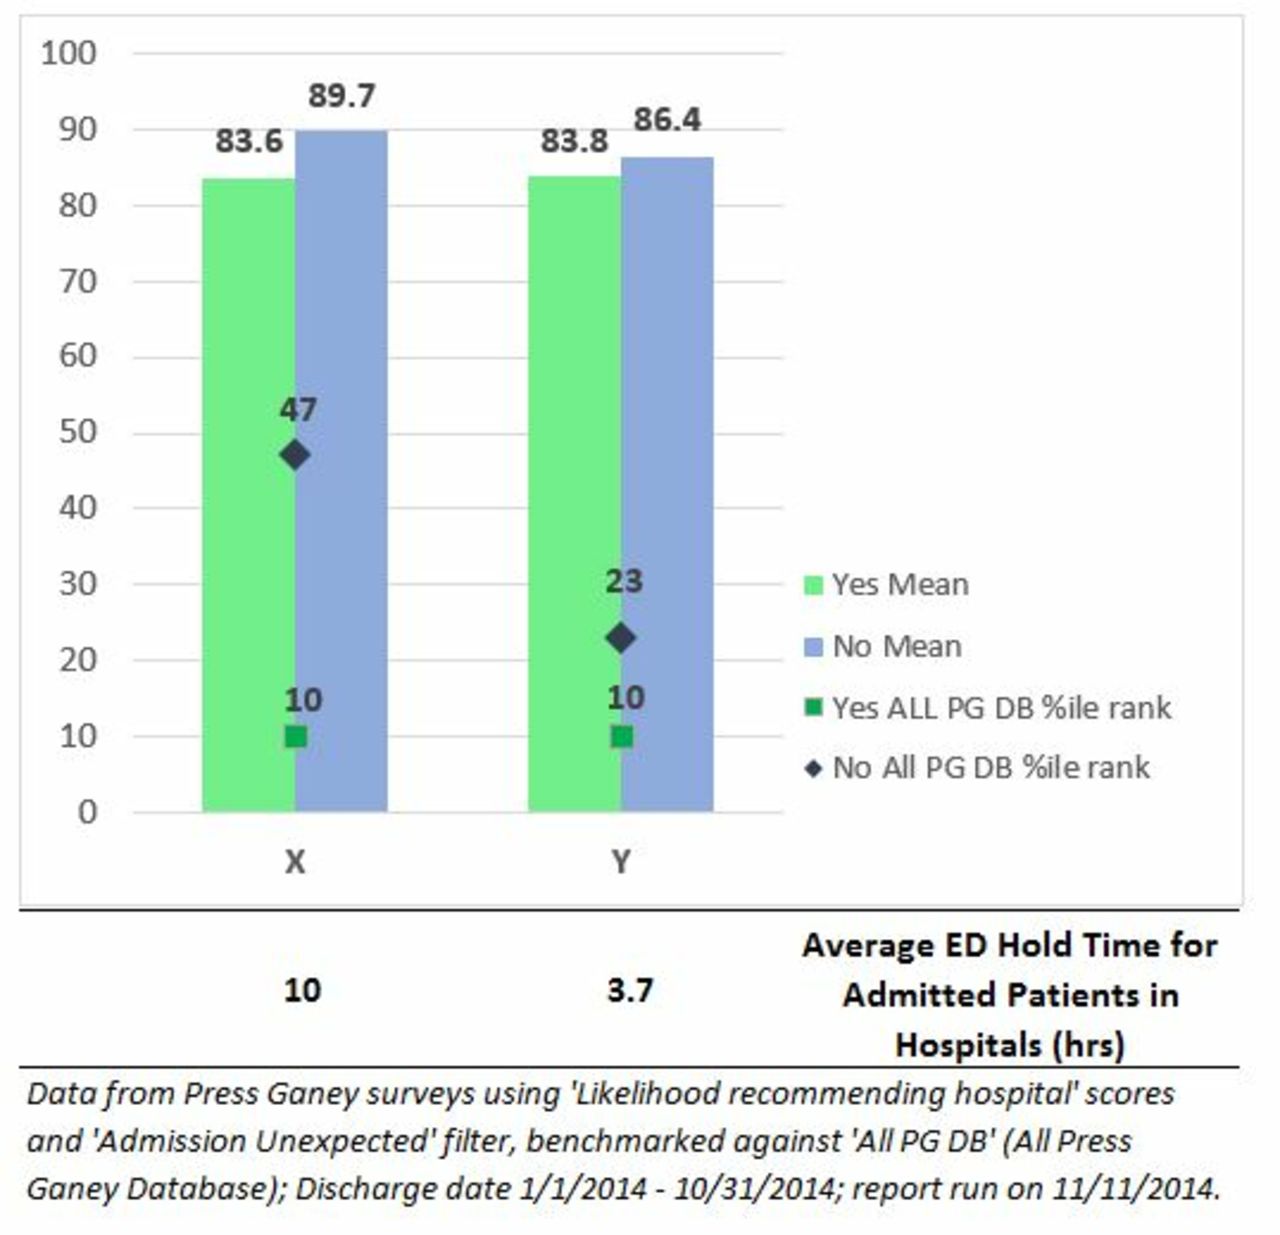
Six Sigma methodology was used to identify and enhance the processes to improve patient experience with a focus on reducing variation in performing the processes and eliminating process defects.13 In the first phase of the study, the problem was clearly defined and demonstrated through historical data. Admitted patients held in the ED waiting for an inpatient bed at the five sites ranged from 3 hours to over 24 hours. The number of patients holding ranged from single digits to over 25 patients at a single site in a 24-hour period. Northwell Health historical data also demonstrated the number of hours held in the ED had no statistically significant impact on PG LTR scores as shown in figure 1, and this was the trigger to begin this study in 2015.14 Negative experience comments from patients holding for an inpatient bed were compiled from Press Ganey Post Discharge Surveys administered at all sites, site-specific focus groups sponsored by the Office of Patient and Customer Experience and customer complaint forms were analysed and categorised to understand the drivers of dissatisfaction.15 In addition, the voice of internal customers, such as nurses and physicians, who perform the processes and are aware of logistical inefficiencies, was collected in multiple focus groups and was organised in driver diagram format.16

Despite significant differences in actual waiting times between best and worst performers, patient overall satisfaction is statistically the same based on Northwell Health historical data in 2014, which was the trigger to start this study. ED, emergency department; PG, Press Ganey Bundle.
Organising the voice of internal and external customers led to finding similar patterns in sources of dissatisfaction and measuring similar elements across the hospitals for further statistical investigations. Appropriate sample size to make statistical inference was determined using the formula for estimating a proportion with 95% confidence level (α=0.05) and half-length of CI equal to 5%. Using that calculation, the power analysis for different hospitals was done to make sure there was enough evidence in the sample to reject the null hypothesis. The calculated powers range from 79.9% to 100% (0<β≤0.2) which is in the acceptable range.17 To standardise the measurements across sites, operational definitions for a defect were established by identifying customer needs and expectations and nationwide or system-level benchmarks for specific processes. For example, call bell response within 3 min as a system-level benchmark.
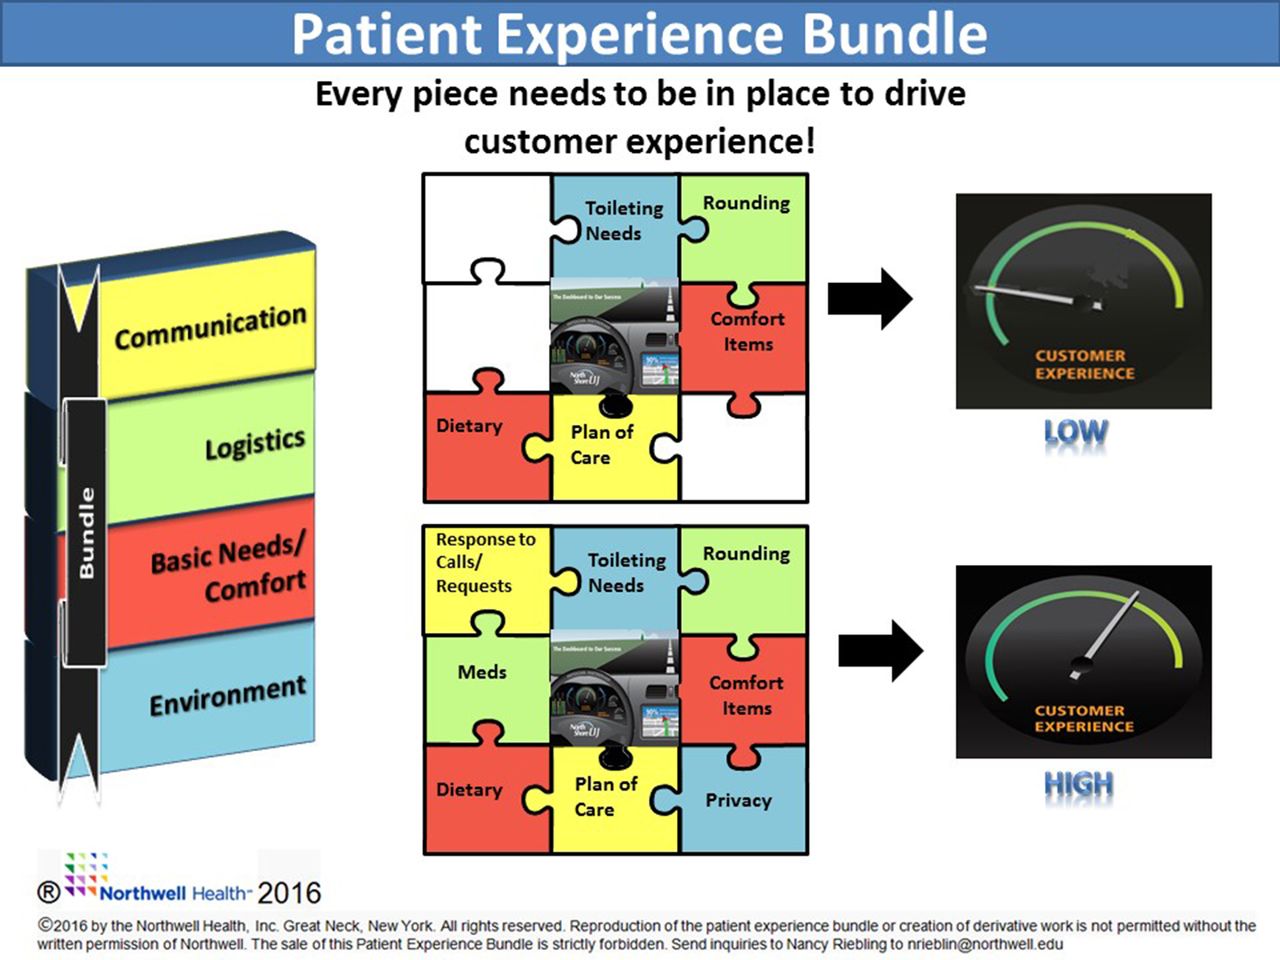
These customer expectations and similar patterns led to the development of the four components in the Patient Experience Bundle (PEB): communication, environment, basic needs/comfort and logistics.18 Each element of the bundle not performed or outside a specified time frame for a patient was considered a defect. At the same time, all the elements were evaluating the reliability of the current process to meet fundamental requirements of the patients. Maslow motivation theory states that people are motivated to achieve certain needs and that some needs take precedence over others.19 Nursing has applied this theory to the assessment process. The PEB’s focus is on the needs of physiological (food, warmth, rest) and safety (security and knowledge). If these needs are unmet, patients are unable to move on to the level of belongingness (meaningful relationships) which foster healing.
The PEB was developed by the consolidation of the five individual sites driver diagram’s recurrent themes. Each of the four components consists of two elements, or process metrics, developed for key drivers of dissatisfaction, as shown in figure 2. The top two process metrics, or elements, were selected for each bundle component. For example, when assessing basic needs, the turnaround time from food request to delivery and timely completion of requests for pillows and blankets were measured. Sites created individual surveys incorporating questions which focused on the bundle elements and their consistent implementation. This project deemed as a quality improvement initiative and therefore does not require the review of ethical or institutional review board. All ED-hold patients for a 1-month period were surveyed by the Six Sigma team at each of the five sites after a wait of 60 min or greater for an inpatient bed. Measurement system analysis for reproducibility was performed by having two team members record the results for a select group of patients and was found to be greater than 90% at each site.

Customer needs are often high-level, vague and non-specific. The Critical to Quality (CTQ) takes the data collected from customers and translates it into critical process requirements that are specific and measurable. In the CTQ Tree the first level is need, the second level is the key components, the third level is the critical to qualify elements, and the fourth level is the process measure. #, number of; CTQ, Critical to Quality Tree; dx, diagnosis; ED, emergency department; MD, medical doctor; meds, medications; POC, plan of care; pt, patient; RN, registered nurse; TAT, turnaround time.
In addition, subject matter experts developed a relationship matrix to prioritise the factors that had the largest impact on the outcome of PG LTR. This method was used to create a numerical relationship between service and the needs expressed by the voice of the customer. This visualised the link between how the requirements are related to each other and to other elements in the model. Using the data and subject matter expertise, a mathematical model was developed to create a novel process weight for each bundle element and calculate PEB compliance. Using the customer rating obtained from the relationship matrix, normalised weight proportions were created for each component. The normalised weight enables the abstract values to be measured on a common scale, 0–1, so that the importance of elements in each component can be compared with each other and among different components in the bundle.20 An exponential equation then incorporated the importance of normalised weights for each element and components to calculate an overall PEB compliance. PEB compliance is ranged between 0 and 100, where 0 is an identification for a poor process and 100 defines a highly reliable process.
To determine the acceptable variation in the process, upper and lower specification limits were determined.21 By integrating the normalised weights in the bundle calculation, the lower specification for reliability in the process was determined to be at least above 0.5 or 50% and reliability increases as PEB compliance increases up to 1 or 100% which is the upper specification limit.
Specification limits aided sites in designing improvement strategies to improve PEB compliance. Graphical analysis and hypothesis testing using χ2 or t-test enabled sites to determine key drivers of patient dissatisfaction within the bundle elements. Site-specific improvement strategies were developed and implemented to address the key drivers of patient dissatisfaction. Post-surveys were employed after improvement strategies focused on key drivers of dissatisfaction were implemented. Examples for solutions implemented at multiple sites for the PEB components are as follows: (1) To improve communication, structured interdisciplinary rounds, communication checklists, printed patient-specific education materials and patient care cards were implanted. The care cards, as shown in figure 3, help to organise the overwhelming amount of information that is provided to patients and families about the patient’s progress from multiple members of the care team. The cards also accompany the patient from the ED to the inpatient unit providing an additional resource for communication. (2) To improve logistics, standard hand-off processes and medication timers were used. (3) To improve basic needs/comfort, standard bed make-up, par levels for pillows, comfort kits and enhanced dietary options were implemented. (4) To improve environment, scripted privacy screens, established quiet hours and an escalation policy for temperature control were implemented.
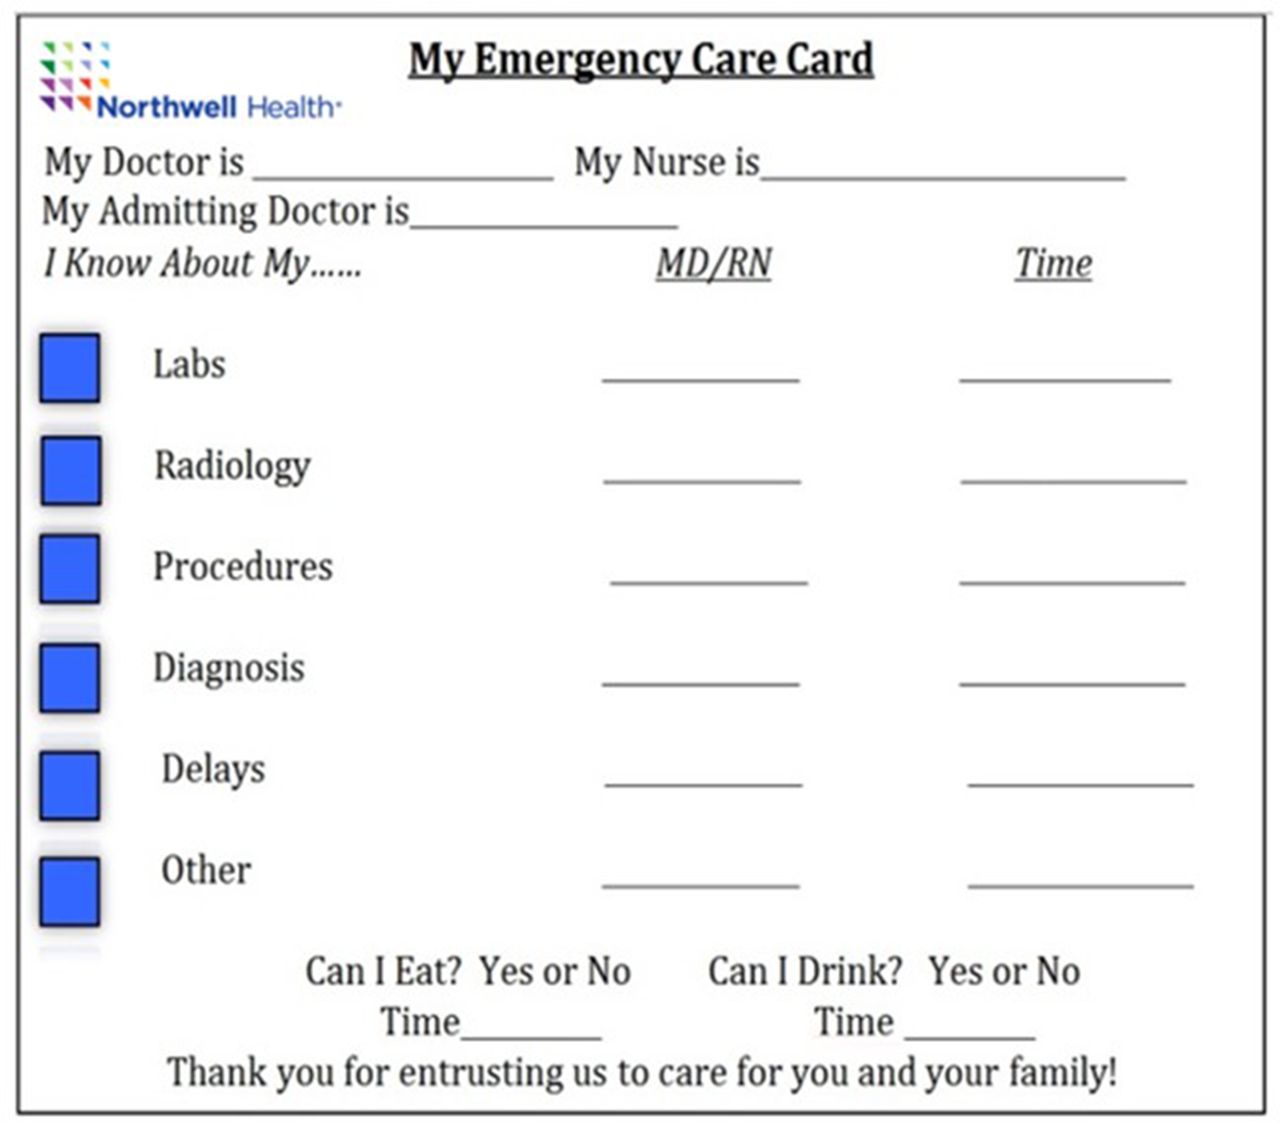
Book of Solutions example to communicate patient status. MD, medical doctor; RN, registered nurse.
To validate and expand the model, in the second phase, the qualitative data from experts and quantitative metrics were collected and analysed from an additional five sites incorporating three inpatient units and two additional EDs. The five additional sites included community as well as tertiary hospitals which ranged from 136 to 711 beds. The five additional diverse teams included similar roles to the first cohort in their team who developed individual site driver diagrams with corresponding relationship matrix. The second cohort demonstrated the same elements of dissatisfaction were present on the inpatients units that had been found on patients in the holding in the ED. Furthermore, when developing the weights for the individual elements using the method previously described, it was found there was no statistically significant difference in the weight established between cohort 1 and 2.20 22 23
In the third phase, a Quick Start Programme was developed using a standard patient experience survey and calculating PEB compliance using the established weights validated from the previous two cohorts. As the name may reveal, the new cohort used the validated concepts and findings to make fast, but effective improvements in their processes. The diverse teams in each site, which included EDs, inpatient units and a maternity unit, administered the standard surveys, established by the previous cohorts, for a 1-month period to collect data. Key drivers of dissatisfaction were determined by graphical and statistical analysis. Finally, sites used a compiled collection of improvements that were implemented by the first two cohorts organised conveniently in a ‘Book of Solutions’.
Results
Success was measured through the relationship between PEB compliance and PG LTR. In the first stage of this project in 2015, the PEB compliance score, PG LTR scores and the trend analysis were used to build the model. The first five tertiary EDs’ baseline average PEB compliance score was 51% ranging from 42% to 67%. After implementing process improvements focused on the issues identified by the PEB, their PEB compliance improved to an average of 82.5%, ranging from 78% to 93%. Those improvements also resulted in increasing the PG LTR scores from an average of 64.73%, ranging from 60.3% to 70.3%, to an average of 74.64%, ranging from 62% to 76.9%. The data showed that the trends in improving PEB compliance are followed by meaningful changes in PG LTR scores as shown in part a of figure 4. Facilities which demonstrated the largest increase in PEB compliance saw the biggest jump in PG LTR scores. During the sustainability period, sites with high PEB compliance and increased variation, demonstrating poor reliability, noted a decrease in PG LTR scores. In facilities where variation fell and then increased, PG LTR scores fluctuated in coordination, even when average PEB compliance remained stable or improved.
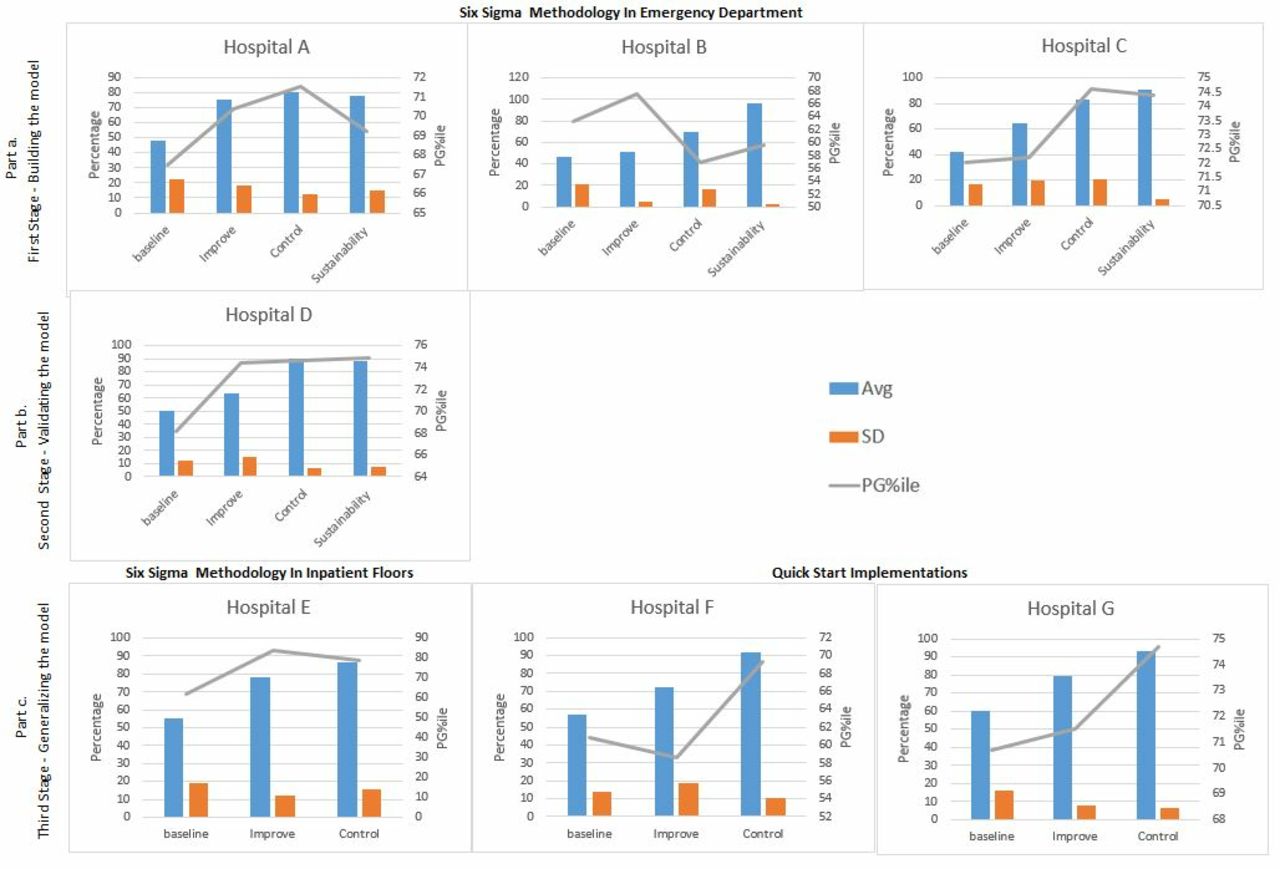
The bar graphs demonstrate the relationship between the Patient Experience Bundle (PEB) and Press Ganey Likelihood to Recommend (PG LTR) percentile score (PG LTR%). Part a, building the model shows a positive relationship between bundle compliance and PG LTR%. As PEB compliance increases, scores for PG LTR increase. When bundle compliance variation increases demonstrating increase process variability, PGLTR% decrease. Part b, validating the model demonstrates the same relationship between the PEB and PG TLR% on inpatient units. Part c demonstrates the validity of the Quick Start Programme.
In 2016, the second phase shown in figure 4, two EDs and three inpatient unit’s metrics were used to validate and generalise the model. The baseline average PEB compliance score for these hospitals was 62.5%, ranging from 55% to 80%. After implementing process improvements around the issues identified by the PEB, their PEB compliance improved to an average of 80.6%, ranging from 70% to 95%. Similarly to the first cohort of hospitals, their PG LTR scores improved from an average of 59.66%, ranging from 33.3% to 73.1%, to an average of 69.5%, ranging from 66.3% to 77.5%. The data from this second cohort of sites not only validated the relation between the PEB model and PG LTR scores but also demonstrated that the model can be used in inpatient units as well as the in EDs as shown in part b and part c-hospital E of figure 4.
The third phase in 2017, shown in figure 4, focused on generalising and implementing the PEB model in more hospitals, including a maternity unit, in an optimised timeline. Applying the Quick Start Programme, PEB model effectiveness was ensured by observing the same pattern in the data and correlation between the PEB compliance and the PG LTR scores.
In order to insure sustainability, sites submit quarterly pulse checks which include control charts for PEB compliance with accompanying action plans to address trends and outliers to the Chief Operating Officer for the Health System. A yearly ‘Bring Back Day’ is held in which the sites present to senior leadership presentations that include graphs of PEB compliance, PG LTR scores, summary of improvements implemented, lessons learnt, and next steps. The Book of Solutions is updated periodically to reflect additional solutions implemented during ongoing monitoring of PEB compliance.
Discussion
Healthcare executives and operational leaders struggle with supporting multiple system initiatives within their organisation.24 Strategic goals developed within divisions or service lines use their own metrics to gauge success and are not communicated across the organisation. Historically, the processes around food, pillows, communication and turnaround time have been measured as individual elements.25 The concept missing in this strategy is rolled throughput yield. Rolled throughput yield gives a holistic perspective to the processes where a process with more than one step would be less probable to result in a defect-free service. When we look at patient experience as a continuous process, incorporating all these elements even if the yield or percent of time we meet the patient expectations for each of these elements individually is 90%, the role throughput yield (0.90 × 0.90 × 0.90 × 0.90) is equal to 66% which translates to 34% of the time we are missing the mark on these key elements for our patients or our process is not reliable. With approximately 307 000 system-wide discharges annually, this amounts to 1 04 380 potentially dissatisfied patients in the Northwell Health System. Creation of the PEB demonstrates that in order to improve PG LTR, it is necessary to perform all elements in the bundle to provide a positive patient experience as shown in figure 5. The elements of the bundle apply to any unit within a healthcare facility because the focus is on processes which meet the most fundamental needs of the patient. These needs include communicating the plan of care, providing basic items of comfort like food, pillows/blankets, creating an environment which respects privacy, timely delivery of medication administration and patient-centred rounding. PG LTR scores are an outcome metric calculated from patient survey responses that are typically on either end of the spectrum: very satisfied or dissatisfied. Therefore, these surveys may or may not represent the experience of the entire patient population and be useful to direct process improvement efforts. In addition, PG LTR scores are not collected in real time and not specifically tied to processes.26 27 The PEB compliance metric is a real time, process driven measure that includes all the patient population. Instead of measuring process elements separately, the bundle enforces the concept of the interaction between the processes with their associated weights to collectively drive outcomes. The PEB is a proactive approach, versus a traditional service recovery approach for patient satisfaction, that captures the patient experience at the time of service and links it to process improvement on the unit.28–30 In order to spread the PEB to additional sites without the extensive time commitment or Six Sigma training, the Quick Start Programme was developed. The programme was developed and modified to be user-friendly for participating employees with already burdened schedules so that it could be assimilated into pre-existing workflows with minimal interruption. Standard patient surveys and an Excel template for data collection with associated formulas that automatically calculated PEB compliance are distributed. Finally, the Book of Solutions, based on prior solutions that were successfully implemented at other sites using the PEB, can provide improvement ideas for community or tertiary hospitals in EDs, inpatient or maternity units.

The Patient Experience Bundle diagram was used to explain the bundle concept to front-line staff as a change management tool. It is a pictorial display showing that in order to effect change in a patient’s customer experience, it is necessary to complete all elements of the bundle.
Limitations and next steps
One of the initial limitations of this work is manual data collection. Initially, a site resource spent approximately 60 min/week to manually enter paper surveys onto an Excel data sheet for further analysis in addition to the daily rounds. Moving forward, the plan is to combine electronic survey data collection with ‘behind the scenes’ PEB compliance calculation, therefore eliminating the current necessary step of manual data entry into the Excel macro bundle calculator, along with development of automated graphical analysis readily available via an organisational wide dashboard. Achieving these goals will make utilisation of the PEB seamless to front-line care providers, enabling the implementation in all units within a hospital. Live dashboards will provide real-time awareness of patient experience, providing instant awareness of areas of opportunities for process improvement. A total of 2758 patients were surveyed over 2 years. The authors strongly believe that the accuracy of prediction and the relationship between PEB compliance and PG LTR will significantly improve as the number of surveyed patients increases.
Patient satisfaction, once considered a ‘soft’ indicator used primarily by marketing departments, has become an integral component of healthcare quality management and pay for performance measures. Review of the literature suggests that patient and customer surveys have questionable validity and reliability.31–34 Patient satisfaction scores do not correlate with improved quality of clinical care.35–37 This study’s focus was on the patient’s perception regarding their experience with the medical care system and not on the quality of clinical care, which is a limitation of the study.38 The goal of the PEB is to create a service improvement culture through rounding with a scripted survey to improve service delivery which will drive satisfaction and quality. In order to eliminate a response bias, the PEB survey is administered verbally, which may not solicit accurate or thorough information due to loss of anonymity, timing or fear of the impact on care being delivered.39 However, the personal approach does convey to the patient an interest and desire to meet individual needs and eliminates the response bias by age and gender encountered with mail/emailed surveys.31 The initial Six Sigma study, which established the bundle elements and weights, was resource intensive. Team members attend 13 days of class to learn the Six Sigma methodology and spent approximately 15% of their time working on the deliverables for each phase of the methodology. The development of the Quick Start Programme has allowed several additional sites to implement the PEB with minimal interruption to the current workflow. Additionally, the creation of the Book of Solutions complied improvement strategies, proven for each bundle element from past participants, and accelerated implementation and the sharing of best practices across the organisation. Cost for implemented improvement strategies was minimal. Sites utilized available technology that is, Cipher Health’s Orchid rounding tool to enhance their improvements. The majority of cost includes the printing costs which was negligible.
Conclusion
Although it is routine to measure individual processes to improve the patient experience, patients do not view these as separate events, but rather as a collection of encounters that determine the patient’s perception of his or her experience. The foundation of this work is built on identification of common specific elements of care that impact patient satisfaction and detailed mathematical analysis of the relationship between factors. When coupled with the bundle concept, these improvement efforts drive outcomes when all elements are performed with high reliability. The PEB promotes change management by bringing together multidisciplinary teams changing the perspective from individual roles to group collaboration. Current patient satisfaction assessment results are delayed 2–3 months, making it difficult for hospitals to assess standings and evaluate process improvement initiatives in real time. The PEB provides an advantage by real-time feedback with concurrent review on how process improvements are impacting patient satisfaction giving facilities a competitive edge with increasing brand loyalty. Implementing the PEB will improve all facility scores, regardless of starting position: low-performing sites move to the middle of the distribution, mid-tier sites are able to springboard to the upper tiers and top-tier achieve and sustain 90th percentile and higher ratings.
References
Footnotes
Contributors NBR designed the study. SN developed the mathematical model. GR, CM, AH, NBR and SN developed the survey and performed the analysis; RC facilitated the SME in selection of the bundle elements; MD sponsored the project. All authors have read and approved the final manuscript.
Funding The authors have not declared a specific grant for this research from any funding agency in the public, commercial or not-for-profit sectors.
Competing interests None declared.
Provenance and peer review Not commissioned; externally peer reviewed.
Data sharing statement No additional data are available.
Patient consent for publication Not required.