Article Text

Abstract
Monitoring of chronic conditions accounts for a significant proportion of blood testing in UK primary care; not all of this is based on evidence or guidelines. National benchmarking shows significant variation in testing rates for common blood tests. This project set out to standardise the blood tests used for monitoring of chronic conditions in primary care across North Devon, and to measure and reduce the harms of unwarranted testing. Chronic disease test groups were developed in line with current guidelines and implemented using one-click electronic test ordering systems. The main difference from previous general practitioner practice algorithms was removing the requirement for full blood count and liver function test monitoring for many conditions. Baseline harms of testing were measured and included significant costs, workload and patient anxiety. By defining the scale of the problem, we were able to leverage change across several cycles of quality improvement, using a pathology optimisation forum for peer-led improvement, and developing a framework focusing on what matters to patients. Overall primary care testing rates in North Devon fell by 14% for full blood count testing and 22% for liver function tests, but without a reduction in the number of tests showing possible significant pathology. We estimate that this has reduced testing costs by £200 000 across a population of around 180 000 people and has reduced downstream referral costs by a similar amount. Introduction of simple chronic disease test groups into primary care electronic ordering systems, when used alongside engagement with clinicians, leads to both quality improvement and reduction in system costs.
- pathology
- information technology
- chronic disease management
- primary care
This is an open access article distributed in accordance with the Creative Commons Attribution Non Commercial (CC BY-NC 4.0) license, which permits others to distribute, remix, adapt, build upon this work non-commercially, and license their derivative works on different terms, provided the original work is properly cited, appropriate credit is given, any changes made indicated, and the use is non-commercial. See: http://creativecommons.org/licenses/by-nc/4.0/.
Statistics from Altmetric.com
Problem
The laboratory at North Devon District Hospital undertakes about 5.5 million tests per year for a population of approximately 180 000. A large proportion of this activity, for example, over 50% of biochemical tests,1 is for the ongoing monitoring of chronic diseases in primary care, rather than for population health screening or diagnostic purposes. While some of this is supported by evidence-based guidelines, this is not universally the case, and a significant number of these tests may be unnecessary.2
A review of the content of chronic disease monitoring recommendations for the 20 general practices in North Devon found that no two practices recommended the same set of tests. For example, the National Institute of Health and Care Excellence (NICE) guidance on lipid modification for the prevention of cardiovascular disease states that liver transaminase enzymes (usually alanine aminotransferase [ALT]) should be measured before starting a statin for lipid reduction, then at 3 and 12 months after starting. Unless clinically indicated there is no need to continue ALT monitoring.3 Despite this, 19 out of 20 General Practitioner (GP) practices in our locality included monitoring of ALT on an annual basis for patients on statins. Similarly, all but one practice included full blood counts (FBCs) in their chronic disease monitoring protocols, which are not part of NICE recommendations. Testing without a clear clinical rationale moves into the realm of de facto screening for occult disease. Such practice requires evaluation in context to ensure that benefits outweigh harms.4 In the absence of such evidence, we felt that the large amount of potentially unwarranted testing in chronic disease monitoring could be leading to patient harm.
In 2012, there were 81 465 primary care requests to the North Devon laboratory that generated at least one result that was outside a reference limit in FBC or liver function test (LFT). Approximately 25% of these came from requests that could easily be identified as part of chronic disease monitoring. As a preliminary exercise, we examined the consequences on primary care workload of an ALT result outside reference ranges arising from chronic disease monitoring. We reviewed the case notes of 45 patients with chronic disease from two practices in whom the ALT was above the reference range:
Thirty-four patients had the ‘abnormal’ result filed with no further action.
Seven patients had the test repeated, which was within the reference range.
Four patients were seen again in a GP appointment to discuss the results.
One patient received an ultrasound of the liver, identified as fatty liver (adding nothing to the management of a patient who could be seen to be obese).
One previously well patient saw the GP 14 times in 1 year, with multiple repeat tests. One patient had several GP appointments and referral for further investigation. Neither of these patients had significant pathology that altered management.
We looked for secondary care referrals in the year prior to implementation of test groups from a single pilot practice (list size 11 000 patients) that were generated as a result of an FBC that had been requested as part of chronic disease monitoring. We identified seven patients who fitted these criteria. These generated one haematology appointment, four gastroenterology appointments, one MRI head scan, one CT of the colon, four gastroscopies and four colonoscopies. Two patients did not attend their appointments. No significant pathology was found in any patient. Two patients had benign polyps.
The estimated cost of these investigations is about £10 000. Extrapolating to our locality, the cost would be £200 000.
We interviewed a patient who described the effect on her life of detection of an incidental mild anaemia, and as a result produced a video in which she describes her experiences.5 Other cases showed how a mildly elevated ALT can turn a citizen who is an infrequent user of medical services into a patient with high levels of dependence with multiple follow-up appointments. At one extreme, a patient had 14 follow-up appointments within a year, despite having no symptoms that would have suggested the need to check liver function in the first place. Another patient eventually stopped attending secondary care referrals as they were becoming so anxious about the investigations that had been put in train from a result just above the ALT reference range.
Background
Approximately 80% of patient interactions with the National Health Service (NHS) involve pathology services, equating to about 200 million requests per year.6 The NHS Atlas of Variation has demonstrated significant geographical variability in primary care pathology testing rates in the UK,7 which cannot be accounted for by differences in sociodemographic or other descriptive indicators of GP practices.8 There is a large body of literature which has evaluated strategies to improve the ‘appropriateness’ of blood tests, which has mostly been defined in terms of reduced testing rates or improved adherence to guidelines. These have included a variety of educational interventions,9 10 feedback,11–13 peer management,14 use of computer prompts,15 decision support tools16 and information about the costs of testing.17 These factors have been systematically reviewed.18–20
The potential for diagnostic tests to cause harm is increasingly recognised, and has led to the ‘Choosing Wisely’ initiative.21 A significant proportion of primary care testing arises from chronic disease monitoring, which is partially due to the requirements of achieving payment via the quality and outcomes framework (QOF) of the General Medical Services contract, which was introduced in 2004.22 Most chronic diseases listed in QOF require some element of blood monitoring, usually on an annual basis. There is, however, little or no requirement to ensure that this monitoring is confined to tests that are necessary and sufficient to provide care.
Similarly, laboratory accreditation processes tend to focus on internal quality issues (eg, traceability of reagents) that do not reflect the impact, either positive or negative, of testing on patients. This suggested that our current definitions of success (eg, laboratory accreditation and compliance with QOF) might not necessarily reflect what matters to patients.
Design
This programme had a number of aims:
Describe the harms associated with the current approach to testing.
To standardise the blood tests used for chronic disease management across North Devon starting from the position of defining what would constitute ‘necessary and sufficient’ testing for a particular patient.
Derive an improvement framework based on engagement and that promotes a shift from an ‘inside out’ view (seeing success from the perspective of the laboratory) to an ‘outside in’ view (seeing success from the perspective of the patient).
To begin to explore what matters to patients undergoing diagnostic tests, we interviewed a small number of patients attending routine phlebotomy clinics. We found that, in general, although patients trusted healthcare professionals to keep them safe and well, they were not aware of what tests were being done. In addition, we found that patients wanted testing to tell them if they were ‘normal’, and if not, what needed to happen to return them to ‘normal’.
These findings are in line with larger studies23 and from these we derived a universal purpose statement that we felt reflected the purpose of laboratory medicine:
To help citizens, and their carers, make informed decisions about their care.
We call this an ‘outside-in’ view of how we might judge the success of laboratory medicine, in contrast to the ‘inside-out’ view which would define success according to criteria such as cost and the meeting of internally derived standards (eg, turn around times).
Our initial work showed us that the current environment was not meeting this purpose. We met patients who had received results for tests they did not know were being done, and conversely met patients who had gained false reassurance from tests that had not been done. We saw numerous examples of tests that were not necessary to answer the clinical question being asked, often leading to significant harm from ‘treating the result’. Conversely, we saw evidence of delayed and suboptimal decision-making due to a failure to carry out appropriate tests. Results generated by the laboratory were often presented in ways that obscured meaning and were prone to being misunderstood. In addition, results tended to reflect what is normal for a population. They rarely told us what is abnormal for the individual.
In order to address these issues and help ascertain whether service is optimally focused on the needs of the individual patients, we designed the ‘Clean Framework’. This includes three main points of focus, framed from the perspective of the patient, that each incorporated elements that we felt would have to be true, regardless of the specific clinical context.
Clean in
There is a well-formulated clinical question from which is possible to derive ‘necessary and sufficient testing’.
The request arrives at the point of testing in a state that allows the question to be answered.
Clean through
The consistency (or uncertainty) of the answer is described.
The answer is available in time to answer the question.
Clean out
Results are meaningful and helpful.
Within the context of shared understanding of what matters to the life of the individual.
We developed a set of ‘test groups’ for primary care clinicians to use when ordering tests to monitor patients with a number of chronic diseases, particularly for QOF annual reviews. They were designed to ensure that only tests that were necessary and sufficient to provide an answer to the clinical question were included. We found it helpful to reframe problems as clinical questions as they would be seen from the perspective of the patient. For instance, the purpose of annual blood monitoring in patients with hypertension might be to ask, "Are my kidneys OK? Is there any evidence I am suffering side effects from my medication?" From this, we can see that the tests that would be necessary and sufficient to answer these questions would include only a renal profile (sodium, potassium, creatinine and estimated glomerular filtration rate). This ‘outside-in’ approach provides a useful touchstone for interdisciplinary discussion about what constitutes necessary and sufficient testing that often resolves conflict.
For chronic disease monitoring, what constitutes necessary and sufficient testing to help answer the clinical question can be derived largely from NICE guidance. It is noteworthy how little of this guidance is based on robust evidence, and this often led to disagreement within the core project team about the role of some specific tests that were not recommended in some clinical contexts but that were traditionally requested. This was particularly true for FBCs and LFTs. It was notable that, although these were developed using best practice guidance, including NICE guidance where possible, the test groups tended to have fewer tests for chronic disease monitoring than the previous practice-derived groups, particularly with regard to FBC and LFT. We then set out to implement these test groups across the locality, and thereby reduce the variation of test protocols across the locality.
Strategy
Plan, Do, Study, Act (PDSA) cycle 1: developing monitoring measures and pilot study
To test acceptability of our test groups to a wider group of healthcare professionals, we initially introduced chronic disease test groups to the two practices of the GPs on the project team.
Lead GPs in each practice ensured that all staff were aware of the intervention. The laboratory IT team worked closely with healthcare assistants to ensure they could request the test groups using a single click in the primary care electronic ordering system. In both pilot practices, there was a rapid and significant fall in haemoglobin and bilirubin requesting rates (figure 1A and B). We concluded that test groups were an effective and acceptable way of improving test ordering.

Monthly test requests for haemoglobin and bilirubin for chronic disease monitoring in pilot practice 1 (A) and 2 (B).
PDSA cycle 2: using electronic ordering to rollout test groups at scale
Based on the findings of the pilot study, we released the test groups to all practices. We developed presentations to show the variation in current practice, the harm caused by current approaches to testing, the rationale for test groups and the effect of test groups on requesting volumes in pilot practices. We gave a talk to North Devon GPs in a half day educational forum.
We found that GPs were very supportive of the testing protocols and we had good feedback on the approach. However, over the next 3 months we saw only a slight drop in testing requests. To understand the barriers to implementation, we visited practices to discuss with GPs, nurses and healthcare assistants (HCAs). We found that in some practices (including pilot practice 2), the HCAs and nurses were using the protocols but adding back on the usual tests that they had been requesting for years. This can be seen, for instance, in the haemoglobin data from pilot practice 2 (figure 1A). They had thought that test groups had been introduced purely to save money. In other practices, even though clinicians were keen to use the protocols, the internal practice systems had not been changed. This requires time and commitment and they had other priorities.
We concluded that our laboratory data were a good way to monitor uptake and target interventions. In our experience, didactic events are rarely effective ways of delivering sustained change across a whole health system and it was important to design new forums for dialogue that involve the whole healthcare team. Furthermore, implementation of new practice requires strong local clinical leadership and that this is likely to need significant practical support.
PDSA cycle 3: creating a pathology optimisation forum for peer-led improvement
Based on findings from the second cycle, we set up a pathology optimisation forum for practice HCA and GP leads to provide peer-led learning with input from laboratory staff. We managed to secure funding to release these people for a half day event every quarter.
At our first forum, we discussed practice uptake by showing data on haemoglobin and bilirubin test volumes by individual practice. This showed a drop in testing in 8 practices, but that 12 practices still did not appear to be using the protocols. There was discussion about barriers to implementation and we discovered a number of themes:
Doing the right thing for patients and reducing workload are the key drivers for clinicians in primary care.
A reluctance to let go of previous individual practice protocols.
A worry that new diagnosis could be missed.
Not appreciating the harm that can occur from de facto screening.
Concerns about the rigour of the evidence review.
We were challenged to add a test (thyroid function) that was deemed missing from a testing protocol (new diagnosis of type 1 diabetes). We reviewed the updated NICE guidance on this topic, which suggests thyroid-stimulating hormone is measured at annual review in these patients. As a result, we changed the test group, improving on our initial work, increasing ownership outside of the project team and demonstrating how this approach facilitates keeping testing algorithms up to date.
We were challenged to remove annual cholesterol testing from cardiovascular protocols, which would be in line with NICE guidance. However, we chose to keep this in test groups as this was an area that many felt uncomfortable with, and we felt could be an additional barrier to change when there was still some reluctance to let go of FBC and LFT.
PDSA cycle 4: responding to feedback with patient stories and test requesting data
At the next meeting of the pathology optimisation forum, we aimed to address the concerns raised at the initial meeting. We presented stories of how unnecessary testing leads to harm. The most potent example of this can be seen in the video of a patient with incidental detection of anaemia. We showed our data on how unnecessary testing creates additional workload. We showed that reductions in liver function testing had not significantly reduced the detection of pathologically raised ALT, suggesting that we were not missing disease.
Talking, listening and bringing back further information to the forum levered the biggest change during implementation. In the following months, we saw the biggest drop in test requesting as a further 10 practices implemented the testing protocols. This left just two practices that were not consistently using test groups. These two remaining practices may need individual practice meetings to further discuss and understand local barriers.
Measurement and analysis
We used laboratory requesting data for these tests to undertake an interrupted time series analysis to identify whether our interventions changed testing rates. We analysed the following, using the main rollout in September 2014 as the intervention date:
Sodium as a marker for renal monitoring as these profiles were unaltered.
Haemoglobin as a marker test for FBC.
Bilirubin as a marker test for LFT.
ALTs≥120 IU/L in order to measure rates of identification in possible significant pathology was altered by the intervention. This is the level at which statin therapy should be stopped.24
Results
In 2012, blood tests that could be easily identified as part of chronic disease monitoring from clinical details accounted for 26% of renal profiles from primary care; 18% of FBC requests from primary care and 26% of LFTs from primary care. The rolling annual average test volumes for chronic disease per 1000 registered patients in North Devon are shown in figure 2.
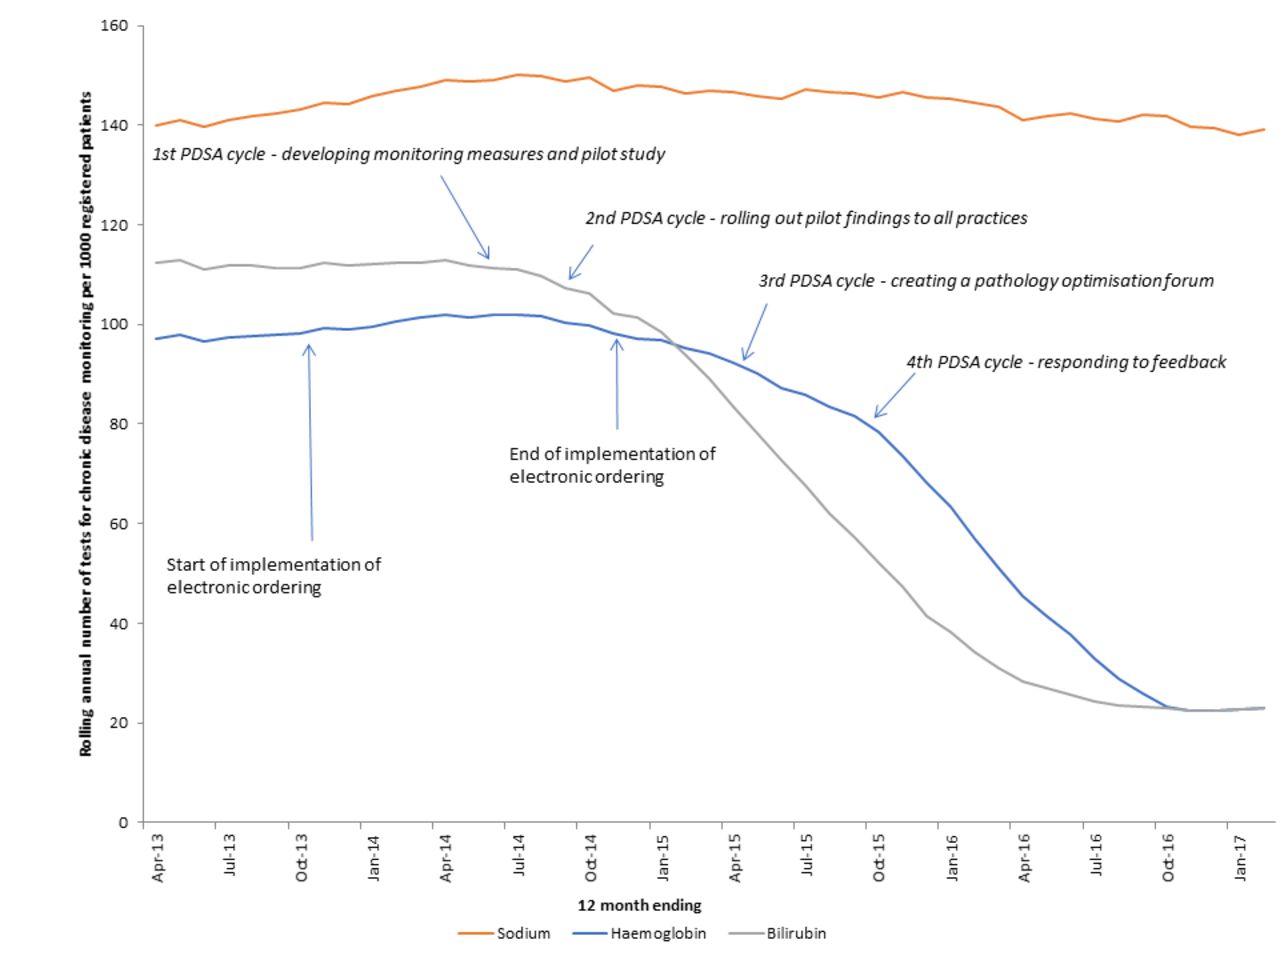
Estimated changes in common analyte requests for chronic diseases between April 2012 and March 2017 (rolling annual test volumes).
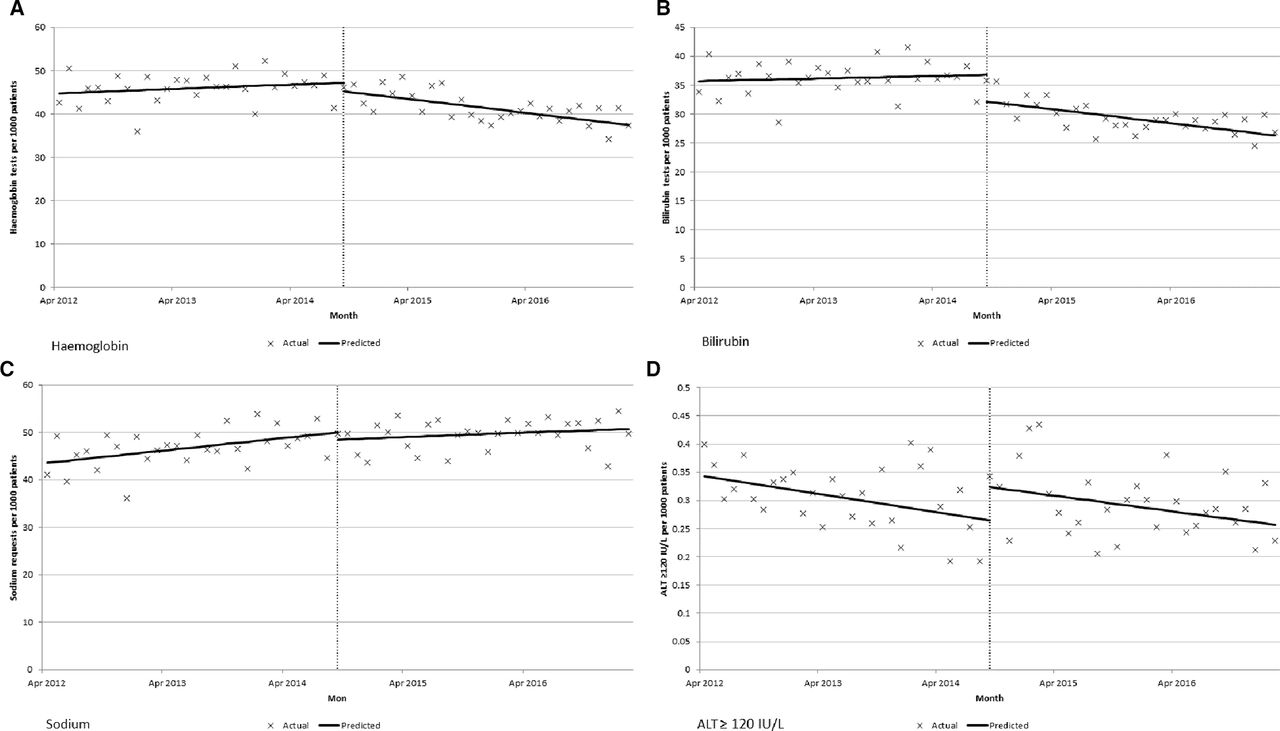
The effects of the interventions are clearly visible (figure 3).
Interrupted time series analysis. (A) Haemoglobin tests per 1000 patients, (B) bilirubin tests per 1000 patients, (C) sodium tests per 1000 patients, (D) alanine aminotransferase (ALT)≥120 IU/L results per 1000 patients.
Haemoglobin
Before the rollout haemoglobin test requests were stable (0.084; 95% CI −0.076 to 0.244). Following the rollout there was a clinically and statistically significant downward change in gradient (−0.350; 95% CI −0.546 to −0.154), with the rate of haemoglobin requests reducing from 555 requests per 1000 patients in 2013 to 476 per 1000 patients in 2016, a 14% decrease (figure 3A).
Bilirubin
Before the rollout bilirubin test requests were stable (0.037; 95% CI −0.097 to 0.170). Following the rollout there was a clinically and statistically significant downward change in gradient (−0.239; 95% CI −0.404 to −0.074), with the rate of bilirubin requests reducing from 436 requests per 1000 patients in 2013 to 338 per 1000 patients in 2016, a 22% decrease (figure 3B).
Sodium
Before the rollout there there was a small rise in sodium requests (gradient: 0.221; 95% CI 0.054 to 0.387). Following the rollout there was no significant change in gradient (−0.142; 95% CI −0.364 to 0.080), with the rate of sodium tests increasing from 563 sodium tests per 1000 patients in 2013 to 601 sodium tests per 1000 patients in 2016; a 6.7% increase (figure 3C). This was in line with secular trends.
ALT≥120 IU/L
Before the rollout there was a very slight downward change in ALT results ≥120 IU/L (gradient: 0.0027; 95% CI −0.0052 to −0.0002). There was no significant reduction following the 2013 rollout (gradient: 0.0004; 95% CI −0.0031 to 0.0040), with the rate being 3.4 per 1000 patients in 2016 (figure 3D).
Approximately 95% of primary care requests to our laboratory are now received electronically. Using laboratory cost data, we can estimate that our intervention has reduced marginal (or reagent only) costs by approximately £18 000 per year. However, using NICE reference costs,25 this is nearer to £200 000 reduction in actual annual testing costs.
Lessons learnt
We have shown that it is possible to create a framework for quality improvement in diagnostic medicine that is focused on what matters to patients, and can be used to deliver large and important improvements in service delivery. At the beginning of the project we saw that, in the absence of clear clinical reasons to test, there is the potential to cause harm which adversely affects patients and increases costs and workload across the healthcare system. There is also the risk that the signal of significant pathology becomes lost in the noise of incidental, clinically irrelevant findings. We have found that clinicians learn to ignore mildly abnormal results, as most are inconsequential and derived from testing that is not necessary. However, this learning process occurs at variable rates and will be highly clinician dependent, leading to an inconsistency in approach.
The framework helped identify the issues that exist across service boundaries, and led to a increase in collaboration across the system. Creating a discussion forum facilitated peer-to-peer interactions, allowed sharing of success and provided support and challenge to any proposed changes. Patient stories can be powerful, but we believe the validity of these are enhanced through use of additional information to reassure people that changes are safe. Measuring potential harms of ‘missed diagnoses’ through reduced testing is challenging. However, we saw no significant reduction in either sodium levels (where profiles had not be altered) or the number of ALT results that are commonly believed to need further investigation (three times upper limit of normal). This suggests that the framework does not increase the risk of a missed diagnosis.
We are starting to use our framework to develop more rational approaches to the use of tests for diagnosis of illness. This is a significant challenge: evidence and guidance is usually even more sparse while practice is often highly variable, as are the wishes and needs of patients. We will need to embrace methods of shared decision making that facilitate true partnership working between clinician and patient, recognising that ‘one-size-fits-all' approaches are likely to lead to disenfranchisement.26 We are also exploring how other aspects of the Clean Framework can be used to improve care, and have begun to see improvements in a number of areas, including specimen stabilisation, measurement of uncertainty, definitions of timeliness and reporting of results to patients. However, in all cases we have found that a focus on ‘clean in’ is a key initial step of any improvement work, as well as sustaining change. We have continued with the pathology optimisation forum and have continued to co-create guidelines and review test groups where necessary, as well as to discuss other barriers to improvement. We believe that this continued engagement has led to sustained improvement, although we are yet to quantify the benefits.
Limitations
One limitation was the lack of robust evidence on which to base our chronic disease test groups. Although we used NICE guidelines to ensure chronic disease test groups were in line with current recommendations, we do not formally know these are necessary and sufficient to answer the clinical question. Therefore, although this seemed the best starting point, areas of uncertainty persisted. For example, annual cholesterol testing for cardiovascular profiles was included, which was not strictly required based on NICE guidelines, but that felt important to get local clinical ‘buy-in’. We believe more research is needed in this area. In addition, our demonstrable continuous review of the basis for our test groups was an important part of gaining clinical acceptance and provides a level of governance that individual practices would find hard to sustain.
Although we interviewed patients in order to identify problems, due to team resource we were not able to undertake a patient satisfaction survey. We will consider undertaking this as part of future improvement cycles.
Conclusion
A systematic approach that aligns the use of common blood tests to valid clinical questions has produced significant reductions in cost, workload and harm, without a corresponding reduction in the identification of significant pathology. This has led to an overall improvement in service quality. Our methodology is now embedded into the culture and governance processes of both the local laboratory and primary care, ensuring sustainability.
We suspect that chronic disease ordering elsewhere will, in the main, include FBC and LFT. If this is the case, then they should be able to replicate these results. However, we would be wary of suggesting that these gains could be delivered by simple implementation of test groups in electronic ordering. This was just part of a wide and deep engagement process. In summary, we believe the following actions were key to success of our work:
Creating a forum for dialogue and co-production involving all stakeholders.
Using what matters to people, including patient stories, as the foundation for engagement.
Using data to discover problems, while recognising the limitations inherent in analyses.
Creating tight feedback loops with an open learning culture.
Understanding the needs of stakeholders.
Making it easy to do the right thing.
References
Footnotes
Contributors DW, RC, AB and TL conceived the study, and conducted parts of the intervention. AJW, TL and RC undertook the analysis of the data. DW, RC, JW, AB, AJW and TL all contributed to the manuscript.
Funding The authors have not declared a specific grant for this research from any funding agency in the public, commercial or not-for-profit sectors.
Competing interests AB is owner of a commercial management consultancy, which has worked with NHS Northern, Eastern and Western Devon CCG and Northern Devon Healthcare NHS Trust on pathology optimisation.
Provenance and peer review Not commissioned; externally peer reviewed.
Patient consent for publication Not required.