Article Text

Abstract
Managing pain is challenging in the intensive care unit (ICU) as often patients are unable to self-report due to the effects of sedation required for mechanical ventilation. Minimal sedative use and the utilisation of analgesia-first approaches are advocated as best practice to reduce unwanted effects of oversedation and poorly managed pain. Despite evidence-based recommendations, behavioural pain assessment tools are not readily implemented in many critical care units. A local telephone audit conducted in April 2017 found that only 30% of Scottish ICUs are using these validated pain instruments. The intensive care unit (ICU) at Raigmore Hospital, NHS Highland, initiated a quality improvement (QI) project using the Model for Improvement (MFI) to implement an analgesia-first approach utilising a validated and reliable behavioural pain assessment tool, namely the Critical-Care Pain Observation Tool (CPOT). Over a six-month period, the project deployed QI tools and techniques to test and implement the CPOT. The process measures related to (i) the nursing staff’s reliability to assess and document pain scores at least every four hours and (ii) to treat behavioural signs of pain or CPOT scores ≥ 3 with a rescue bolus of opioid analgesia. The findings from this project confirm that the observed trends in both process measures had reduced over time. Four hourly assessments of pain had increased to 89% and the treatment of CPOT scores ≥3 had increased to 100%.
- quality improvement
- pain
- Critical Care
- Control charts/run charts
- quality measurement
This is an open access article distributed in accordance with the Creative Commons Attribution Non Commercial (CC BY-NC 4.0) license, which permits others to distribute, remix, adapt, build upon this work non-commercially, and license their derivative works on different terms, provided the original work is properly cited, appropriate credit is given, any changes made indicated, and the use is non-commercial. See: http://creativecommons.org/licenses/by-nc/4.0/.
Statistics from Altmetric.com
Problem
The quality of pain assessment and management in the context of the critically ill patient is a challenging problem. The inability of the patient to self-report pain is common as patients are usually sedated for mechanical ventilation.1Whilst validated and reliable behavioural pain assessment tools are recommended in the literature, these tools are not widely used in the ICU. When pain assessment is regularly undertaken, it is observed that patients require less sedation.2
Raigmore Hospital in Inverness is an acute general teaching institution situated in the Highlands of Scotland. The Highland region has a population of around 234 770 and the hospital provides 442 beds. The ICU has seven beds and admits an average of 32 patients per month. To address the gap in clinical practice, the aim of this QI initiative was to improve the way in which pain would be assessed, treated and prevented in patients requiring sedation and mechanical ventilation. This would be achieved by implementing the CPOT, a validated pain assessment tool that promotes treatment of significant pain with rescue administration of opioid analgesia before resorting to sedatives.
The CPOT was commenced on 20 March 2017 with the aim that by 30 June 2017, all sedated and mechanically ventilated patients would have regular systematic assessment and treatment of pain.
Background
The assessment and treatment of pain is an important aspect of providing patient comfort in the critical care setting. Whilst continuous opioid infusions are frequently administered, patients may continue to suffer from pain.3 Survivors of critical care report adverse physical and psychological problems such as anxiety, depression, sleep disturbances, chronic pain syndromes and post-traumatic stress disorder.4 5 These problems persist for several months after hospital discharge, affecting recovery and quality of life.6 7 Also, pain induces detrimental physiological effects e.g. the release of endogenous catecholamines cause tissue injury, the inflammatory response is activated and the immune system is threatened.8 Furthermore, research findings report that many ICU patients experience pain at rest as well as during common nursing and medical interventions.9 Yet, the harm associated with unrelieved pain can be minimised.10
Medical Societies endorse the implementation of validated pain assessment tools that enable earlier identification and treatment of pain in this patient population.11–13 Despite these recommendations, the Behavioural Pain Scale (BPS)14 and the CPOT15 are infrequently used in critical care units. In a telephone audit conducted by Raigmore ICU in April 2017, just 30% of ICUs in Scotland reported using validated behavioural pain scales.16 When pain is regularly assessed, patients are more likely to receive appropriate treatment and less sedation.17 Hence, best practice should promote an analgesia-first strategy to not only humanely treat pain, but to promote earlier patient participation and rehabilitation.18 The CPOT has demonstrated more discriminant robustness than the BPS which provides the rationale for favouring the CPOT utilisation in this improvement project.19
Measurement
A family of measures were devised to monitor progress. The process measures were identified as (1) reliability of the nursing staff to assess and record pain scores every four hours and (2) reliability of the nursing staff to treat significant pain scores, i.e. CPOT scores ≥3. It was predicted that the nursing staff would assess, document and treat pain where appropriate every four hours. It was theorised that these processes would lead to an improvement in the following outcome measures: a reduction in ventilator time and associated length of stay (LOS). Data is not reported within this paper on outcome measures as there were insufficient data points to determine improvement, or otherwise, over time. Balancing measures are important as they concern risk assessment of the potentiated unplanned effects that may occur during change.20 Opioid administration is not without risk and balancing measures were agreed as (1) risk of respiratory depression following bolus administration of the opioid and (2) risk of unplanned extubation whilst adopting an analgesia-first approach.
To ensure consistency in calculating data, operational definitions were agreed. Each ventilated patient’s CPOT chart was assessed for evidence of four-hourly pain assessment. Compliance was calculated on an ‘all-or-nothing’ basis. Therefore, patients with even with one missing four-hourly pain assessment were categorised as non-compliant. Those compliant (CPOT assessed every four hours) constituted the sample. The sample was divided by the number of patients who were ventilated. Multiplying this figure by 100 gave a percentage of the process measure on a weekly basis.
For the treatment of pain, the assessment of the pain scores greater than three were calculated using the same ‘all-or-nothing’ principle. The actual number of CPOT scores documented as ≥3, then divided by the total number of CPOT scores ≥3 that were actively treated with an opioid analgesic bolus, then multiplied by 100 = percentage reliability.
A tracking sheet was designed to record and collect data on CPOT scores (see the online supplementary additional file 1: Tracking sheet/data collection sheet). Data that needed to be completed included the following: time of assessment; pain score at rest; pain score during turning or where potentially painful procedures were induced; reassessment of pain on completion of procedures; confirmation that CPOT scores ≥3 were treated with opioid; and a final column required nursing staff to confirm if sedative boluses had been administered. The reverse of the tracking sheet was a dedicated area for users to provide constructive feedback.
Supplementary file 1
Baseline measurement
Initial data collection focused on testing the CPOT on one patient. Testing was undertaken using the Plan-Do-Study-Act (PDSA) approach associated with the MFI. Observations from this period demonstrated 100% reliability of documenting the CPOT score every four hours, however, all recorded pain scores were less than three. Testing continued with one patient to determine whether staff understood the necessary actions if patients triggered a score of three or more. On this occasion, 100% was achieved.
Testing increased to three patients and whilst 100% reliability was achieved for four-hourly pain scoring, two patients did not receive rescue bolus of opioid analgesia for CPOT scores of four. Learning from this revealed that nurses used their own clinical judgement as opposed to the CPOT scores when pain scores were three or above. Also, the inability to bolus remifentanil (an opioid analgesic) caused some confusion in a few nurses. Rapid administration of this drug is not recommended as it can cause profound hypotension and bradycardia. In the comments section, the nurse communicated that rescue therapy using remifentanil was not permitted. It was learned that some confusion existed between opiates that could be administered via bolus and those which require titration.
Learning from the PDSA cycle of three patients informed the development of educational posters presented in the style of the Situation-Background-Assessment-Recommendation (SBAR) tool.21 The first poster reinforced the fact that CPOT scores ≥3 indicated that the patient was experiencing significant pain. The second poster concerned appropriate treatment of positive pain scores in the context of remifentanil infusions, and nurses were advised to increase the infusion rate as per protocol to achieve the desired effect. Also, it was suggested that when the remifentanil had reached the maximum prescribed dose, then discussions should be initiated with medical staff regarding efficacy of current treatment, e.g. consideration for an alternative choice of opioid.
Design
The MFI engages the use of small-scale tests to minimise risk and is efficient in executing change ideas.22 PDSA cycles enable better control of change to be sensitively introduced in contexts that may be unpredictable.23 Data was collected each week and involved retrieval of all the tracking sheets. As per PDSA methodology, the testing phase required to be steadily incremented in ramps of one, three and five, before spreading to all patients. However, given that this ICU is a small seven-bedded unit and not all patients admitted require mechanical ventilation, it seemed feasible to increase testing from three to all appropriate patients.
Patient and nurse selection varied each day of testing. The baseline measurement phase lasted three weeks commencing on 20 March 2017 and reached completion on 9 April 2017. Run charts were used to display the data as these have the advantage of demonstrating improvement, or otherwise, over time, and helped maintain the focus on predicting and learning from variation in processes.
The lead consultant for ICU approved the testing of the CPOT. A team of enthusiasts was formed and comprised of key stakeholders: ICU Consultants, the Anaesthetic Pain consultant, the lead pharmacist, the lead physiotherapist and a total of eight ICU nurses. Huddles were used ad-hoc as opportunities to meet up were constrained by insufficient time and unit workload.
As a means of identifying the extent of the problem, a brief questionnaire was distributed to 55 staff nurses (response rate 38%) (see the online supplementary additional file 2: Questionnaire responses from nursing staff) and a separate survey was sent individually to the eight ICU consultants (response rate 63%) (see the online supplementary additional file 3: Survey responses from ICU Consultants). The questionnaire results were collated and displayed on the QI noticeboard and reaffirmed that improvement was needed.
Supplementary file 2
Supplementary file 3
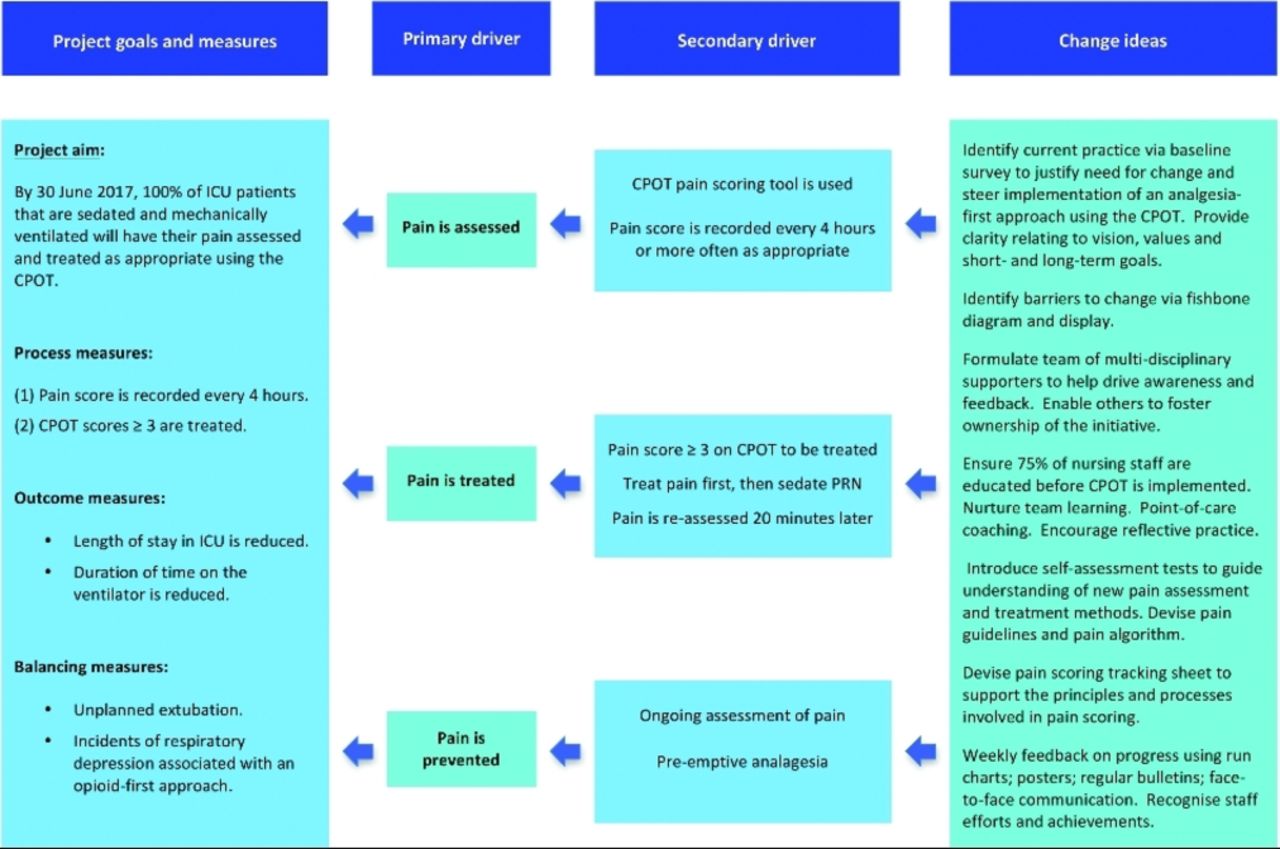
Additional methods included brainstorming the potential obstacles using a fishbone diagram as an engagement tool (see the online supplementary additional file 4: Fishbone diagram). A driver diagram was used to visualise the number of areas that needed to be addressed in order to achieve the desired outcomes (insert figure 1). Engaging the team in understanding why change is necessary focused on the harmful outcomes and repercussions when assessment of pain is denied. Ethical persuasion using harrowing patient narratives portraying their inability to communicate suffering and distress, helped reaffirm the need for improvement.
Supplementary file 4

Driver diagram. CPOT, Critical-Care Pain Observation Tool; ICU, intensive care unit.
Concerning training objectives, the aim was to ‘have 75% of the nursing staff educated on how to adopt an analgesia-first approach using the CPOT and how to complete the tracking sheet by 20 March 2017’. ICU consultants, nursing staff, pre-registration nursing students, healthcare assistants, physiotherapists and pharmacists were included. Led by the clinical educator, the training targets were achieved by observation and learning interactions during point-of-care interventions; using power-point presentations on the topic; inviting expert speakers to training events; and posters exhibiting extracts from research papers were displayed on the QI information board. Pain guidelines along with an algorithm to aid decision-making on CPOT scores were also implemented during the course of the project. The project was launched on 20 March 2017.
Strategy and improvement cycles
Multiple PDSA cycles were conducted throughout the project. From these, the key PDSA cycles are reported in the following paragraphs.
PDSA cycle 1
A total of 12 patients were observed from 10 April 2017 to 14 May 2017. During the first week, measuring performance on four-hourly assessments showed that no one had completed the documentation during night hours. Further exploration revealed that one of the nurses had not received training and was therefore unaware of the need to complete the CPOT. Following discussion with the team of enthusiasts, it was agreed that those trained would assist to educate those who were not. Learning from this cycle also revealed that workload demand due to an emergency admission had resulted in a delay in scoring. Despite this delay, following assessment, the patient’s pain was appropriately treated. Time between pain assessments during this period varied from five to eight hours.
Nursing staff were generally vigilant in treating CPOT scores ≥3. However, it was recognised that the common problem of conflict between the use of nursing tools, and nurses’ clinical judgement and decision-making24 led to a CPOT score of four not being treated. Also, it is suggested that nurses’ personal beliefs about the patients’ behaviours of pain influence decisions regarding treatment of pain as opposed to the actual pain scores recorded.25 While sensitivity is needed to reflect on why pain is not treated, the overwhelming ethical duty of doing no harm justifies the difficult decision to follow empirical evidence. An emphasis on specifically treating pain scores that indicate harm seemed to be effective in a previous study.26 It was therefore reinforced that a CPOT score ≥3 needed treatment, as it indicated that the patient was experiencing significant pain.
It was also learned that nursing staff did not treat a CPOT score of four in a mechanically ventilated patient who had an epidural in place. Nurses explained that pain relief could not be given in the absence of an intravenous opioid infusion, and this appeared to add confusion. Learning from this, nursing staff were advised to treat pain in the same way as for self-reporting patients, i.e. either to increase the epidural infusion rate or discuss with medical staff regarding appropriateness for additional top-up of pain relief via the epidural route. Also, it was observed that a nurse had a momentary lapse in concentration and had reverted to the former way of administering sedation first. However, the remainder of this patient’s pain scores were appropriately treated. Learning from this, a poster was displayed to help remind nurses to treat these common behavioural signs of pain with analgesia before resorting to sedatives.
PDSA cycle 2
A total of 13 patients were observed from 15 May 2017 until 19 June 2017. The aim was for consistent treatment of CPOT scores ≥3 as previous testing had revealed some quality-related issues. On the whole, this was achieved, except for one deviation, and this referred to the earlier issue of remifentanil, which had been noticed during baseline measurement. Learning from this, face-to-face, verbal and written communications were used to remind nurses on how to suitably intervene by referring to directions within the protocol.
Another goal was to improve the four-hourly documentation of pain as the previous cycle showed that the frequency of pain assessment varied from five to eight hours. However, testing during this cycle revealed that performance had deteriorated further. For 2 weeks, no one had recorded the CPOT score, and subsequent weeks showed 25%, 33% and 50% compliance respectively. Patients were not being regularly assessed for pain, with the time between pain assessments varying from five to twelve hours. Further exploration revealed a number of factors influenced these inadequate results, including: increased workload particularly during nursing breaks, insufficient time to carry out the CPOT and sometimes forgetting to use the tracking sheet. An important observation was that when patients were eventually assessed for pain, their pain scores had already increased and required treatment with rescue opioid analgesia.
Action on learning from the above resulted in the following adaptations. The effects of missed opportunities for assessing pain were annotated on the run chart for this period. This enabled nursing staff to visualise the association between patients being denied regular pain assessment and those requiring pain relief when finally assessed several hours later. Concerning the observation and the problem of workload demands, nursing staff were reminded that patients could be experiencing pain at rest for long periods of time. It was communicated that as a minimum during busy periods, nurses should at least demonstrate attentiveness to patient comfort, by regular assessment of pain while at rest. Since the tracking sheet was a separate document, a sticker was placed on the ICU observation chart to prompt its use (see the online supplementary additional file 5: Sticker to prompt tracking sheet).
Supplementary file 5
A total of 25 patients were included in PDSAs one and two. With less than two weeks away from the project’s completion date, it was recognised that insufficient data would be collected to determine whether or not a change had occurred using run chart rules. It was therefore agreed to extend the duration of data collection to the period ending 25 September 2017, thereby achieving a final sample of 65 patients.
PDSA cycle 3
The aim of this cycle of testing was to reduce delays in pain assessment as testing so far had revealed that time between pain assessment was breaching the four hour standard, ranging between five and twelve hours. During this cycle, some patients were still waiting 5 to 6 hours before their pain was assessed and it was commented that there was insufficient time for nurses to record scores every four hours. This was an incorrect perception: the nursing team were reminded that the CPOT takes just 60 seconds.27
However, apart from just two episodes of non-completion, significant improvement was achieved during this cycle with CPOT use increasing between 67% and 100%. It was thought that the sticker on the ICU observation chart could have influenced this positive change. When the CPOT was used, significant pain scores were acted upon with 100% reliability.
Results
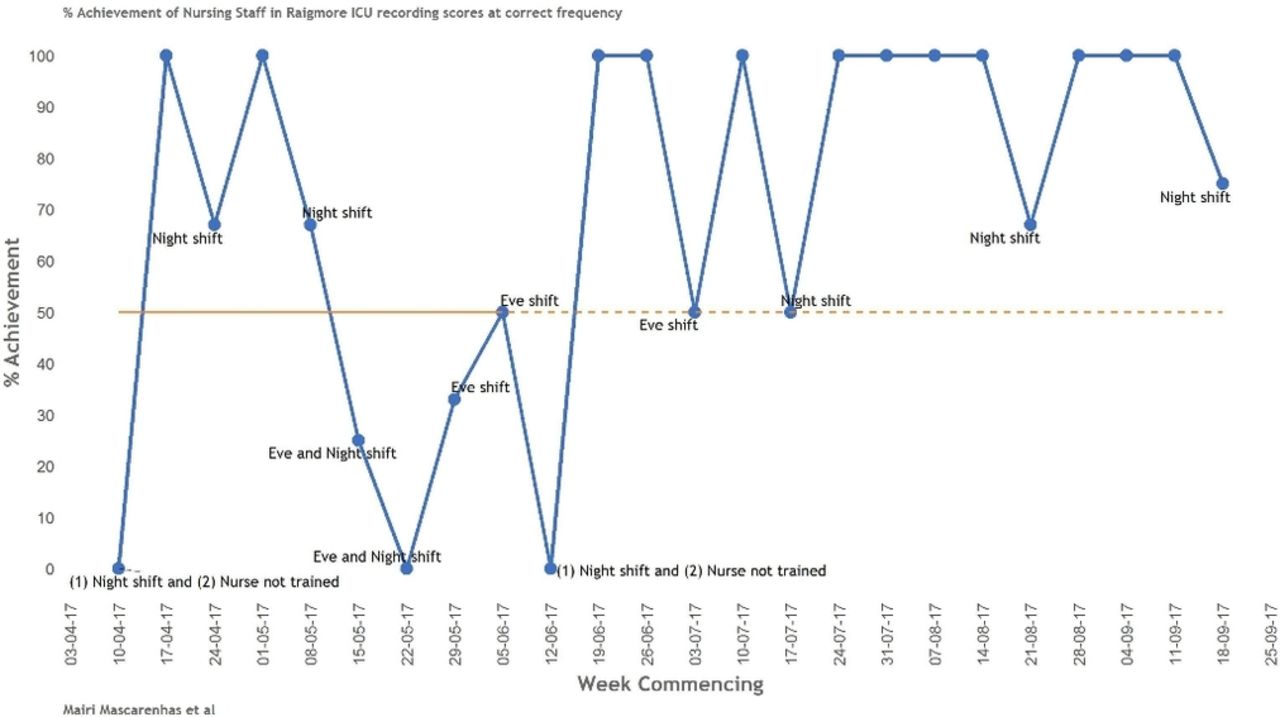
Figure 2 shows a run chart displaying compliance with the four-hourly pain assessments. Figure 3 shows a run chart displaying treatment of CPOT scores ≥3. Using run chart rules, the following interpretation of the data is explained.28

Nursing staff recording CPOT score every 4 hours. CPOT, Critical-Care Pain Observation Tool.

![[bmjoq-2017-000304-SP1.jpg]](https://bmjopenquality.bmj.com/content/bmjqir/7/4/e000304/DC1/embed/inline-supplementary-material-1.jpg?download=true)
![[bmjoq-2017-000304-SP2.jpg]](https://bmjopenquality.bmj.com/content/bmjqir/7/4/e000304/DC2/embed/inline-supplementary-material-2.jpg?download=true)
![[bmjoq-2017-000304-SP3.jpg]](https://bmjopenquality.bmj.com/content/bmjqir/7/4/e000304/DC3/embed/inline-supplementary-material-3.jpg?download=true)
![[bmjoq-2017-000304-SP4.jpg]](https://bmjopenquality.bmj.com/content/bmjqir/7/4/e000304/DC4/embed/inline-supplementary-material-4.jpg?download=true)
![[bmjoq-2017-000304-SP5.jpg]](https://bmjopenquality.bmj.com/content/bmjqir/7/4/e000304/DC5/embed/inline-supplementary-material-5.jpg?download=true)
Treatment of CPOT scores ≥3. CPOT, Critical-Care Pain Observation Tool.
Figure 2 shows three data points on the median, leaving 21 useful observations. The minimum expected number of runs from 21 useful observations is seven, and the longest run length we would expect is fourf29 However, the run chart shows only four runs, with a run of 12 consecutive points above the median (on the desired side of the centre line). These both act as signals of sustained improvement.
In figure 3, more than 50% of the points lie on the extreme value (100%) so in this case, the median cannot be used. We can, however, use the average of the baseline period for the centre line.30 During the post-baseline period, there is a run of 13 consecutive values at 100%. As with the previous measure, the chart shows too few runs (i.e. seven instead of eight) and a maximum run length of 13 (on the desired side of the centre line) that exceeds the run length of 7, that would be expected if only common cause variation existed.
Concerning the balancing measures, one episode of respiratory depression lasting approximately 45 seconds was observed during a spontaneous breathing trial following sedation interruption. The reduced respiratory rate was safely supported using backup ventilation, before the patient recovered spontaneous respiratory effort. A team discussion suggested that smaller opioid doses could be more appropriate during these trials. However, this would need to be carefully balanced against inadequate pain relief inhibiting the patient’s ability to participate comfortably during periods when lighter or no sedation was used. Two episodes of unplanned extubations occurred in patients that were already requiring increased sedative infusion rates and boluses to control extreme states of non-compliance and combative behaviour. Both these episodes were unavoidable, and indeed, research shows that these incidences similarly occur using traditional sedation-forward methods.31
Lessons and limitations
This project achieved the aim of improving the timely assessment and treatment of pain, using the CPOT in ICU patients whom are unable to self-report. Four-hourly assessments of pain had increased to 89% and the treatment of CPOT scores ≥3 had increased to 100%. Collaborative engagement of a supportive multidisciplinary team, guided by expert knowledge and leadership that responsibly recognised the need for organisational change, were key to the success of the project. Nursing staff reported that the CPOT increased accountability and autonomy in titrating opioid infusions earlier and aided decision-making of administration of opioid-based pain relief. It is perceived that the learning gained from this undertaking may be relevant to other critical care areas.
Those considering conducting a similar project would need to consider the need for further education. Advanced awareness sessions are needed for appropriate treatment of pain when certain drugs or drug routes are used, e,g. remifentanil or epidural infusions. Other quality-related issues need to be contemplated, e.g. increasing the nursing team’s knowledge of time-to-peak effects in analgesia to enable sufficient time for the analgesia to take effect prior to undertaking pain-inducing procedures; the need to administer pre-emptive analgesia in patients who are pharmacologically paralysed as neuromuscular blocking drugs inhibit expression of pain behaviours; and awareness that pre-emptive analgesia also needs to be considered when patients are deeply sedated as this often masks behavioural signs of pain and risks the potential of untreated pain.
Whilst this QI project did not provide data to determine a causal relationship between CPOT assessment and patients not requiring conventional sedative infusions, it is important to highlight our observations to inform practice and future project designs. Some unpredicted observations from this study relate to the fact that better pain management can potentially lead to a reduction in sedation.2 17 For example, one patient with retention of respiratory secretions remained endotracheal tube-tolerant for 72 hours with low-dose opioid alone i.e. alfentanil 500 μg/hour. A ventilated patient with traumatic rib injuries was adequately managed for 12 hours with a patient-controlled analgesia device. Another patient with reduced intravenous access was comfortably managed with intermittent 2 mg intravenous bolus of morphine every two hours. Similar observations of patients not requiring traditional use of sedative infusions but managed instead with intermittent analgesia are reported in the literature.32 Furthermore, an analgosedation study associated with the CPOT has also demonstrated lighter levels of sedation.33 These cases would be likely to result in a reduction in ICU LOS as patients receiving less sedation are usually hospitalised for shorter periods of time.34
It is believed that these observations occurred as a result of shared multidisciplinary decision-making. For example, when sedation interruption is proposed, it is usual that both sedation (i.e.propofol) and opioid analgesia are discontinued. However, it is observed that this practice can be a barrier to nurses stopping sedation as patient discomfort is increased.35 Notably, since the implementation of the CPOT, nurses now communicate scores ≥3 to medical staff, and based on this, medical staff seem to approve continued use of the opioid analgesic infusion. As a result, it was noticed that a number of patients were able to participate in decisions around their care and comfortably undergo physiotherapy manoeuvres such as daily dangles or assist themselves in turning procedures.
This improvement study has a number of limitations. The results may not be generalisable to other settings especially as QI efforts are often shaped by local complex social systems.36 Despite this, the learning realised from the utilisation of PDSAs may be of benefit to other areas considering similar improvement work. The relatively small sample size of 65 ICU patients in a seven-bedded general ICU may be viewed as insufficient. However, just enough data is all that is needed to inform progress on process measures.37 The limited number of data points for LOS and time onventilator were insufficient to determine improvement or otherwise. Continuing to collect this data will ensure a sufficient number of data points for run chart rule interpretation.
Furthermore, the CPOT is excluded in several patient groups.38 This diluted the sample size because a number of patients presented with muscular dysfunction; pharmacological paralysis; traumatic brain injury and chronic substance abuse. However, it would still be beneficial to assume the presence of pain in this vulnerable group of patients.39
The project encountered a number of barriers that are frequently experienced in other studies, such as change fatigue and resistance,40 workload and time management, and reduced staffing resources.41 Having the tracking sheet as a separate document could have influenced slower turnaround in improvement, but since project completion, the ICU chart now has a sticker for CPOT recordings (see the online supplementary addition file 6: ICU observation chart sticker to replace tracking sheet). Whilst successful outcomes can be achieved, sustaining improvement and holding the gains can be just as challenging and requires diligence, determination and constant nurturance.42 43 Effective methods for maintaining improvement include ongoing educational interventions along with regular monitoring and appraisal of performance.44 Furthermore, emerging evidence from the literature will continually influence the necessity for QI initiatives.
Supplementary file 6
![[bmjoq-2017-000304-SP6.jpg]](https://bmjopenquality.bmj.com/content/bmjqir/7/4/e000304/DC6/embed/inline-supplementary-material-6.jpg?download=true)
Without reforming standards of care, there is no reassurance that this vulnerable ICU population are receiving appropriate protection. Given the practice gap evident in critical care units, it would, therefore, seem reasonable to propose the inclusion of these pain assessment tools as a healthcare quality indicator as previous healthcare bundles have already demonstrated a reduction in patient harm.45
Conclusion
In conclusion, pain is a common and preventable harm for ICU patients who are unable to self-report due to the effects of sedative infusions and mechanical ventilation. This QI project was successful in implementing the use of the CPOT as a pain assessment and treatment tool in our ICU. Importantly, the project shows that incremental testing and adaptations are a useful approach to implementing change in practice. We believe that this project has enabled an improvement in the quality of pain management within our setting.
Acknowledgments
The authors would like to thank the multidisciplinary team, especially the nursing staff, in the ICU at Raigmore Hospital for their ongoing participation in this quality improvement initiative.
References
Footnotes
Contributors MM: designed and conducted all stages of the project; drafted the manuscript. MB and MR: supervised the project and advised on methods. JM: provided data expertise and devised run charts. NC: conducted the telephone audit. DS: provided expertise and advice on the improvement methods.
Funding The authors have not declared a specific grant for this research from any funding agency in the public, commercial or not-for-profit sectors.
Competing interests None declared.
Ethics approval This work met criteria for operational service improvement work exempt from research ethical review
Provenance and peer review Not commissioned; externally peer reviewed.