Article Text

Abstract
Purpose To evaluate the McMaster Family Health Team (MFHT) as part of a Continuous Quality Improvement initiative using a set of provincial performance metrics to demonstrate which measures of assessment are actually clinically meaningful in context and where system-level changes might be implemented to improve operational practice.
Methods Measures were selected from the Primary Care Performance Measurement Framework based on data availability for the MFHT and provincial comparators. The measures explored in this paper are those that were deemed to have actionable properties. Data were extracted from billing reports, electronic medical records and information collated for the Association of Family Health Teams of Ontario Data to Decisions database. Metrics were then examined to demonstrate the importance of interpretation in clinical context.
Conclusions Quantitative assessment of performance based on standardised measures is a suitable starting point when evaluating a practice, however it is not appropriate as a stand-alone report card of practice performance. Rather, quantitative measures must be of clinical relevance and applicable to the patient populations of interest in order to create conversation and impact change. Thus, the focus of quality improvement should not be to improve numbers relating to efficiency, patient satisfaction and continuity of care, but rather to determine what drives those numbers and how changes might be made at a system or practice level that will optimise clinician buy-in.
- quality improvement
- primary care
- patient satisfaction
- cost-effectiveness
This is an open access article distributed in accordance with the Creative Commons Attribution Non Commercial (CC BY-NC 4.0) license, which permits others to distribute, remix, adapt, build upon this work non-commercially, and license their derivative works on different terms, provided the original work is properly cited, appropriate credit is given, any changes made indicated, and the use is non-commercial. See: http://creativecommons.org/licenses/by-nc/4.0/.
Statistics from Altmetric.com
Introduction
Multiple primary care models exist in the province of Ontario, Canada, one being the Family Health Team (FHT). These models differ in aspects including the number of physicians practising, access to allied health professionals, expected office hours and method of compensation. A study commissioned by the Provincial Ministry of Health (Ministry of Health and Long-Term Care)1 highlighted variation in performance between and within models; nearly half of FHTs studied were high performers in some domains and among the lowest performers in others. Similarly, little consistency was found in performance between 17 FHTs in Ontario in measures pertaining to outcomes, patient experience and cost, with some FHTs being high performers in some areas and not in others. The selection of a small number of measures to portray a broad concept and the lack of direct outcome measurements was also suggested as a limitation by the authors.2 Multiple organisations in Ontario have been vying to enhance the calculation, distribution, reporting and collection infrastructure related to capturing primary care data. In addition, FHTs in Ontario are accountable for creating an annual quality improvement plan through Health Quality Ontario (HQO, a provincial organisation focused on healthcare quality improvement); incorporating quality measures and making a commitment to improvement. However, it can be challenging for a practice to decide on which outcomes to focus efforts, as well as how to interpret the differing results between practices (let alone benefit from peer best practices).
McMaster FHT (MFHT) is located in Hamilton, Ontario, and is one of 190 FHTs in Ontario. MFHT is in an urban, academic practice comprising 35 (full and part-time) physicians and 29 interprofessional team members, serving approximately 35 000 rostered patients throughout the city of Hamilton. The population of Hamilton is diverse, with extreme inequities between neighbourhoods such as a 21-year difference in life expectancy.3 This paper presents a selection of quality measures derived from the Primary Care Performance Measurement framework created by HQO, along with the interpretation of the outcomes and actions arising from the investigation. Clinically relevant indicators are key to engaging clinicians in quality improvement. Many of the indicators presented in the framework were not deemed to have clinical relevance despite being easily quantifiable, and this impacts the willingness of physician leaders to engage with the data. This paper aims to elucidate how some of these measures are misrepresentative of clinical context, and demonstrate how metrics can be more informative when suited to match the context they are being used in.
Methods
After reviewing existing performance frameworks, MFHT selected the Primary Care Performance Management Framework from HQO and Institute for Clinical Evaluative Sciences to evaluate its performance. The framework consists of 18 priority indicators and 112 other practice-level measures, across domains of access, patient centredness, efficiency, effectiveness and population health.4 Of those, MFHT focused on indicators with data available for both MFHT and provincial comparators. MFHT had data available for 10 of the 18 priority indicators, and a limited 18% (20/112) of the other measures. Data presented in this paper include a subset of these indicators which were deemed to have actionable properties. Data sources included administrative databases (largely based on billing data) via practice reports and a provincial database, the MFHT electronic medical record (EMR) OSCAR and information collated for the Association of Family Health Teams of Ontario Data to Decisions database. The metrics were then examined in context of the MFHT and provincial comparators, which demonstrated that not all popular quantitative performance metrics are clinically meaningful, and that interpretation of results in isolation if often challenging. The leadership team then reviewed and discussed action plans in response to the information.
Results and analysis
A selection of measures from the Primary Care Performance Measurement Framework from a variety of domains is presented here.
Access: continuity of provider
See figure 1: per cent (%) of patient visits billed to rostered physician.
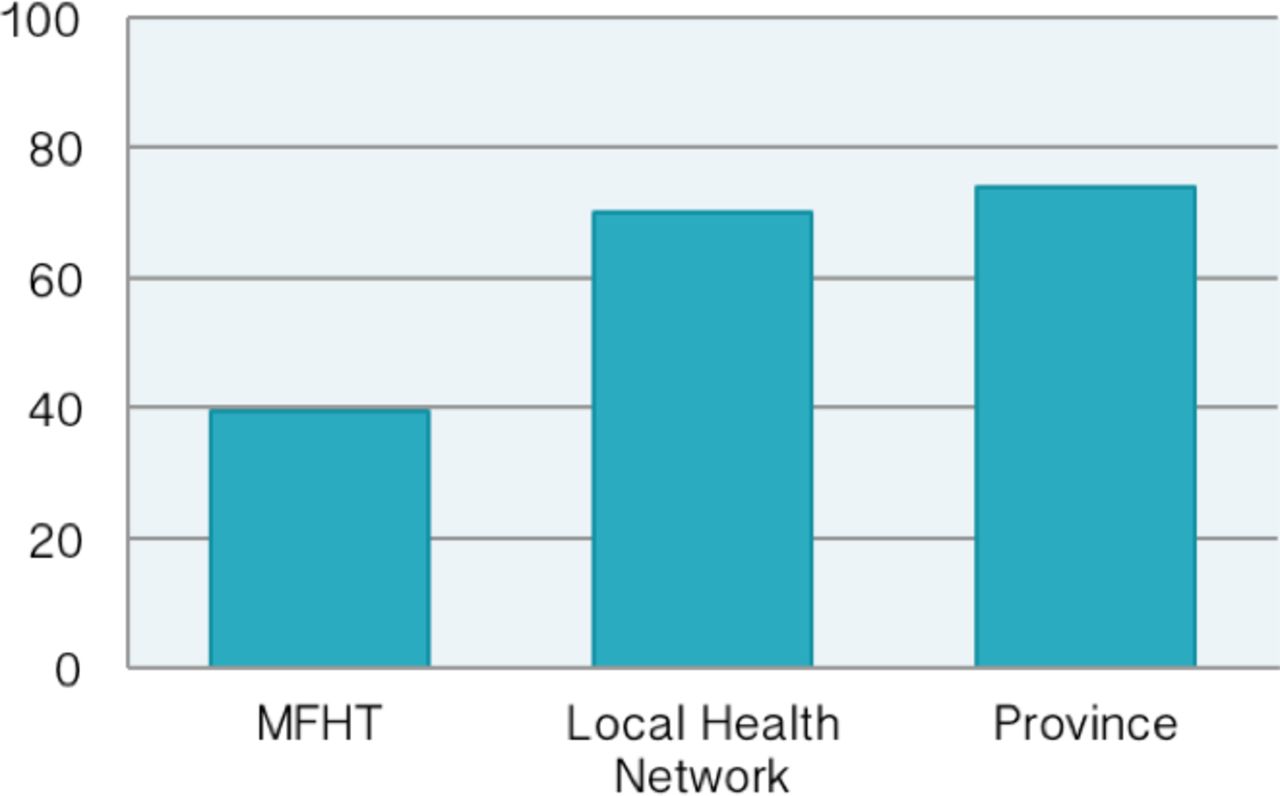
Per cent (%) of patient visits billed to rostered physician. MFHT, McMaster Family Health Team.
A key indicator to evaluate access is continuity of care with the same providing team. This is calculated as the proportion of primary care visits that are billed to the physician to whom the patient is rostered, using billing data as the data source. Calculated in this manner, MFHT’s value of 39.5% is much less than other primary care practices in the province. However, in an academic setting where training of resident physicians occurs, continuity as calculated by this method is under-represented. When a resident sees a patient, they bill under their supervisor which may differ from day to day, despite the resident consistently seeing the same patients. A measure more reflective of this context would be continuity towards the team of providers (within the larger Family Health Organization). Using this method, MFHT’s rate was 73.1%; similar to other provincial FHTs (73.9%), including other teaching FHTs within our local health network (70%).5 Although provincial benchmarking was not the primary outcome of this evaluation, comparing our data to the province was helpful in demonstrating that the same metric applied to different types of institutions can result in vastly different outcomes despite performance potentially being at par. By creating contextually driven metrics, we create more meaningful results; comparing to provincial benchmarks ensures that chosen outcome measures are also important provincially.
On reviewing these data, the MFHT sought to create a contextually meaningful measure for continuity of care in order to assess its performance and drive potential quality improvement projects to address any deficiency. Given that continuity of care has been linked to system-wide costs and is important for patient experience, this was deemed to be a priority.6 The exercise involved reviewing EMR data, mapping physician and resident teams and then examining the proportion of time patients were seen by their physician or resident within their team. Thus, the initiative went beyond the billing data to begin to obtain a more accurate picture of continuity as pertaining to an academic practice.
Access: less urgent emergency department visits
See figure 2: number of less urgent emergency department (ED) visits.
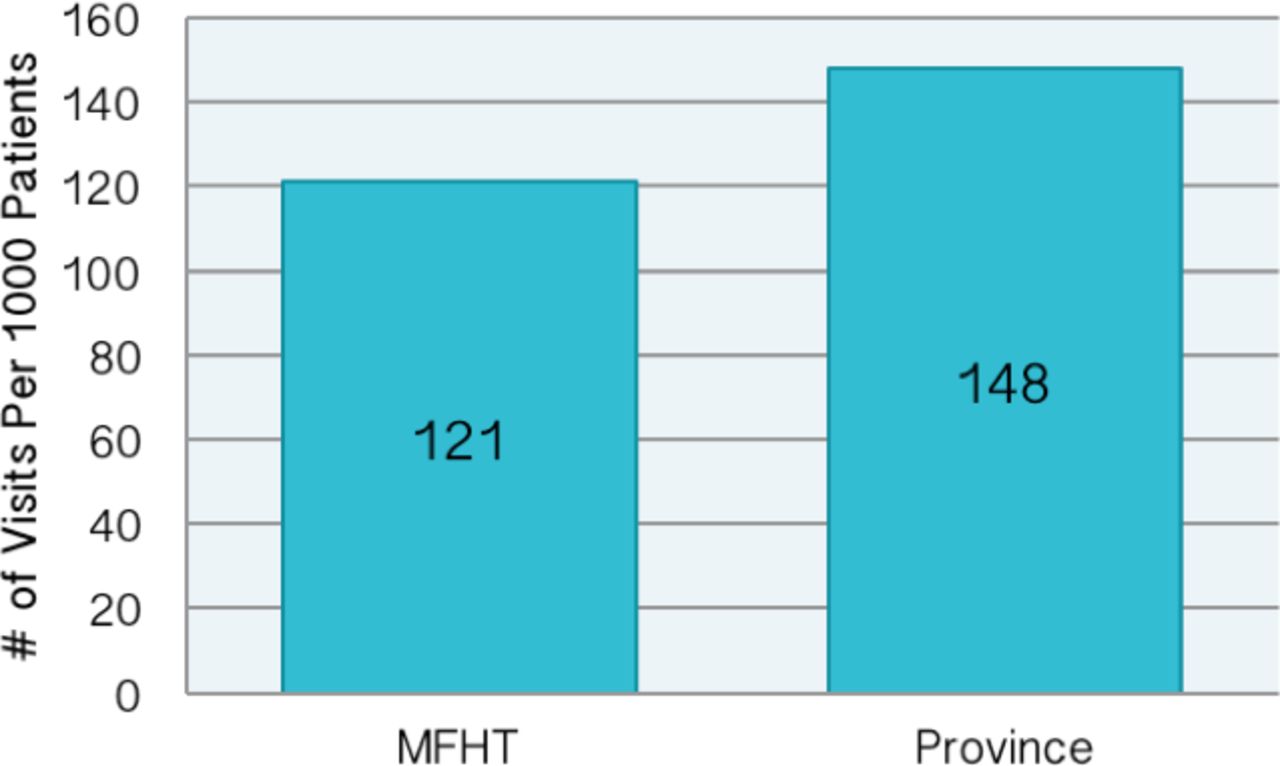
Number of less urgent emergency department (ED) visits. MFHT, McMaster Family Health Team.
Considering less urgent ED visits, MFHT’s value of 121 emergency visits per 1000 patients (121/1000) is below the provincial average of 148/1000 patients. Less urgent visits were defined as a 4 or 5 on the Canadian Triage and Acuity Scale (CTAS). These cases are often better managed in primary care. Poor access to a primary healthcare provider has been shown to increase the frequency of less urgent ED visits.2 7 This suggests that the model of access for MFHT has been successful in ensuring patients are seen in the appropriate setting. It is clear that a lower number of less acute ED visits would result in substantial cost saving for the province, however it is unclear from a single metric which aspect of the MFHT model is the driver behind this number and why the provincial average demonstrates higher numbers of lower acuity visits. Other anticipated benefits include less congestion of EDs and thus faster assessment of serious cases, and the ability of the patient to be treated by their own family doctor with whom they have a relationship. As a stand-alone metric, it would appear that the MFHT is improving issue-appropriate access of the healthcare system; however, more data are needed to determine why this achievement is present.
Likely contributing factors to this rate include MFHT’s 24/7 access through a combination of in-person evening and weekend clinics, and an in-house on-call programme. Previous quality improvement efforts included employing communication strategies to increase the likelihood that patients are aware of the after-hours and evening options. In 2012, a survey showed that approximately 50% of patients were then unaware that there were evening or weekend options available. In 2013, hours were communicated via posters, email and through inclusion in a clinic newsletter. This contributed to a decrease in less acute (CTAS 4 and 5) visits from 2.5 to 1.9/1000 patients during the holiday season. In order to continue to work on reducing low-acuity ED visits, MFHT would benefit from enhanced real-time access to data related to utilisation for MFHT patients.
Effectiveness: HbA1C testing for diabetics
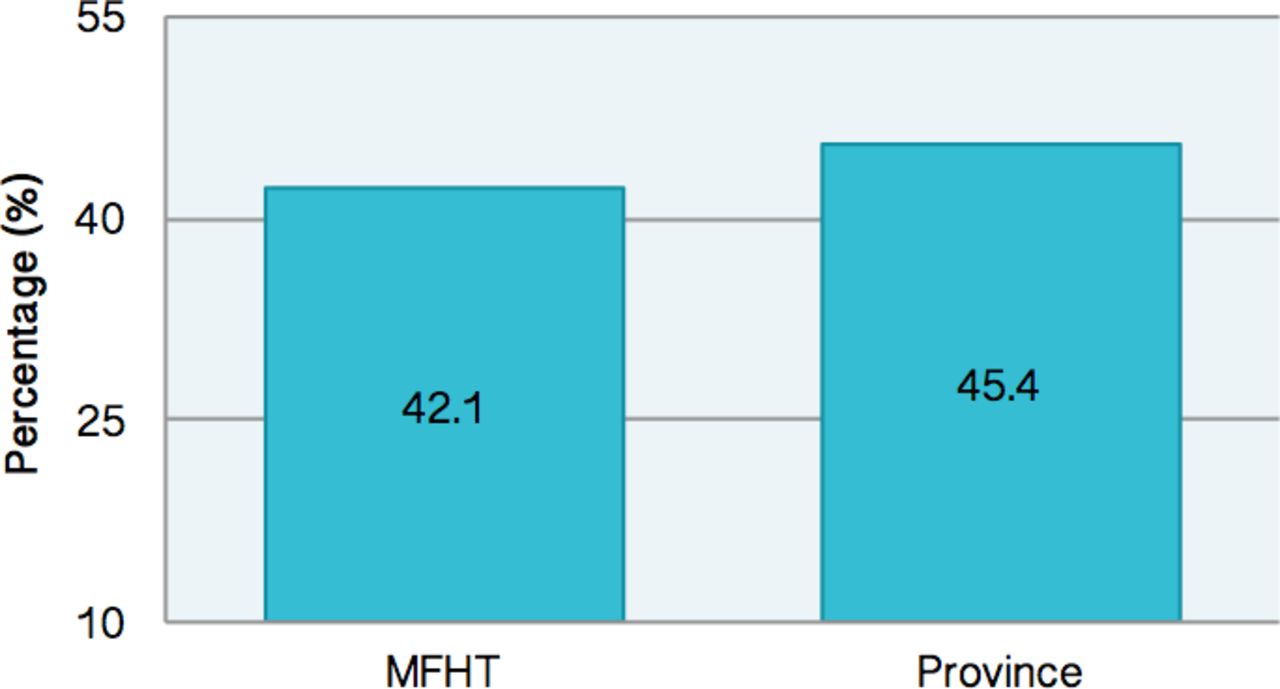
See figure 3: diabetics with two HbA1C tests in 1 year.

Diabetics with two HbA1C tests in 1 year. MFHT, McMaster Family Health Team.
The framework measures effectiveness by examining a variety of disease-specific outcomes, one being glycosylated haemoglobin (HbA1C) levels in patients with diabetes. On this measure, MFHT’s rate of screening was slightly less than the provincial rate, which at face value paints the picture of suboptimal diabetes care. However, a team review of this measure revealed that clinicians did not agree on biannual HbA1C testing as an appropriate blanket protocol for all patients with diabetes. Evidence has shown that factors such as comorbid conditions, capacity for self-care and economic factors are important to consider in deciding on a patient-specific path for diabetes monitoring.8 Thus, we demonstrate that comparing our results to a provincial average can be misleading when our evidence-based goals are in fact not in line with a provincially chosen metric. This exemplifies the need for metrics to be non-static, as evidence and best practice often evolve quickly.
In response to this information, there was a desire to continue to focus on diabetes care while also ensuring that measures used are clinically applicable to the individual patients. As a result, an interdisciplinary working group was formed in order to determine an ideal measurement and quality improvement strategy for diabetes care. This group involved a physician, nurse practitioner, pharmacist, quality improvement team and information technologist. In discussing evidence-based outcome measures, it became clear that a barrier to capturing data consistently was the way in which measurements were captured in the diabetes-specific flow sheet in the EMR. As such, an initial project focused on selecting a subset of measurements deemed to be most clinically relevant and important to capture over time. This exercise resulted in a reduction of input fields on the flow sheet from 52 to 26, creating a more user-friendly experience for the clinician to collect information in a consistent and standardised manner.
The present goal of the working group is to determine a measurement strategy. This project involves physician-specific feedback on measures related to diabetes management alongside focused work to reach out to patients under 65 who have not had an HbA1c test in 12 months to provide a bloodwork requisition and schedule an appointment. This measure was chosen as a proxy for engagement with their diabetes care, with other measures of focus being blood pressure, hypoglycaemic episodes and use of metformin.
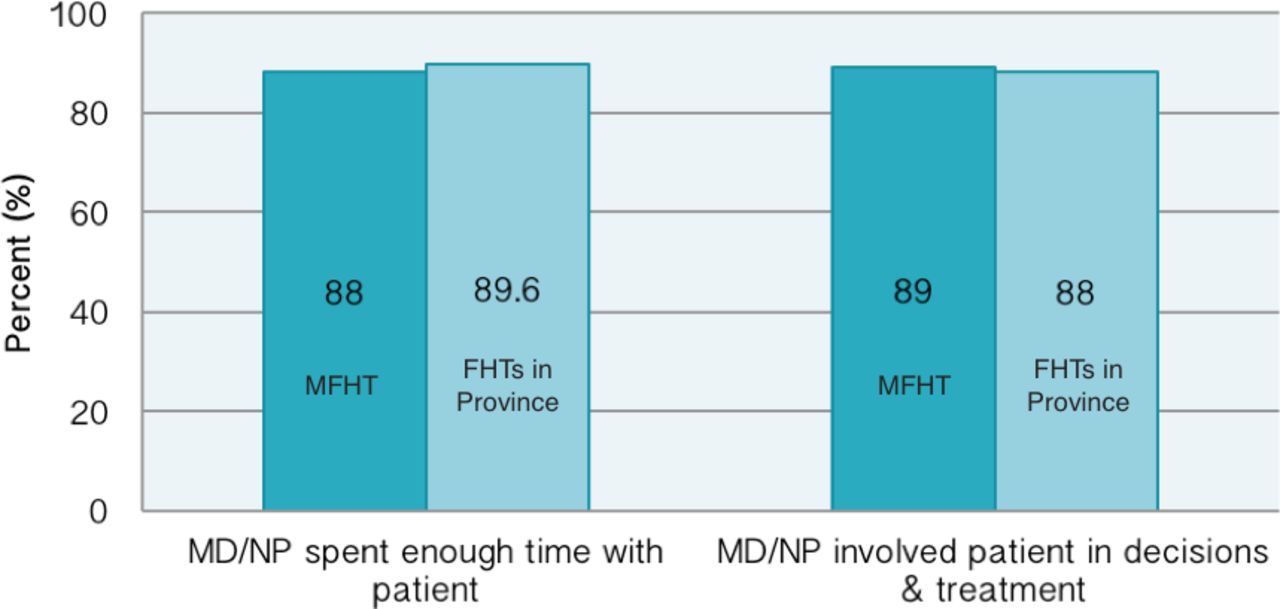
Patient centredness: whether patients feel their healthcare provider spends enough time with them and involves them in decisions
See figure 4: per cent of patients agreeing that care is patient centred.
Per cent of patients agreeing that care is patient centred. MD, medical doctor; MFHT, McMaster Family Health Team; NP, nurse practitioner.
There are two priority indicators in the framework relating to patient centredness; first, assess patient perception on whether the physician or nurse practitioner spends enough time with them, and second, if they achieved their desired level of involvement in making decisions about treatment options. Both are captured by patient surveys. On both questions, the MFHT rate is very similar to the average across other FHTs; both being quite high at nearly 90%. Limiting factors may be a low sample size (the MFHT sample size was 90) and ensuring a representative sample population.
In order to better understand contributing factors to this measure, MFHT included the prompt ‘tell us why you chose the answer you did’ on a subsequent quarterly patient survey. However, the response rate was very small. Given that these questions are broad, contributing factors to yes/no answers are unclear. Thus, it was felt that the type of information needed to inform any improvement or greater understanding in this area was not well captured by patient surveys. As an outcome, MFHT has increased the length of time and frequency of surveys (in the most recent year, the sample size was greater than 1500). MFHT has also initiated a patient advisory group (co-led by a patient), bringing together a small number of patients, allowing for enhanced discussion of these key questions. Unlike quantitative yes/no data, the qualitative information we receive from these discussions will better represent our performance around patient centredness, serving as an improved measure of this metric.
Lessons learnt
This MFHT journey in quality improvement has demonstrated that relevant, meaningful data are important to inform change. Data received from administrative sources regarding MFHT’s operations were helpful to start a conversation, but had limited relevance to informing practice changes. However, through conversation, interpretation and refining the measures to be contextually and clinically relevant, MFHT has been able to pursue quality improvement initiatives aligned to focused areas. Measures available through frameworks such as the one used here are not always endorsed by clinicians, and it is clear that physician engagement is integral for any improvement efforts. Thus, it is crucial to create measures that are both evidence based and have clinical impact. Furthermore, the amount of information available from practice reports and other external inputs can be overwhelming, it is clear that a feedback process is necessary to distil the information into a manageable and meaningful way. By doing this, the focus can shift away from easily quantifiable data that are not actionable and instead look to create more valuable metrics to base improvement on. Some of these will require patient surveys, which will necessitate finding a way to obtain and concentrate large amounts of qualitative data so that it can be used in operational planning. In addition, in order to interpret meaningful data, it is necessary to include subject matter experts in working groups, which will further enhance clinician buy-in and engagement in quality improvement initiatives.
Acknowledgments
Individuals who were of direct help in preparation of this study include Urslin Fevrier-Thomas (Quality Improvement Decision Support Specialist), in addition to many of the MFHT clinicians whose opinions were greatly helpful in directing the quality improvement initiatives that came from this paper.
Footnotes
Contributors LN did the majority of the writing and analysis, and planned for publication as first author. AS collected and organised the data and contributed to initial interpretation. DP oversaw the project, guided the analysis and assisted with content.
Funding The authors have not declared a specific grant for this research from any funding agency in the public, commercial or not-for-profit sectors.
Competing interests None declared.
Patient consent Not required.
Provenance and peer review Not commissioned; externally peer reviewed.
Data sharing statement No additional data are available.