Article Text

Abstract
Importance While much is known about hospital pharmacy error rates in the USA, comparatively little is known about community pharmacy dispensing error rates.
Objective The aim of this study was to determine the rate of community pharmacy dispensing errors in the USA.
Methods English language, peer-reviewed observational and interventional studies that reported community pharmacy dispensing error rates in the USA from January 1993 to December 2015 were identified in 10 bibliographic databases and topic-relevant grey literature. Studies with a denominator reflecting the total number of prescriptions in the sample were necessary for inclusion in the meta-analysis. A random effects meta-analysis was conducted to estimate an aggregate community pharmacy dispensing error rate. Heterogeneity was assessed using the I2 statistic prior to analysis.
Results The search yielded a total of 8490 records, of which 11 articles were included in the systematic review. Two articles did not have adequate data components to be included in the meta-analysis. Dispensing error rates ranged from 0.00003% (43/1 420 091) to 55% (55/100). The meta-analysis included 1 461 128 prescriptions. The overall community pharmacy dispensing error rate was estimated to be 0.015 (95% CI 0.014 to 0.018); however, significant heterogeneity was observed across studies (I2=99.6). Stratification by study error identification methodology was found to have a significant impact on dispensing error rate (p<0.001).
Conclusion and relevance There are few published articles that describe community pharmacy dispensing error rates in the USA. Thus, there is limited information about the current rate of community pharmacy dispensing errors. A robust investigation is needed to assess dispensing error rates in the USA to assess the nature and magnitude of the problem and establish prevention strategies.
- pharmacists
- medication safety
- human error
- healthcare quality improvement
This is an open access article distributed in accordance with the Creative Commons Attribution Non Commercial (CC BY-NC 4.0) license, which permits others to distribute, remix, adapt, build upon this work non-commercially, and license their derivative works on different terms, provided the original work is properly cited, appropriate credit is given, any changes made indicated, and the use is non-commercial. See: http://creativecommons.org/licenses/by-nc/4.0/.
Statistics from Altmetric.com
Introduction
Medication errors affect millions of people every year in the United States (USA). The clinical and economic consequences of medication errors have been widely documented. The Institute of Medicine (IOM) indicated that medication errors injure at least 1.5 million people annually in USA hospitals.1 In addition, there are significant economic costs associated with these errors with annual estimates that amount up to $21 billion.2 Medication errors occur in all steps of the medication use process especially at the prescribing and administration stages where rates vary from 12.3 to 1400 errors per 1000 admissions.1
The majority of evidence regarding the epidemiology of medication errors originate from inpatient settings. This body of evidence has stimulated the development and evaluation of inpatient medication error prevention strategies rooted on system factors analysis and technology, many of which have proven to be successful.3 Moreover, hospitals have well-established error reporting systems that allow for continuous monitoring and improvement in medication safety.4
Whereas much is known about hospital medication error rates in the USA, comparatively little is known about community pharmacy medication error rates. Specifically, medication errors that occur at the dispensing stage have been less frequently studied.1 5 6 Unlike hospitals where a pharmacy dispensing error can be detected and prevented by nursing personnel at the administration stage, in community settings the last checkpoint after pharmacy medication dispensing is the patient. Therefore, the potential for harm is higher considering the high volume of prescriptions filled in community pharmacies.7
In order to identify system problems that prevent community pharmacy dispensing errors and decrease patient harm, evidence of the rates and causes of dispensing errors must be generated. While some studies have outlined evidence of medication errors in community settings8 there are no systematic reviews summarising community pharmacy error rates. Therefore, the aim of this study was to determine the rate of community pharmacy dispensing errors in the USA and appraise the quality of evidence published studies.
Methods
Information sources and search
An electronic search was conducted in 10 bibliographic databases, PubMed/Medline, Embase, Cochrane Library, PsycINFO, International Pharmaceutical Abstracts, Web of Science, ABI/Inform, Academic Search Complete, and Dissertations and Theses. In addition, searches on relevant websites were conducted for observational and interventional studies that reported community pharmacist dispensing error rates in the USA from January 1993 to December 2015. The following keywords were used to search the databases: dispensing error, community, ambulatory, pharmacy and medication error. Additionally, synonyms and other search terms were used to ensure the search was as comprehensive as possible. A full description of the search strategy can be found here Supplementary data. The years of 1993 and after were chosen due to the passing of the Omnibus Budget Reconciliation Act of 1990 (OBRA ‘90)9 that specified pharmacists must conduct drug utilisation reviews and counsel patients prior to dispensing medications to reduce prescription error rates and increase patient safety.
Supplemental material
Study selection
An initial title screening was conducted on all identified studies from the database, citation and website searches to identify possible relevant studies that addressed our aim. An abstract screening tool was developed for this study to assess inclusion of the full-text article. Two independent reviewers screened each abstract and consensus was reached before articles were included for full-text review. A data extraction tool was used to identify the final studies for inclusion in the meta-analysis. To be included in the systematic review, studies had to be English language, peer-reviewed observational and interventional studies that reported community pharmacy dispensing error rates in the USA from January 1993 to December 2015. Mail order pharmacy studies were excluded. Studies with a denominator reflecting the total number of prescriptions in the sample were necessary for inclusion in the meta-analysis.
Data extraction
A standardised data extraction tool was created for the study. Data were collected on study characteristics and pharmacy characteristics. Study characteristics included study design, how the errors were identified (eg, direct observation, computer system), how the number of prescriptions used to estimate error rates was specified (eg, prescriptions filled during time frame, set number of prescriptions) and study duration. Pharmacy characteristics included pharmacy setting (eg, community, ambulatory clinic), number of prescriptions used to estimate error rates (denominator) and the number of pharmacies included in the study. Two independent reviewers, who resolved differences through consensus, extracted data from each report. If needed, any issues were brought to the study group for resolution.
Risk of bias assessment
Since no bias assessment tool currently exists for medication error studies, a tool was developed for this study. The risk of bias assessment tool is available in the online Supplementary data. Four sources of bias were assessed: (1) selection bias, (2) identification bias, (3) error categorisation bias, and (4) conflict of interest. Selection bias was defined as bias that could result from not including all eligible prescriptions or including non-eligible prescriptions; either event would artificially increase or decrease the denominator of the rate calculation resulting in spuriously high or low rates of errors. Identification bias was defined as resulting from the method used to identify the error, for example, a consensus procedure or use of reports. Use of reports is likely to result in under-reporting of errors. Error categorisation bias could result from not using a standard, recognised system for categorising errors so that one type of error would be spuriously increased or decreased. Conflict of interest refers to the bias of the investigators. Risk of each source of bias was rated as low, unclear or high. Two investigators independently assessed risk of bias and then met to resolve differences by consensus. Each article was assessed for bias using a tool developed for this study.
Supplemental material
Outcomes and prioritisation
The primary outcome measure was the rate (proportion) of community pharmacy dispensing errors.
Data synthesis
A random effects meta-analysis was used to obtain a summary error rate. Data were entered into Comprehensive Meta-Analysis (CMA) software and a forest plot was generated. An I2 statistic was used to describe heterogeneity between studies. A funnel plot and Kendall’s tau were used to assess publication bias. Stratified analyses were conducted to determine if the error rate was influenced by error identification methodology (secret shopper, observer, reviewer), pharmacy setting (community or other), number of pharmacies (single pharmacy vs two or more) and author affiliation group (Barker, Allan, Flynn vs other).10–12 A fail-safe N was calculated to determine the number of studies with an error rate of zero that would be needed to reduce the overall error rate to zero. The a priori alpha level was 0.05.
Results
Study selection
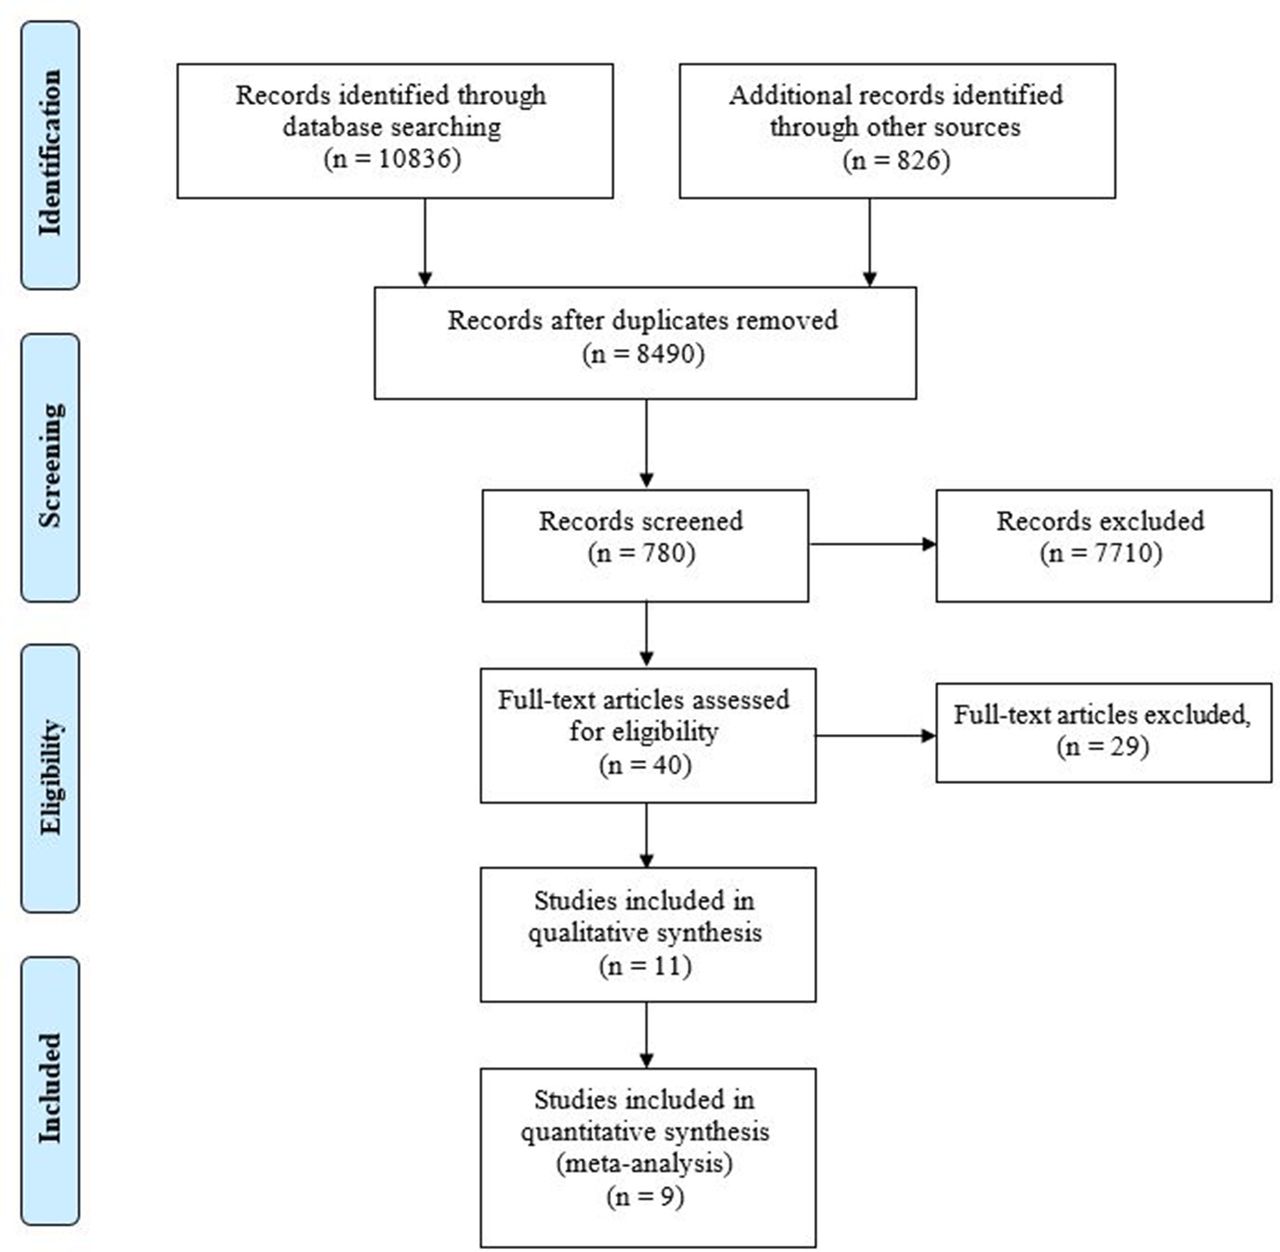
The search yielded a total of 8490 records, of which 780 abstracts were reviewed. The most common reasons for exclusion were: study conducted outside the USA; publication type; and study not reporting on ambulatory community pharmacy dispensing errors. A total of 11 articles were included in the systematic review and data were extracted. Additional information can be found in the Preferred Reporting Items for Systematic Reviews and Meta-Analyses 2009 flow diagram (figure 1).

Preferred Reporting Items for Systematic Reviews and Meta-Analyses (PRISMA) 2009 flow diagram.20
Study characteristics
The characteristics of the 11 studies included in the systematic review can be found in table 1. A total of 13 error rates were reported in the 11 studies; two studies (Flynn and Barker and Moniz et al) compared error rates between two study arms.10 13
Study characteristics
A majority of studies (n=6) used a prospective descriptive research design, two studies used a retrospective cohort design, two studies employed a before-after design and the study conducted by Chinthammit14 used a randomised controlled trial design. The number of pharmacies included in data collection varied between studies, ranging from 1 to 260 pharmacies. The study conducted by Basco et al 15 did not report the number of pharmacies or pharmacy type. Six studies reported retail pharmacy errors, three reported outpatient pharmacy errors and one study reported error rates for both settings.
Four methodologies to identify dispensing error were observed: two studies used direct observation; four used review/audit; two used a secret shopper method; and three relied on self-report. Observational identification methods required a researcher to monitor activities in the pharmacy and record the number of dispensing errors that occurred. Reviews involved a researcher auditing prescription files to determine the number of dispensing errors. The secret shopper method involved a collaborator presenting a prescription to the pharmacy and recording the number of deviations made to the hard copy prescription on receipt of a dispensed product. The self-reporting methodology required pharmacy staff members to record the number of dispensing errors during routine practice.
The number of prescriptions used to estimate error rates (denominator) varied between studies. Study denominators ranged from 100 to 1 420 091 prescriptions. Most studies specified a temporal denominator: five studies evaluated all prescriptions within a specified time frame; Basco et al 15 investigated lookalike soundalike (LASA) medications within a specific time period; Moniz et al 13 audited prescriptions with documented dispensing information within a specified time frame. The two secret shopper studies specified a set number of prescriptions to estimate the dispensing error rate. The studies conducted by Chinthammit14 and Rolland16 did not disclose the denominator specification or denominator value (provided the number of errors but not the error rate).
Results of individual studies
Figure 2 presents the dispensing error rates for the studies included in the meta-analysis. Dispensing error rates ranged from 0.00003% (43/1 420 091) to 55% (55/100). The lowest value was obtained from a study by Basco et al,15 in which errors were identified from a retrospective database analysis of LASA pairs. This method involved matching two drugs with similar looking or similar sounding names and identifying whether errors were made based on patient diagnosis data. The large number of prescription entries analysed in the database (1 420 091) and the relatively few errors (43) resulted in a dispensing error rate of 0.00003%. The highest error rate value was obtained from a study by Allan et al,11 in which 100 prescriptions that required pharmacist counselling were written and presented individually to pharmacies. In total, 55 of the 100 prescriptions were dispensed with an error.
Synthesis of results
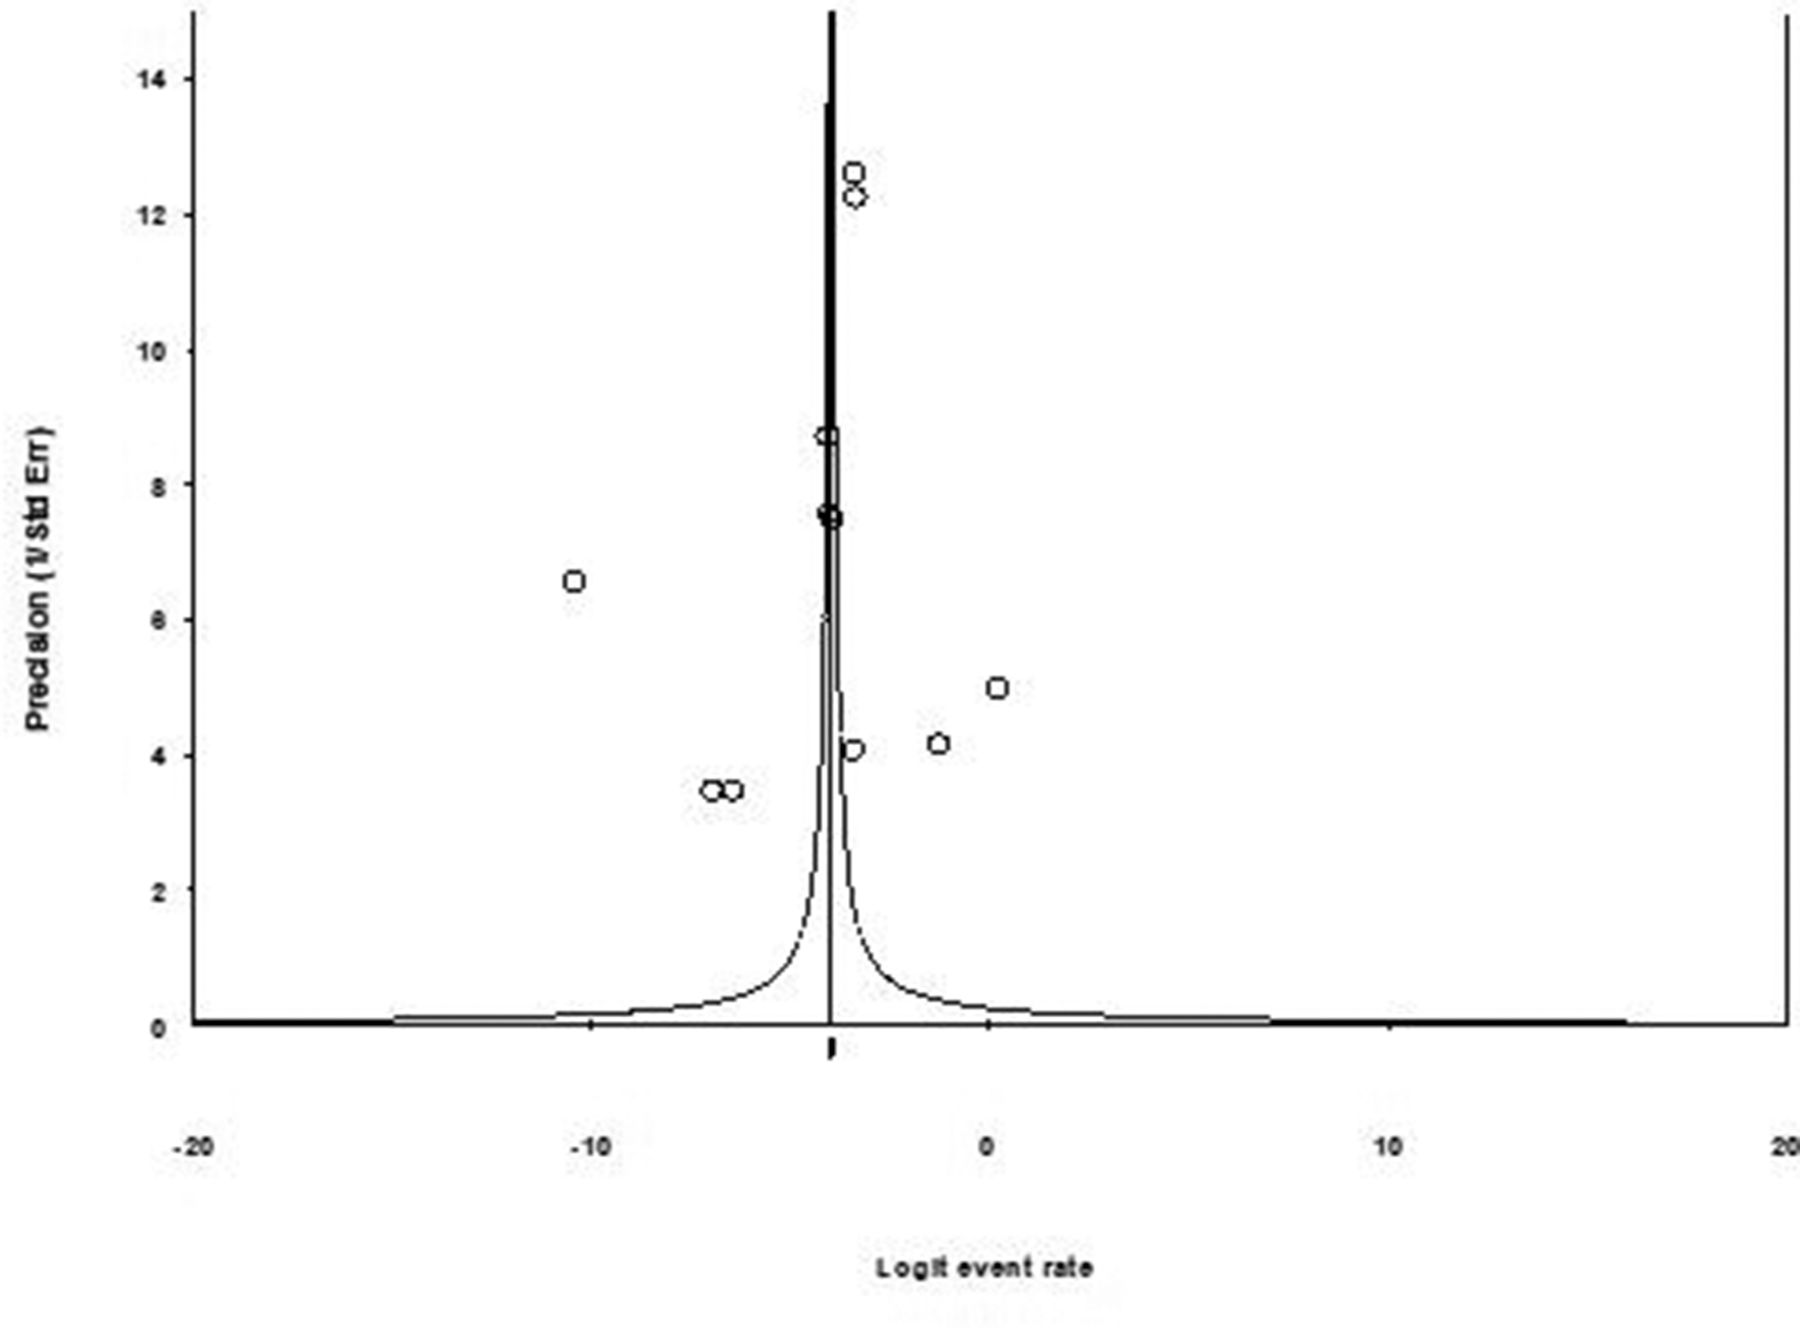
The meta-analysis findings are shown in figure 2. Nine studies (11 study arms) met the criteria to be included in the meta-analysis; two articles (Chinthammit and Rolland)14 16 did not have adequate data components to be included in the meta-analysis (ie, no denominator data were reported). A denominator of 1 461 128 prescriptions was available for analysis. The overall community pharmacy dispensing error rate was estimated to be 0.015 (95% CI 0.014 to 0.018). The number of additional studies needed to change the results (classic fail-safe N) of the meta-analysis was 5235. There is no evidence of publication bias based on visual inspection of the funnel plot (figure 3) or the Kendall’s tau statistic (p=0.484).
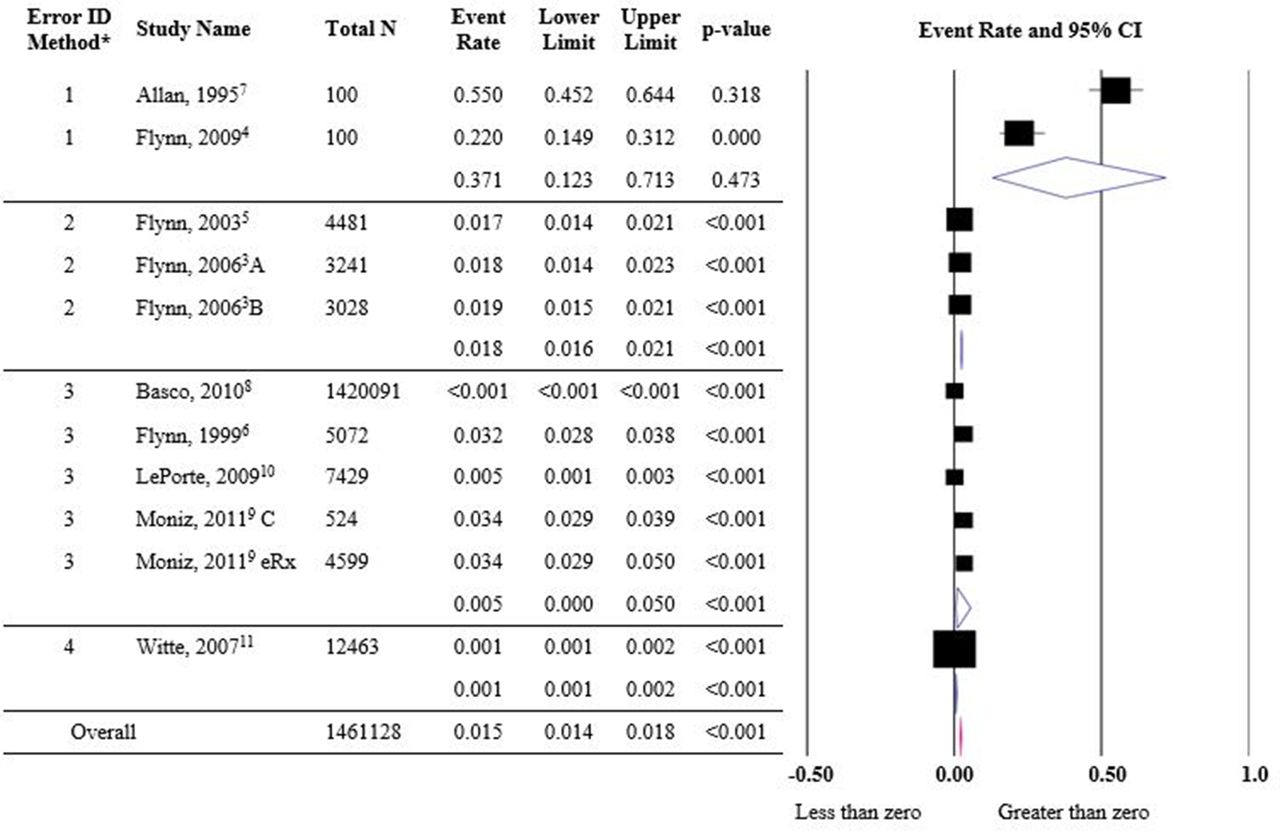
Forest plot of community pharmacy dispensing error rate. Error ID, error identification method: 1: secret shopper, 2: observation, 3: review, 4: self-report. Total n, number of prescriptions in which errors were assessed. Flynn and Barker10 A: chain pharmacy, B: independent pharmacy; Moniz et al 13 C: control prescriptions. eRx, electronic prescriptions. *Error identification methodology has a significant effect on error rates (p<0.001).

Meta-analysis funnel plot.
Heterogeneity of the data was apparent (I2=99.6). To determine the source of statistical heterogeneity, sensitivity analyses were performed. Stratification by study error identification methodology was found to have a significant impact on dispensing error rate (p<0.001), whereas stratification by number of pharmacies (p=0.396), pharmacy type (p=0.092) and author affiliation group (p=0.560) did not. Heterogeneity remained high regardless of stratification approach. A sensitivity analysis was performed to assess if the overall error rate and heterogeneity were affected by the study that assessed the largest number of prescriptions. In the one study removed analysis, exclusion of the largest study (Basco et al)15 increased the overall dispensing error rate to 0.025 (95% CI 0.12 to 0.53); however, heterogeneity still remained high (I2=98.76).
Stratified analysis findings using error identification methodology are found in figure 2. The secret shopper identification method (two studies) had the highest dispensing error rate of 0.371 (95% CI 0.123 to 0.312). The observation method (two studies) and the retrospective review method (five studies) resulted in a moderate error rate of 0.018 (95% CI 0.016 to 0.021) and 0.005 (95% CI <0.001 to 0.050), respectively. The one study using a self-report method had the lowest dispensing error rate of 0.001 (95% CI 0.001 to 0.002) among all error identification methodologies.
Risk of bias in included studies
The results of the bias assessment evaluating four factors that can influence study results are shown in table 2. Selection bias was considered high for four studies, low for four studies, and in one study selection bias was unclear. The four studies classified as having high selection bias used a specific subset of prescriptions to estimate error rates: Allan et al 11 and Flynn et al 12 estimated dispensing errors using 100 study-created prescriptions; Basco et al 15 evaluated errors associated with LASA medications; and the study by Flynn et al 17 evaluated the first 100 prescriptions filled while an observer was present. Identification bias was low for most studies (n=6). The study by LePorte et al 18 did not provide enough information to assess identification bias. Two studies were classified as having high identification bias due to a lack of objective dispensing error identification methodology; Witte et al 19 relied on self-report and Basco et al 15 relied on identifying errors based on diagnosis codes and dispensed LASA medications. Classification bias was low (n=6) or unclear (n=3) for the studies included in the meta-analysis. Conflict of interest was regarded as low for a majority of studies (n=7). The study utilising self-report methodology was rated with a high conflict of interest, as the study findings could reflect on the author’s work performance. Conflict of interest could not be determined for one study due to lack of information.
Risk of bias assessment for included studies
Discussion
This study is the first to estimate an aggregate of community pharmacy dispensing error rates in the USA using the available published literature. The most important findings from this meta-analysis are: (1) there are very few published articles that describe the rates of community pharmacy dispensing errors; (2) a higher overall rate of community pharmacy errors was identified than perhaps conventional wisdom predicted; and (3) a difference was observed in the error rates depending on study methodology. Each of these issues is discussed below.
The most significant finding of this study is the identification of a limited number of published articles concerning community pharmacy dispensing errors. A total of 11 studies were identified in this systematic review and meta-analysis describing the rate of errors among nearly 1.5 million prescriptions. Given that in 2005 there were 3.6 billion prescription medications dispensed in community settings, an increase from the 2.1 billion dispensed in 1994,20 these 11 studies do not provide adequate coverage of the dispensing practices in the USA. Currently it is thought errors in the community setting are of a greater magnitude than those in the inpatient setting.21 The nature and magnitude of these medication errors must be elucidated before successful prevention strategies can be established. Clearly, a robust investigation is needed to assess community pharmacy dispensing error rates in the USA. Once this is accomplished, time should be spent designing and conducting studies to determine which interventions effectively decrease medication error rates.
This meta-analysis revealed a higher overall community pharmacy dispensing error rate than perhaps conventional wisdom predicted (ie, the error rate in community pharmacies appears to be between 1.4% and 1.8% of all prescriptions). This result underscores the need for community pharmacies to ensure that they are engendering a culture of safety in which pharmacy staff members are encouraged to record errors and near misses in a manner that does not blame or shame the reporter.22–26 Also, as recommended by the IOM,18 all pharmacists should be trained in quality improvement techniques so that they will have the requisite knowledge, skills and attitudes required to identify potential quality and safety problems and be empowered to take action to improve the identified problems. All pharmacy personnel should receive quality improvement training so that improving quality and safety can be a team effort.26
This study identified a difference in error rates based on error identification methodology (eg, a higher rate was identified for secret shopper studies). Others have noted the methodological difficulties of medication error research.27 Specifically, Flynn et al found that error identification methodologies (ie, direct observation, chart review, self-report) differed in their ability to accurately detect medication errors in an inpatient setting.27 Thus, a similar result may also be expected in the outpatient setting and should be kept in mind when evaluating medication error studies and when designing future studies. For the secret shopper study, the high dispensing error rate (55%) may be attributed, at least in part, to the fact that these prescriptions were purposefully designed to elicit the potential for dispensing errors.
Implications
This systematic review and meta-analysis has several implications that should be noted. While systematic reviews have included community pharmacy medication error rates,8 this is the first meta-analysis to estimate an overall dispensing error statistic. This study supports the findings of the systematic review conducted by James et al, as the authors indicated few US studies published reported estimates of community pharmacy error rates.8 Additional research is needed with improved standardised error reporting (ie, to ensure the denominators of each study are reported so rates can be assessed) to more accurately describe the safety of dispensing practices in community pharmacy.
This study identified a higher overall rate of community pharmacy dispensing errors than was expected. Subsequently, policies concerning pharmacy error benchmarking and error reporting should be examined. Should pharmacies have an error benchmark policy and should the findings of this meta-analysis be used as benchmark standards until better data become available? Alternatively, should pharmacies use benchmarks for errors? One could argue for or against error benchmarking. A benefit of benchmarking is the inherent acceptance that errors are inevitable in an imperfect system and should encourage error reporting. Benchmarks can also monitor error rates to identify opportunities for system-level improvement. A downside of an error benchmark is that it may promote the concept that errors up to the benchmark rate are acceptable, which may be detrimental for patient confidence in the pharmacist. Furthermore, some errors have the potential to cause patient harm—should there be differential benchmarks for severity of errors? Undoubtedly there will be continued debate over the utility of benchmarking error rates in community pharmacy and if one were to be used, it should be developed using sound data and a variety of stakeholder perspectives.
Based on our study, it is apparent that the methodology used to identify errors has a significant impact on error rate estimation. Based on the results of this meta-analysis as well as the work of Flynn et al 27 it may be recommended that future error studies use observational techniques to estimate error rates. Observation methods may lead to a more accurate depiction of medication error rates as they allow for the observation of real-world medication dispensing processes. In addition, studies should use a standardised definition of a dispensing error, namely any deviation from the written prescription. Another important aspect for researchers to consider is the specification of a denominator as it directly links to the generalisability of findings. It is also critical for denominator values to be reported so rates can be compared.
While we did not assess it in this study, the authors feel it is important to call for additional studies that assess the impact of error reduction techniques. Identifying a dispensing error rate is important but should not be generated without a context for use; additional focus is needed on error prevention strategies in the community pharmacy setting. Some studies have shown that errors can be identified using the Indian Health Service counselling method of opening the bottle and using teach back techniques.28 Other studies have identified that adding additional patient information helps pharmacists to identify medication errors.29 This trend has continued as more authors have identified a need to provide pharmacists with additional patient information such as diagnosis or reason for use to prevent medication errors.30–33 Additional research in this area is needed.
Limitations
While every effort was made to design and carry out this study with the upmost rigour, it, like all studies, has limitations. A large number of years were excluded for analysis to account for the implementation of OBRA ‘90 in 1993.9 Thus, 1993 was used as the starting point for study inclusion. Even using this wide inclusion window, few studies were identified as assessing dispensing error rates in community pharmacy in the USA. Additional studies would have been included if they contained sufficient information such that an error rate could be elucidated. The authors would like to see guidelines developed for reporting of community pharmacy error rates so that more complete information will be presented in subsequent manuscripts.
It is important to keep in mind that this meta-analysis examined only deviations from the prescription order and not drug utilisation review errors or other types of prescription errors. In addition, error severity or the number of errors that caused patient harm was not assessed, as that was not the aim of this study.
Many different study methods were included in this meta-analysis. As noted previously, significant heterogeneity was identified, and some may argue that such disparate studies should not be used to synthesise an overall rate using meta-analysis. However, the authors contend that this meta-analysis, while admittedly imperfect, brings to light that community pharmacy errors happen and that there is a dearth of information on their rates. Once additional studies are published in this area, perhaps it will be possible for a meta-analysis to be completed that shows less heterogeneity.
Conclusions
There are few published articles that describe community pharmacy dispensing error rates in the USA. Based on the limited information reporting the current rate of community pharmacy dispensing errors, an overall rate was estimated to be 0.015 (95% CI 0.014 to 0.018), indicating that 1.5% of all prescriptions have an error in the community setting. Four methodologies were observed to identify community pharmacy dispensing errors: self-report, direct observation, chart review and secret shopper. These methodologies have an impact on error rate estimation. It is important to evaluate the nature and magnitude of the problem to establish successful prevention strategies, thus a robust investigation is needed to assess dispensing error rates in the USA.
Acknowledgments
The authors acknowledge Marcus Palm, Deo Mopera, Mel Nelson and Tyler Gallo for contributions to this project.
References
Footnotes
Contributors PJC assisted with search strategy, performed article screening, conducted meta-analysis, contributed to the writing of the manuscript, edited manuscript and submitted manuscript. MP, ALH, DRA and TLW assisted with search strategy, performed article screening and contributed to the writing of the manuscript. JRM assisted with the search strategy development, conducted literature search and maintained reference documentation. MS assisted with search strategy, conducted meta-analysis and contributed to the writing of the manuscript.
Funding The authors have not declared a specific grant for this research from any funding agency in the public, commercial or not-for-profit sectors.
Competing interests None declared.
Patient consent Not required.
Provenance and peer review Not commissioned; externally peer reviewed.