Article Text

Abstract
While the reported incidence of heroin use in the UK has reduced, related hospital admissions and associated mortality have continued to increase. Prompt access to treatment (opiate replacement therapy (ORT) and counselling support) have been shown to reduce risk and offer clients the optimal route to recovery. The Specialist Drug and Alcohol Recovery Service (Osprey House) within National Health Service Highland had lengthy delays from referral to commencing ORT (median wait 56 days), which this project aimed to reduce.
A rapid process improvement workshop (RPIW) was undertaken to redesign the patient pathway from referral to recovery. The RPIW consisted of three phases: phase I, planning and preparation (12 weeks before the workshop week); phase II, the workshop week; and phase III, the follow-up. Metrics included the lead time from referral to initiating ORT and other process measures at baseline, and then repeated at 30, 60, 90 and 180 days, respectively. Additionally, data were routinely collected on the percentage of clients treated within 3 weeks, as was weekly data on the new process of screening clients within 1 day of referral. Multiple lean tools and techniques, including Plan, Do, Study, Act cycles, were used to test and implement new ways of working.
Results at 180 days found the median time from referral to initiating ORT improved from a baseline of 56 to 21 days (63% improvement), room usage improved from 49% to 65% (32% increase) and standard work improved from level 1 to level 3. Increases in the number of clients treated within 3 weeks were demonstrated. Other metrics remained static or reported fluctuations too inconsistent to claim improvement at this point.
By applying the Lean principles of removing waste and increasing value, we have redesigned our service, reducing the length of time clients with drug problems wait from referral to commencing ORT.
- lean management
- patient-centred care
- continuous quality improvement
- mental health
- healthcare quality improvement
This is an open access article distributed in accordance with the Creative Commons Attribution Non Commercial (CC BY-NC 4.0) license, which permits others to distribute, remix, adapt, build upon this work non-commercially, and license their derivative works on different terms, provided the original work is properly cited, appropriate credit is given, any changes made indicated, and the use is non-commercial. See:©http://creativecommons.org/licenses/by-nc/4.0/.
Statistics from Altmetric.com
- lean management
- patient-centred care
- continuous quality improvement
- mental health
- healthcare quality improvement
Problem
Opiate misuse remains a major healthcare concern. Despite a reduction in reported heroin use, related hospital admissions and associated mortality have continued to increase over the last decade.1 Within National Health Service (NHS) Scotland, there are national targets that aim for 90% of clients with a drug problem to be in treatment within 3 weeks of referral, with no-one waiting over 6 weeks.2 A case note review within the Specialist Service, NHS Highland, found that the median wait time for treatment was 8 weeks (56 days), highlighting an urgent need for improvement.
The NHS Highland population of 320 000 people is spread over 32 500 km2, making it one of the largest and most sparsely populated Health Boards in the UK. The Drug and Alcohol Recovery Service within NHS Highland includes a Specialist Service at Osprey House, as well as nine community drug and alcohol recovery teams covering both urban and remote and rural areas. The service provides a range of interventions for people with drug and alcohol problems. This project focused on clients with opiate drug problems. This paper reports the initial improvement work conducted at Osprey House and five community drug and alcohol recovery teams.
Clients requiring opiate replacement therapy (ORT) are usually referred to the Specialist Service for initial commencement and stabilisation, after which they are passed on to community teams. There were an average of 21 new referrals per week to the specialist service, with less than one client discharged or handed over to the community teams per week, resulting in a growing pool of clients and an increasingly pressurised work environment. The service was also undergoing a major redesign, resulting in five community teams and the Specialist Service becoming a single service under one management structure.
Lean quality improvement methods are embedded within NHS Highland’s Highland Quality Approach, with 89 rapid process improvement workshops (RPIWs) completed to date. This project aimed to reduce the median time from referral to initiating ORT (the lead time for this process) within the Specialist Service.
Background
Improving outcomes for people with opiate drug misuse is of international concern; Scotland has one of the highest rates in Europe.3 The USA has a higher rate of opiate use than all European countries, but this includes both prescribed narcotics and illicit heroin use.4 Illicit drug use includes various drug types, but opiates are the most commonly misused drug by those with drug problems.5 6 Of 5 million people in Scotland, there are 61 500 people experiencing opiate drug problems.7 Opiate drug problems are associated with high mortality and place a high burden on healthcare services, as well as the wider society; the focus of this improvement work was on opiate use. The health effects of opiate misuse are multifactorial, including symptom withdrawal, infection risk, cardiac and neurological damage, as well as the wider psychosocial consequences of illicit drug-seeking behaviour.5 People requiring treatment for drug problems are often involved in criminal activity, imprisoned and even homeless as a direct result of their drug-seeking behaviour.8 These vulnerable populations are more likely to have a history of familial addictions, dysfunctional relationships, unemployment, mental health problems and a general lack of resources and support.9
ORT is the current treatment choice, with evidence suggesting that early treatment improves client outcomes.3 10 Evidence from randomised controlled trials suggests that ORT reduces heroin use11 and mortality.12 The purpose of ORT is to replace illicit opiate use (commonly heroin) with prescribed oral medication to provide safer dosage, reduce the infection risk and reduce the risky behaviour associated with illicit drug use.13 Goals are recovery focused and tailored to individual needs, and range from remaining in treatment to complete drug cessation. A recent systematic review found that engaging and retaining people in treatment reduces their mortality risk during and after ORT.14 International evidence suggests that current optimal treatment involves the combined use of both medication (ORT) with counselling and behavioural therapies.15
Those who have an opiate drug problem tend to live chaotic lives, which is likely to influence their ability to attend scheduled outpatient appointments. The did not attend (DNA) rate for the specialist service at Osprey House was 38%, which contributed to the clients’ overall delay in commencing treatment. A baseline case note review found clients waited an average of 8 weeks from referral to ORT initiation. A local audit also revealed that clients waited an average of 3 weeks from referral to initial assessment, a necessary step preceding ORT initiation. Clients are generally referred at a point of ‘readiness,’ with waiting for an appointment resulting in missed opportunities for ‘intention to change’ behaviour.16 An essential aspect of recovery is therefore accessing timely treatment. This project aimed to reduce the wait time from receipt of referral to clients commencing ORT, from an average of 56 days to 22 days, within 6 months.
Measurement
During phase I (Planning and Preparation), various time observations and audits were conducted within the clinical area to create a value stream map (VSM) of the current process from referral to discharge for all clients accessing the drug and alcohol services (see online supplementary file 1: Value Stream Map Current State). Completing the VSM and working with the team and clients enabled identification of the focus of the RPIW, for work to begin on obtaining baseline metrics and for targets to be set. An overall aim of a reduction in the lead time to 22 days from referral to ORT was selected, based on what mattered to the clients (evidence of the effectiveness of prompt ORT treatment3 10) and data from the VSM. Lead time was calculated using case notes. Twenty case notes were randomly selected from clients currently in the service. The number of days from receipt of referral to ORT commencement was recorded for each client and the median number of days calculated. Additionally, data were routinely collected on the percentage of all clients commencing treatment within 21 days.
Supplemental material
Given that the central premise of Lean is to reduce waste and increase value from the customers’ (in this case clients’) perspective,17 the Care Experience Feedback Improvement Tool (CEFIT) was used as a metric. CEFIT is a brief survey tool, which has good structural validity and internal reliability (Cronbach’s alpha 0.78) making it an appropriate tool for repeated quality improvement measurement.18 The maximum score attainable with CEFIT is 25, and this is also the target score, as it is designed with the ambition of high quality of care for every patient, every time. The CEFIT was completed by clients in treatment during phase I and at subsequent data collection points. Responses were used to direct improvements (detailed in Results section).
The DNA rate was highlighted as a likely factor in the overall delay in clients commencing ORT. The DNA percentage process measure data were calculated by counting the number of people who did not attend their first appointment divided by the number of first appointments booked and multiplied by 100.
Standardisation is a key principle within the Lean improvement methodology and is part of the 5S tool (Sort, Simplify, Sweep, Standardise, Sustain).17 The theory is that standardising procedures reduces variation, which reduces the rate of error and waste. The 5S Audit Tool has a scoring system of 1–5; from level 1 (no standardisation) to level 5 (standardised and all staff working towards continuous improvement).19 The team agreed to set a metric for standard work for the referral pathway into the service at level 4 (standardised and a reliable checking procedure in place).
Given that improving flow into treatment would increase the number of clients and pressure within the Specialist Service, there was a need to consider the whole flow of the clients’ journey. Treatment as early as possible was the main recovery focused aim, but there was also a need to set a target to increase the number of clients being discharged back into the care of community teams. A target was set for 14 clients ‘moving on’ every week, but this was set to be achieved by the 12-month point, to enable time for significant service redesign. The team defined ‘moving on’ as clients either discharged from Specialist Service or transferred to Community Teams.
Clinical staff highlighted concerns that throughput of clients could not be increased due to lack of consulting rooms. A room usage audit tool was developed, which highlighted that rooms were only being used 49% of each week. A target of 85% was set for when the service is fully staffed.
Design
During phase I, clinical teams received a presentation on Lean. They were also asked to identify areas of waste and generate ideas for improvement, and were provided with regular updates of data collection and planning. The team also developed a process flow map of the current state of the clients’ journey from referral to discharge (see online supplementary file 2: Process Flow Map Current State). MP attended a client run support group, which highlighted areas for improvement.
Supplemental material
Phase II of the RPIW involved the ‘away team’ participating in a week-long improvement workshop. Members of the away team were selected by the process owner (who is responsible for the ongoing implementation and metrics during phase III). Selection was based on clinical roles and availability and included doctors, nurses, pharmacists, administrators and managers. The ‘home’ team (everyone else) kept the service running and were prepared to ‘test’ new ways of working identified by the away team. We also had an advisory group that consisted of a variety of experts, available as needed throughout the week. The advisory group included a client in recovery.
Participants were taught various Lean tools and techniques on day 1 of the workshop week, and were then asked to consider application to their service, with encouragement to note any additional wastes or new ideas. Wastes were added to an A0 poster-sized waste wheel and ideas were captured on an ideas form. Clinicians and clients identified 84 wastes and 45 improvement ideas. During day 2, the team reviewed the wastes and ideas and redesigned the clients’ journey by creating a future state process flow map from referral to discharge (see online supplementary file 3: Process Flow Map Future State). The team divided into three groups, based on areas identified for improvement, with the aim of developing a recovery pathway: screening and administration, assessment and treatment, and transfer and discharge.
Supplemental material
The remainder of phase II (workshop week) was spent coaching the team to develop new ways of working, by applying Lean tools and techniques and ‘testing’ using Plan, Do, Study, Act (PDSA) cycles. Interventions included the development of a telephone screening system to replace clients waiting for an assessment appointment. While we found no evidence of the effectiveness of telephone screening for this particular purpose, studies using telephone interventions for alcohol addiction have reported the method as feasible and acceptable.20 We predicted that immediate access for clients via telephone screening would enable quicker access to treatment. A standardised script was developed to ensure consistency of approach for telephone screening.
The team designed a visual control board to highlight the availability of both clinical staff and rooms. There was an assumption that this would enable potential clients to be allocated an assessment appointment at the end of telephone screening. The ergonomic design of the workplace and processes is a key Lean tool to improve flow.21 Streamlining the movement of clients through the building can reduce waste,21 either shortening appointment duration or enabling more actions to be carried out for the client during one consultation. Although a client walking for an extra 5 min may not seem burdensome, multiplied it accumulates. A process work sheet (floor map of the building with annotations of flow of clients, clinicians and equipment) was completed to identify waste from unnecessary client and staff movement. The process work sheet was used to redesign the flow of clients and to submit a proposal for building works.
From first assessment to ORT clients usually required three to four 1-hour appointments. A new ‘one stop shop’ approach to the assessment/treatment process was developed, which aimed to reduce the number of client appointments. The theory was that by reducing client movement and standardising procedures (reducing waste), more tasks could be completed during appointments, thereby reducing overall wait to commencing ORT. The prediction was that in the redesigned pathway, clients could be assessed over a single 1.5-hour appointment (see online supplementary file 4: Value Stream Map Future State). Reducing the number of appointments would also help the clients who often find attending appointments difficult.
Supplemental material
Strategy and improvement cycles
Multiple PDSA cycles were conducted to test and implement new ways of working.22 The main PDSA ramps used to describe the iterative testing and learning within one area of improvement are summarised here.
PDSA Cycles Ramp 1: Two nurses developed a standardised form for telephone screening. The aim of the first cycle was to test the length of time required to conduct telephone screening using the standardised form; the prediction was within 30 minutes (mins). The first test was a simulation between the two nurses during day 3 of the RPIW week. Screening was completed within 10 min, plus 5 min to complete paperwork. Adapting, for the second cycle a 10–15 mintelephone screening test was scheduled with a former client on day 4 of the RPIW week. The aim of the second test was to determine the appropriateness of the screening questions from the clients’ perspective and time the length of the call. Screening was completed within 10 min, but the order and wording of the form needed amending. The third cycle, on day 4 of the RPIW week, was to test with staff who had not developed the criteria, predicting screening completion within 15 min. The cycle was a success and included the client being given an assessment appointment within seven working days. Further PDSA testing and refinements resulted in implementation of a standardised form by week 8 post-RPIW.
PDSA Cycles Ramp 2: A visual control board was developed during the workshop week, with testing starting the week after the RPIW. The purpose of the board was to enable rapid allocation of clients to assessment appointments at the end of telephone screening. The first PDSA cycle was unsuccessful; the nurse was unable to allocate the client a rapid appointment as the board had been located within the administration office and not where the screening calls were routinely received. The visual control board was relocated to the main reception area and testing of one call was then successful. Subsequent PDSA cycles have enabled refinements of the board, which now has the dual purpose of enabling allocation of appointments and providing a visual display of staff location and activity. All PDSA cycles for testing the board were complete by day 60 post-RPIW week.
PDSA Cycles Ramp 3: The team devised a flow diagram of the process activities needed to enable a ‘one stop shop’ approach to assessment/treatment. The first PDSA cycle, on day 3 of the RPIW week, involved a member of staff simulating a client’s journey through the department, to test whether steps and timings were correct. The order of steps needed some adjustment to prevent unnecessary waits. Cycle 2, during the first week after the RPIW, was testing with a client in practice to determine whether the process would work and how long it would take. The process was successful and could be completed within 1.5 hours. Cycle 3 involved testing the understanding of the standard work with new staff, which resulted in further refinement. The ‘one stop shop’ is now embedded within the Specialist Service. PDSA cycles for this change were completed within 60 days from the RPIW week.
Results
Table 1 provides a description of the baseline metrics and results during the RPIW week and at 30, 60, 90 and 180 days. The percentage improvement is calculated from baseline metrics to 180 days. The project achieved its overall aim of reducing the lead time from referral to ORT to 22 days (actual result 21 days). Note that the lead time in the RPIW week of 29 days was a simulation. By 90 days, the wait had reduced to 25 days (a 55% improvement) and at 180 days the wait for ORT was 21 days (a 63% improvement).
Descriptor of results
Other process metrics demonstrated improvement from baseline to 180 days; standard work for referral pathway into service was improved from level 1 to level 3 indicating that the common standard is known and in use.19 Room usage had improved by 32% (from 49% to 65%). These metrics miss the 180-day target set (level 4 and 85%, respectively), but it is anticipated they will be achieved by 365 days. Room usage is hampered by current staff vacancies.
The DNA rate over time shows no real change. Similarly, there was no short-term improvement in the number of clients transferred or discharged from the specialist service per week. New ways of working to support clients moving on were designed, but needed a skill mix review, and recruitment and training of healthcare support workers (ongoing).
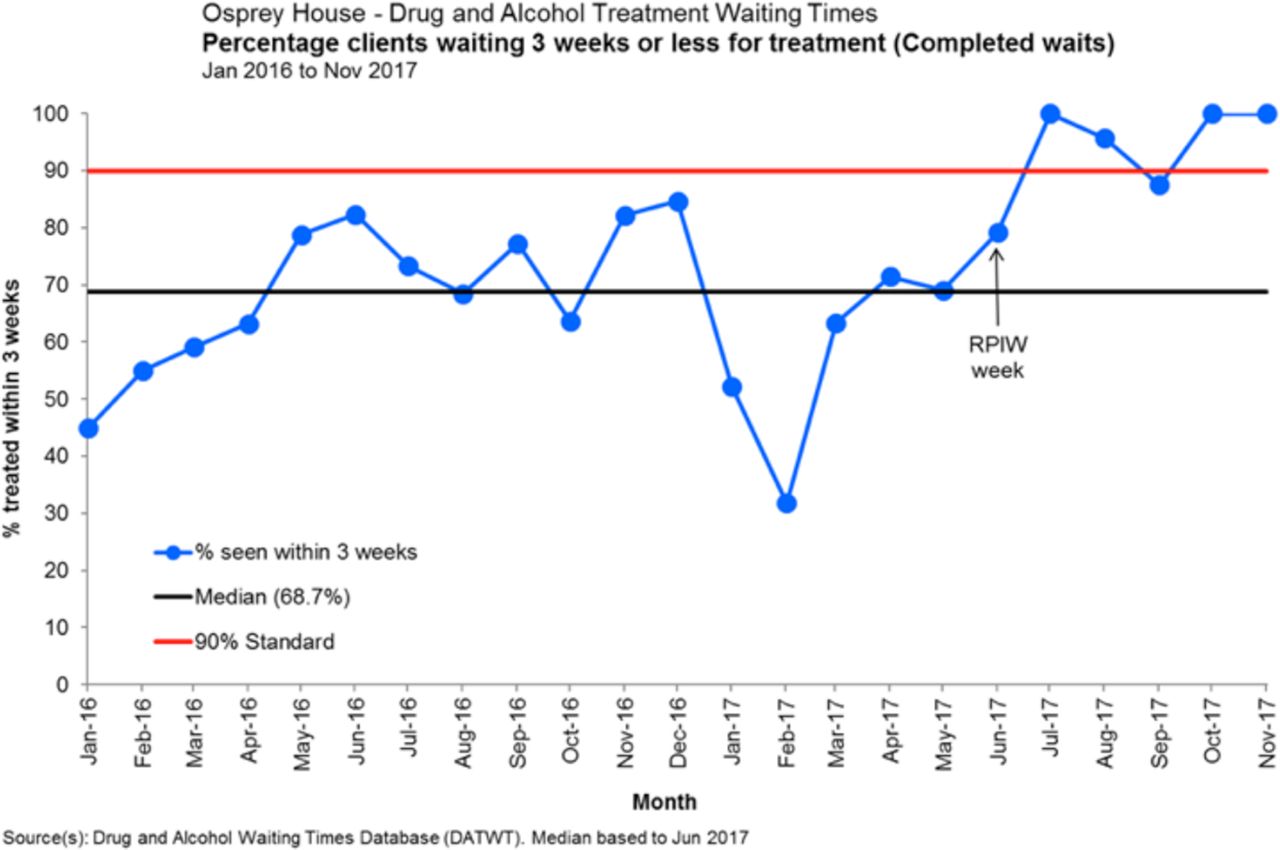
Clients waiting 3 weeks or less for treatment. RPIW, rapid process improvement workshop.
The run chart in figure 1 plots monthly data for the percentage of clients (drug and alcohol) who have commenced treatment within 3 weeks of referral. Prior to the RPIW, the service was consistently unable to attain the national target of 90% of clients being treated within 3 weeks. Following the RPIW, the percentage of clients treated within 3 weeks has improved. Run chart rules to determine whether or not fluctuations in data are due to random noise or to actual change are based on laws of probability. One of the run chart rules is a ‘shift’, when six or more consecutive data points are present on the same side of the median (data points on the median line are disregarded).23 This run chart shows evidence of a shift, indicating actual improvement, rather than random variation.

![[bmjoq-2017-000295-SP1.jpg]](https://bmjopenquality.bmj.com/content/bmjqir/7/3/e000295/DC1/embed/inline-supplementary-material-1.jpg?download=true)
![[bmjoq-2017-000295-SP2.jpg]](https://bmjopenquality.bmj.com/content/bmjqir/7/3/e000295/DC2/embed/inline-supplementary-material-2.jpg?download=true)
![[bmjoq-2017-000295-SP3.jpg]](https://bmjopenquality.bmj.com/content/bmjqir/7/3/e000295/DC3/embed/inline-supplementary-material-3.jpg?download=true)
![[bmjoq-2017-000295-SP4.jpg]](https://bmjopenquality.bmj.com/content/bmjqir/7/3/e000295/DC4/embed/inline-supplementary-material-4.jpg?download=true)
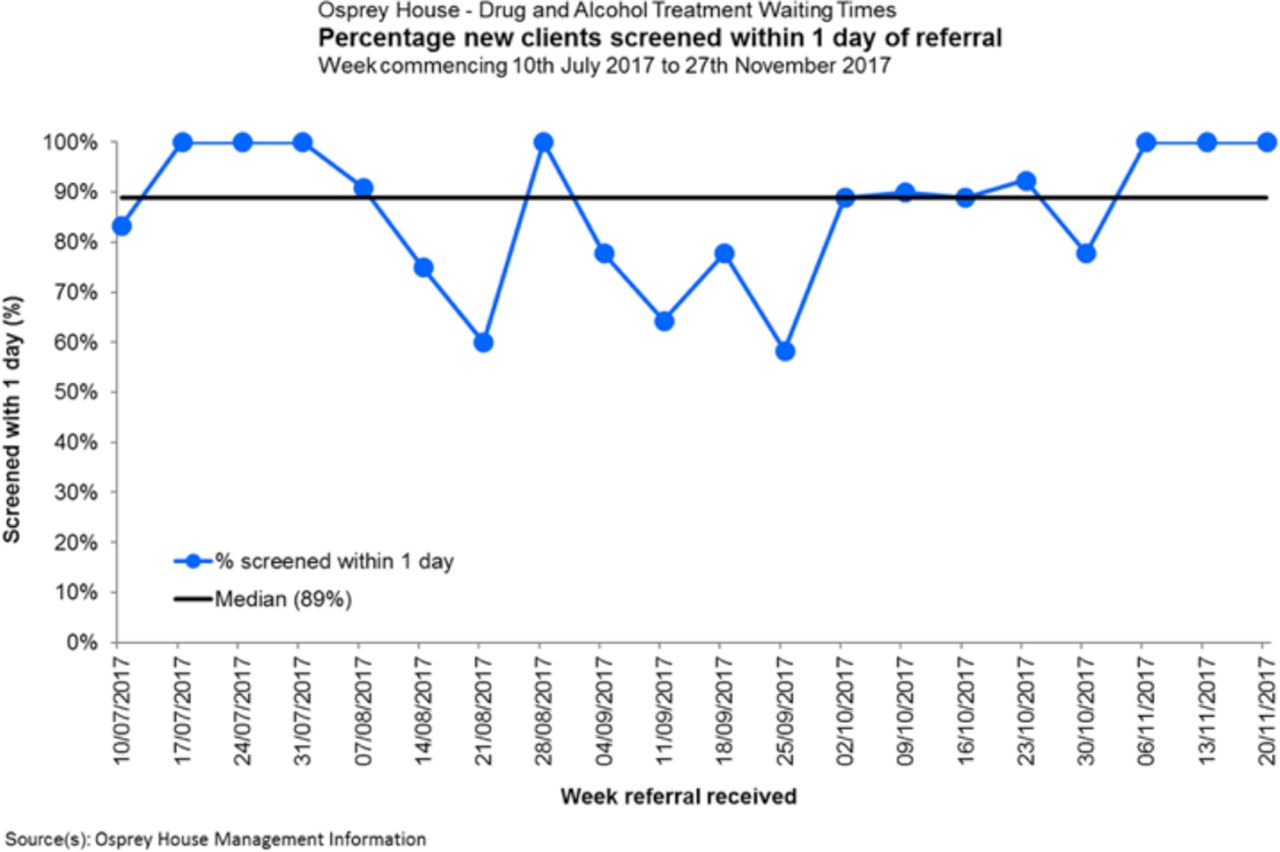
New clients screened within 1 day of referral.
The run chart in figure 2 shows the percentage of all clients (drug and alcohol) screened within a day of referral. This was a major change in the service design following the RPIW. The run chart indicates variation, expected in the early stages of a new process. From October onwards, the data in the run chart are beginning to move in the anticipated direction. There are indications of the positive impact on other areas of the service; beyond clients with opiate drug problems. Redesign will have benefits for clients with alcohol problems as well.
Lessons and limitations
The project aim was to reduce the time that clients waited between referral and commencement of ORT, with a key focus on removing waste and enhancing value in the current process. No direct causal effect can be claimed between the redesign of the process from referral to initial ORT, including the introduction of telephone screening and reduction in the number of appointments needed, and the reduction in wait time. However, we believe these interventions contributed to the overall reduction in clients waiting from referral to commencing ORT. The robustness of data could have been improved with more data points, but data collection needs to be balanced with workload.
Despite improving timely access to screening, initial assessment and treatment, the DNA rate remained variable, with no evidence of sustained improvement. It may be that system and staff behaviours changed, but client behaviours remained the same. Or it could be that shifts in attendance and associated metrics may take longer to demonstrate improvement. Either way, clients are now consistently commencing treatment within 21 days of referral, which would only have been possible by redesigning the recovery pathway. While we engaged clients during data collection (informal discussions in the waiting area, attending a client-led support group and analysis of 93 CEFIT questionnaires), it would also have been beneficial to have a client present on the away team for the RPIW week.
A key lesson learnt during the RPIW was the effect of the change on other parts of the healthcare system. Although the focus of the improvement work was to reduce clients’ wait from referral to ORT, doing so resulted in the need to redesign the whole client journey. For example, designing a moving on clinic to fit with the philosophy of a recovery service required work with community pharmacists around prescribing ORT, as well as creating new posts and associated job descriptions. The concept of systems thinking, or complex adaptive systems, is well represented in improvement literature,24 25 but balancing the scope of an improvement project with associated system connections can be challenging.
Other systems-related challenges included information technology, telephone and building infrastructure, some of which are work in progress. For example, the telephone triage process was initially delayed due to the need to upgrade the telephone system. Lessons learnt from this include the importance of an Executive Sponsor to champion and prioritise the necessary work. Plans require realistic timeframes; that is, local changes requiring wider system changes are not usually achieved quickly. It is also important to address the whole value stream to improve a service. For example, there is ongoing work to achieve the target of 14 clients per week ‘moving on’. The ongoing nature of improvement work needs to be balanced with celebrating small wins en route, to maintain motivation. A key principle of the Lean philosophy is continually seeking perfection.17
The majority were positive and supportive of change. Strategies to support those who were more resistant to the change included involving them directly within the RPIW, reinforcing that waste was always about systems and processes and not about people, and allowing small-scale testing and adaptations. Staff who are ambivalent about the change need to be supported through the transition.
The use of PDSA cycles proved invaluable. The team often commented on the usefulness of being able to test and learn from sequential rapid improvement cycles to devise solutions that fitted the local context. As supported in the literature, we found that, regardless of the scale of the problem or solution, using PDSA cycles as an experimental method to formulate and test our hypothesis and learn iteratively was of great value.22
Conclusion
In summary, there was evidence that timely access to ORT needed to increase to improve outcomes for clients.8 14 Baseline data confirmed that whole service redesign was necessary to ensure clients’ timely access to treatment. The inflexibility and lack of responsiveness of a scheduled appointment system for chaotic clients had led to a ‘revolving door syndrome’ for those requiring treatment. Multiple interventions, initiated from designing a future state value stream map, led to a reduction in the median time from referral to initiating ORT.
It would have been helpful to include a financial metric. The delay between change and financial improvement, and the interaction of budgets in the value stream, made it difficult to do so. For example, the Specialist Service may benefit financially from the moving on clinic, but it may increase the community prescribing cost. Lean accounting may be the answer, with financial metrics across a value stream (or patients’ journey) as opposed to within individual departments, with timely financial reporting.26
The metrics will continue to be formally reported until 365 days, with subsequent data collection agreed to balance the burden of data collection with the need to share and spread best practice.
Acknowledgments
We would like to thank the staff from Osprey House and the Community Drug and Alcohol Recovery Teams for their ongoing participation in this quality improvement work. Thanks also to the clients for their feedback and participation in various testing. Special thanks to the Kaizen Promotion Office for supporting the administration of the RPIW. We would also like to thank Chris O’Malley and Rob Polson, Subject Librarians, for their assistance in accessing literature. Thanks to Elaine Mead, Chief Executive, NHS Highland, for enabling MB to participate on the Lean Leaders Course and to GH for his excellent Lean coaching.
References
Footnotes
Contributors MB, GH, MP, SC and HVW designed the RPIW. GH coached MP and MB through all stages of the RPIW. SC was the process owner responsible for implementation of the improvement. MB and MP conducted data collection, observations and analysis. HVW provided strategic direction and oversight for the RPIW. CH-R provided data advice and run charts. MB drafted the paper and all authors revised before agreeing the final version.
Funding This research received no specific grant from any funding agency in the public, commercial or not-for-profit sectors.
Competing interests None declared.
Provenance and peer review Not commissioned; externally peer reviewed.