Article Text

Abstract
Background The use of the WHO safe surgery checklist has been shown to reduce morbidity and mortality from surgical procedures. However, whether a WHO-style safe procedure checklist can improve safety in the cardiac catheterisation laboratory (CCL) has not previously been investigated.
Objectives The authors sought to design and implement a safe procedure checklist suitable for all CCL procedures, and to assess its impact over the course of 1 year.
Methods In the first 3 months, weekly PDSA cycles (Plan-Do-Study-Act) were used to optimise the design of the checklist through testing and staff feedback, and team briefing sessions were introduced before each procedure list. The impact of the checklist and team briefs was assessed by analysing in-house procedural data subsequently submitted to national audit databases. Staff and patient questionnaires were performed throughout the year.
Results Introduction of the checklist was associated with a significant reduction of 3 min in average turnaround time (95% CI 25 s to 6 min, p=0.027). Similarly, an initial reduction in patient radiation exposure was recorded (dose area product reduction of 641.5 cGy/cm2; 95% CI 255.9 to 1027.1, p=0.002). The rate of reported complications from all procedures fell significantly from 2.0% in 2012/2013 (95% CI 1.6% to 2.4%) to 0.8% in 2013/2014 (95% CI 0.6% to 1.1%, p≤0.001). Staff climate questionnaires showed that technicians and radiographers gave more positive responses at the end of the study period compared with the beginning (p=0.001).
Conclusions The use of a team brief and WHO-derived safe procedure checklist in the CCL was associated with decreased radiation exposure, fewer procedural complications, faster turnarounds and improved staff experience.
- checklists
This is an open access article distributed in accordance with the Creative Commons Attribution Non Commercial (CC BY-NC 4.0) license, which permits others to distribute, remix, adapt, build upon this work non-commercially, and license their derivative works on different terms, provided the original work is properly cited, appropriate credit is given, any changes made indicated, and the use is non-commercial. See: http://creativecommons.org/licenses/by-nc/4.0/.
Statistics from Altmetric.com
Problem
Few medical settings have seen such rapid growth in activity over the last two decades as the cardiac catheterisation laboratory (CCL). Currently in the UK, well over 100 000 percutaneous coronary intervention (PCI) procedures are performed annually, in contrast to only 10 000 at the turn of the millennium.1 Moreover, the nature of the procedures being undertaken has evolved substantially, with newer technologies such as cardiac resynchronisation therapy (CRT) devices2 and transcatheter aortic valve implantation (TAVI)3 becoming established. As a result, the volume—and complexity—of procedures being performed in CCLs has risen dramatically.
However, as the number of procedures undertaken in the CCL increases, so does the potential for error and patient harm. Complex environments such as CCLs—and operating theatres—are high-risk areas for patient safety incidents (PSIs),4 and complications during and after percutaneous procedures continue to represent a significant cause of morbidity and mortality.5 In comparison with surgical operating theatres, the use of specific safety measures in the CCL has been relatively understudied, and safety reporting metrics remain relatively limited.
Our own organisation is a tertiary referral centre for advanced cardiac care located in central London; we receive patients from all over the UK. We run five catheterisation laboratories each day, performing a broad variety of complex procedures. This requires input from a number of different nursing, technical and medical personnel, for example, cardiologists, anaesthetists, surgeons and paediatricians. However, prior to the instigation of this project, we had no standardised safety procedures. We noted the literature on surgical checklists and felt that a similar solution might apply to our catheterisation laboratories. Therefore, our aim at the outset was to develop and introduce a safe procedure checklist. Our goal was to achieve >75% uptake of the checklist over the course of the year and to observe the impact this had on procedural metrics and complications.
Background
In the setting of elective non-cardiac surgery, safe procedure checklists have been shown to prevent complications and errors both during the operation and in the perioperative period.6 In particular, the WHO Surgical Safety Checklist has been shown to prevent morbidity and mortality in a global study7 and in subsequent research.8 9 The WHO checklist is split into three distinct phases, incorporating a ‘Sign In’ check of essential pre-procedural details, a ‘Time Out’ performed immediately before the procedure and a ‘Sign Out’ after the procedure to optimise postoperative care. This tripartite format potentially lends itself well to other procedures such as those performed in the CCL. Most importantly, a checklist serves as a simple way to remind operators of actions which—if forgotten—could potentially be life threatening.
Although other analyses have been more circumspect about the potential benefits of checklists,10 whether a WHO-derived checklist can improve safety, efficiency and staff experience in the CCL has not previously been investigated.
Measurement
Data collection
All checklists were collected and analysed to allow weekly assessment of checklist use. Checklists were considered incomplete if one or more boxes in any area (Sign In, Time Out, Sign Out) had not been marked as done. Procedure times were recorded by cardiac technicians using the first needle-to-skin or knife-to-skin moment, to the time of final vascular access site/wound closure. Radiation exposure (screening time and dose area product) was recorded by the radiographer involved in the procedure immediately after case completion. To assess the impact of the checklist on other procedural metrics, data were obtained from local hospital databases that are compiled and submitted to national databases on an annual basis. Data on PCI procedure complications were obtained from the information submitted to the British Cardiac Intervention Society national database, information from which is publicly available online. Data on complications from electrophysiology (EP) procedures were recorded prospectively in a separate database submitted to the Central Cardiac Audit Database (CCAD), which is audited quarterly by Cardiac Rhythm Management (Healthcare Quality Improvement Partnership, UK). Complications from structural heart disease and paediatric interventions are also submitted to the CCAD for external audit by the Healthcare Quality Improvement Partnership. Adverse event reporting was performed using Datix online patient safety software (Datix, London, UK).
Patient experience was assessed by questionnaires taken at random time points throughout the course of the year (see online supplementary information for format of the questionnaire); a 10-point Likert scale was used. Staff attitudes towards safety were measured using a standardised safety climate survey tool, which has been adapted for use in the Royal Brompton since 2010 (see online supplementary information); this survey was administered at the beginning of the project, at 7 months and at 12 months, and used a 5-point Likert scale.
Supplemental material
Outcome measures
Outcomes were categorised into three main domains: procedural metrics, safety outcomes and staff/patient surveys. Metrics of procedural performance included average procedure time, turnaround time (the time between one case finishing and the following case starting, a measure of CCL efficiency), screening time and radiation exposure as measured by dose area product (DAP). Safety outcomes included the occurrence of any major complication during an interventional procedure, and the number and severity of adverse incident reports submitted via the Trust central reporting system. Major complications were defined as follows: cardiac arrest, ventricular fibrillation, coronary perforation, heart block requiring pacing, cardiac tamponade and vascular access complications requiring intervention. Lastly, changes in staff safety climate and patient questionnaires (see online supplementary information) administered over the course of the year were analysed.
Baseline data
We collected baseline safety data for the year 2012–2013, split into the three main categories of interventional procedures we perform. Over the 12-month period, 3.9% of EP (eg, pacemakers, ablation) procedures recorded complications, compared with 2.4% of percutaneous coronary intervention (angioplasty and stenting) procedures and 9.1% of paediatric procedures (eg, septal defect closures). Given the complicated nature of the procedures performed at our tertiary referral centre, these complication rates are difficult to benchmark. Nonetheless, it was felt they could be reduced by a more structured approach to patient safety in the CCL.
Design
We therefore prospectively assessed the impact of the introduction of a safe procedure checklist in the CCLs at the Royal Brompton Hospital between May 2013 and April 2014. The Royal Brompton and Harefield National Health Service (NHS) Foundation Trust is a national tertiary referral centre for the treatment of heart and lung disease, providing a range of elective and emergency interventions to adults and children from the UK and abroad. At the start of the project, the WHO safe surgery checklist was already in use in Trust operating theatres, but there were no standardised safety protocols in use in the CCLs.
The project was funded by a grant from the Health Foundation UK as part of their SHINE programme, which was initiated to provide healthcare teams with the resources needed to develop and evaluate innovative ideas to improve quality of care (http://www.health.org.uk/programmes/shine-2012). The funding obtained was used to hire a full-time, non-clinical project manager (JB) to assist with the day-to-day clinical implementation of the checklist (ACL, SD) under the guidance of the lead clinician for clinical risk (EH). The sponsor had no role in the project design, data collection, data analysis, data interpretation, or writing of the manuscript. This Quality Improvement project was approved as part of the Trust Quality Strategy. According to the policy activities that constitute research at the Royal Brompton and Harefield NHS Trust, this work met criteria for operational improvement activities exempt from ethics review.
At the outset of the project, our main concern was developing a checklist that would be appropriate for the procedures carried out in our laboratories (as opposed to the surgeries carried out in standard operating theatres). We also wanted to ensure our staff used the checklist from the outset. Therefore, JB worked closely with the study team and laboratory staff from the outset to ensure that our checklist was formed and implemented collectively, which we felt was the best way to ensure long-term buy-in.
Strategy
Our SMART (Specific, Measurable, Attainable, Relevant, Timely) goal was to improve patient safety in the CCLs of the Royal Brompton hospital by reducing complication rates by at least 25% from baseline over the course of a year. Our initial intervention was to start morning team briefs, which were run according to a standardised format by the main CCL operator for the day (see online supplementary information for format). These continued throughout the course of the project.
The checklist project was split into four 3-month PDSA cycles (Plan-Do-Study-Act) over the course of 1 year as described below:
PDSA cycle 1
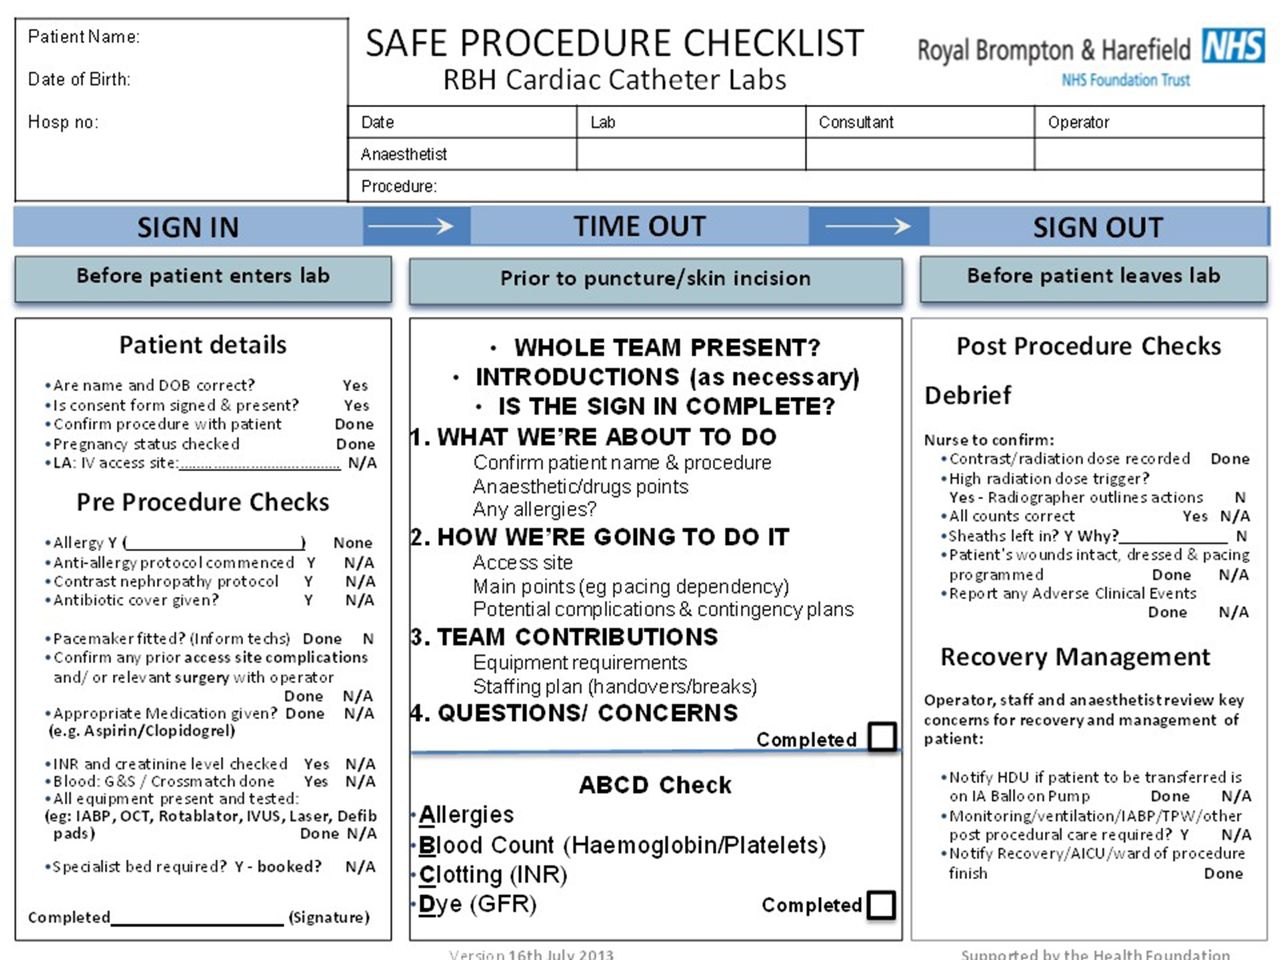
The main goal of the initial 3-month development phase was to develop a checklist that was suitable for use by all staff, across all procedures performed in our CCLs. The WHO safe surgery checklist was initially used as a template; however, early consultations with staff identified a need for several novel checkboxes, including those for antiplatelet drugs and impaired renal function (during ‘Sign In’, pre-procedural), and notification of high radiation and/or contrast doses (during ‘Sign Out’, postprocedural) (figure 1).

Final checklist used in the project.
During this initial stage of checklist implementation, one of the authors (JB) liaised with CCL staff on a weekly basis to gather feedback, ensure appropriate use of the checklist and to answer any questions on implementation. By the end of this introductory period, we recorded good uptake of the initiative; the checklist was found to have been used in 63.9% of cases performed over the 3-month PDSA cycle.
PDSA cycle 2
In order to further optimise the checklist and enhance its use, we introduced a final ‘ABCD’ (Allergies, Blood Count, Clotting, Dye) check to the ‘Time Out’ portion of the checklist (figure 1). This was in response to feedback from staff that there were four main things that they felt every staff member should be aware of prior immediately prior to starting a procedure. Despite this, an initial drop in checklist use—that coincided with the summer months—was seen (figure 2). At this stage, we presented our initial results at a monthly clinical governance meeting and began to post monthly checklist use data at various places in the CCL. As a result, by the end of the second PDSA cycle, checklist use had increased to 78.8% of cases.
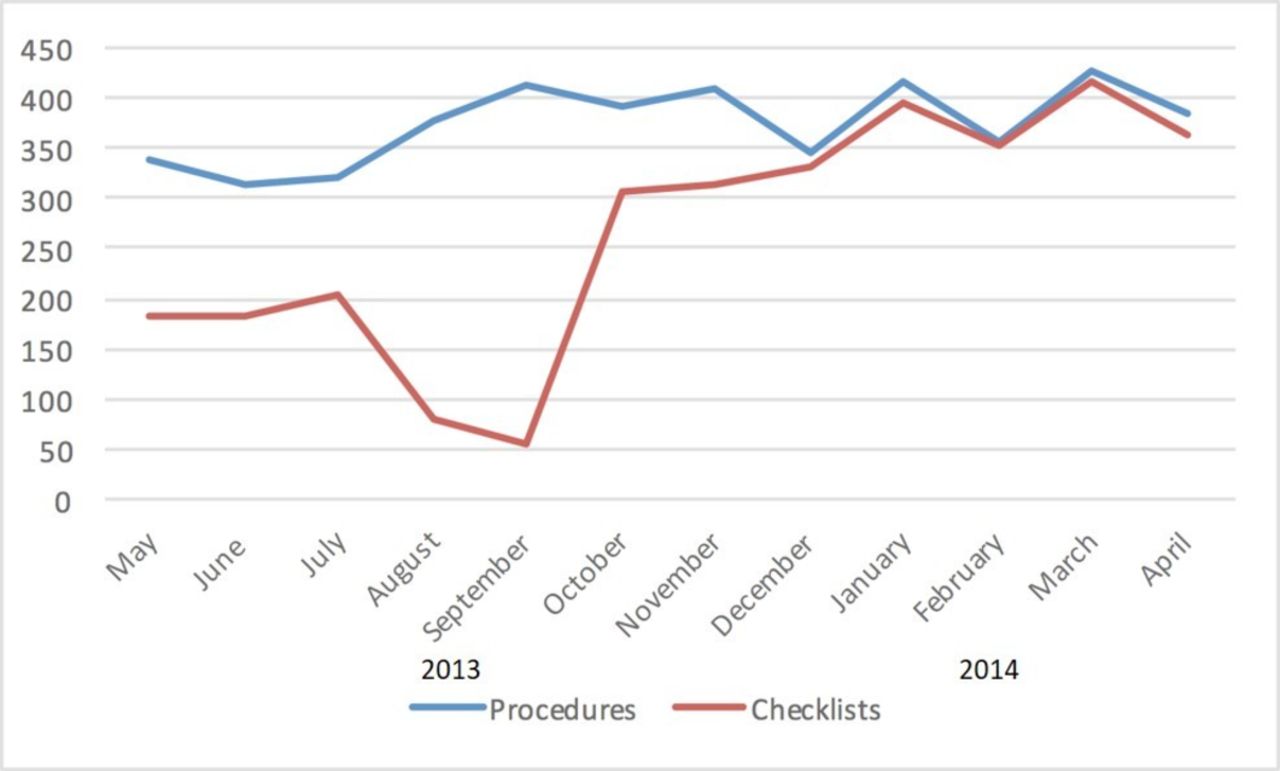
Checklist use and number of procedures performed each month over the study period.
PDSA cycle 3
Training at monthly clinical governance sessions continued, and subsequent to feedback at these meetings, some further, minor modifications to the checklist format were made. For example, the ‘Sign In’ column was divided into ‘Patient details’ and ‘Pre Procedure Checks’ sections for further clarity. By the end of this stage, checklist use had increased to 95.1% of all cases.
PDSA cycle 4
During this period, staff received ongoing training on the checklist at monthly clinical governance meetings. During this final stage of the project, checklist use remained high (>94%; see the Results section below) and no further alterations in the checklist format were necessary.
Results
Checklist development and use
The final checklist is shown in figure 1. During the period May 2013–April 2014, the total number of CCL procedures performed was 4489, compared with 4502 the previous year (May 2012–April 2013). Over the course of the year, 3184/4489 completed checklists were returned (70.9%). At the end of 3 months (July 2013), checklist use (either complete or incomplete) was 63.9% of cases, after 6 months 78.8% of cases, after 9 months 95.1% and after 12 months 94.8% (figure 2).
Procedural metrics
The average monthly procedural time over the year the checklist was used was 85.8 min (95% CI 83.4 to 88.4 min). There was no significant change in procedure times over the course of the project period.
During 2012/2013, turnaround times were constant at an average of 29 min (IQR 27 to 30). Average turnaround time in 2013/2014 was significantly lower at 21 min (IQR 20 to 23, p=0.0001). At the introduction of the checklist, there was a significant step reduction of 3 min in average turnaround time (95% CI 25 s to 6 min, p=0.027). During 2013/2014, turnaround times continued to fall by an average of 34 s per month (95% CI 13 to 55, p=0.003, figure 3).
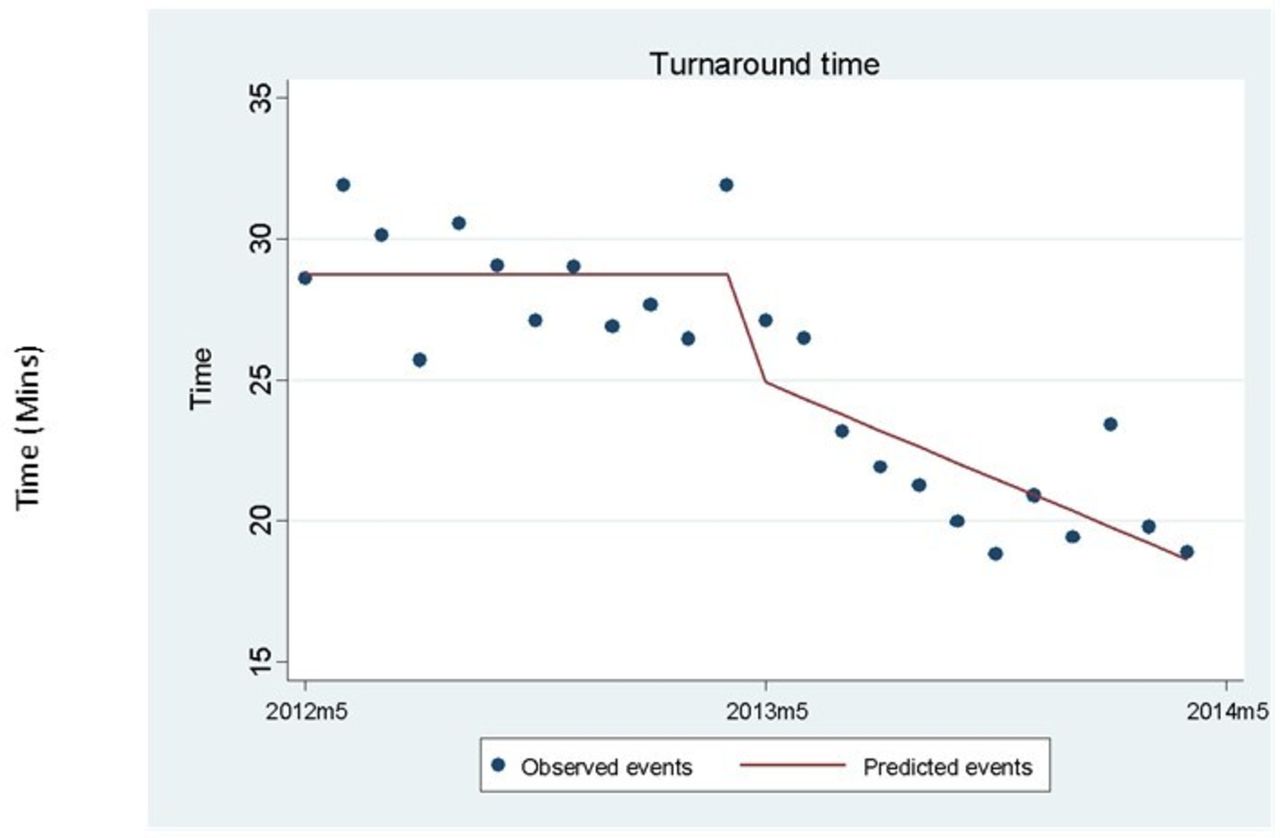
Turnaround times (the time between a case finishing and the subsequent case starting) were constant in the first year. The introduction of checklists (arrow) was associated with a reduction of 3 min 16 s (95% CI 24 s to 6 min 9 s, p=0.027). Turnaround time began to decrease by 34 s (95% CI 13 to 55, p=0.003) per month following the introduction of checklists.
Compared to 2012/2013, average monthly procedure screening (X-ray exposure) times during 2013/2014 decreased from 13.13 (IQR 5.11–20.07) min to 5.32 (IQR 3.78–8.42) min, but this did not reach statistical significance (p=0.106). In contrast, monthly DAP readings showed a statistically significant decrease from a mean of 2433 cGy/cm2 (95% CI 2318 to 2548) in 2012/2013 to 2165 cGy/cm2 (95% CI 1917 to 2412) in 2013–2014 (p=0.042) (figure 4). During 2012/2013, DAP readings were constant, but the introduction of the checklist was associated with a significant step reduction of 641.5 cGy/cm2 (95% CI 255 to 1027, p=0.002). Of note, over the remainder of the project period, average readings gradually returned to the same level as before the introduction of the checklist (an average increase of 57 cGy/cm2 per month (95% CI 10 to 105, p=0.020, figure 4).
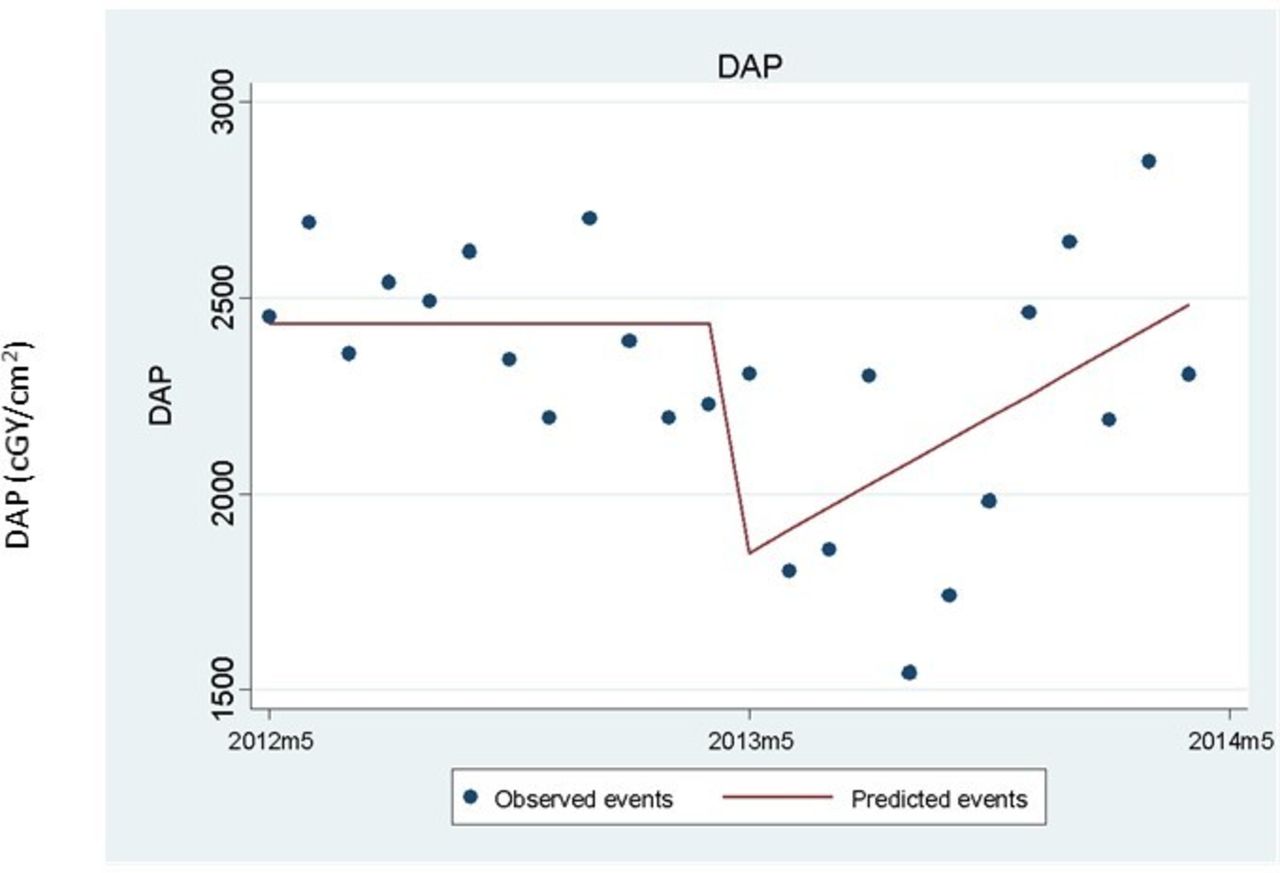
Patient radiation exposure prior to and during checklist use. Dose area product (DAP, cGy/cm2) values were constant during the first year. The introduction of checklists (arrow) was associated with a step change in DAP (reduction of 641.5; 95% CI 255.9 to 1027.1, p=0.002). DAP began to increase again following the step change and by the end of the second year had returned to pre-checklist levels.
Safety outcomes
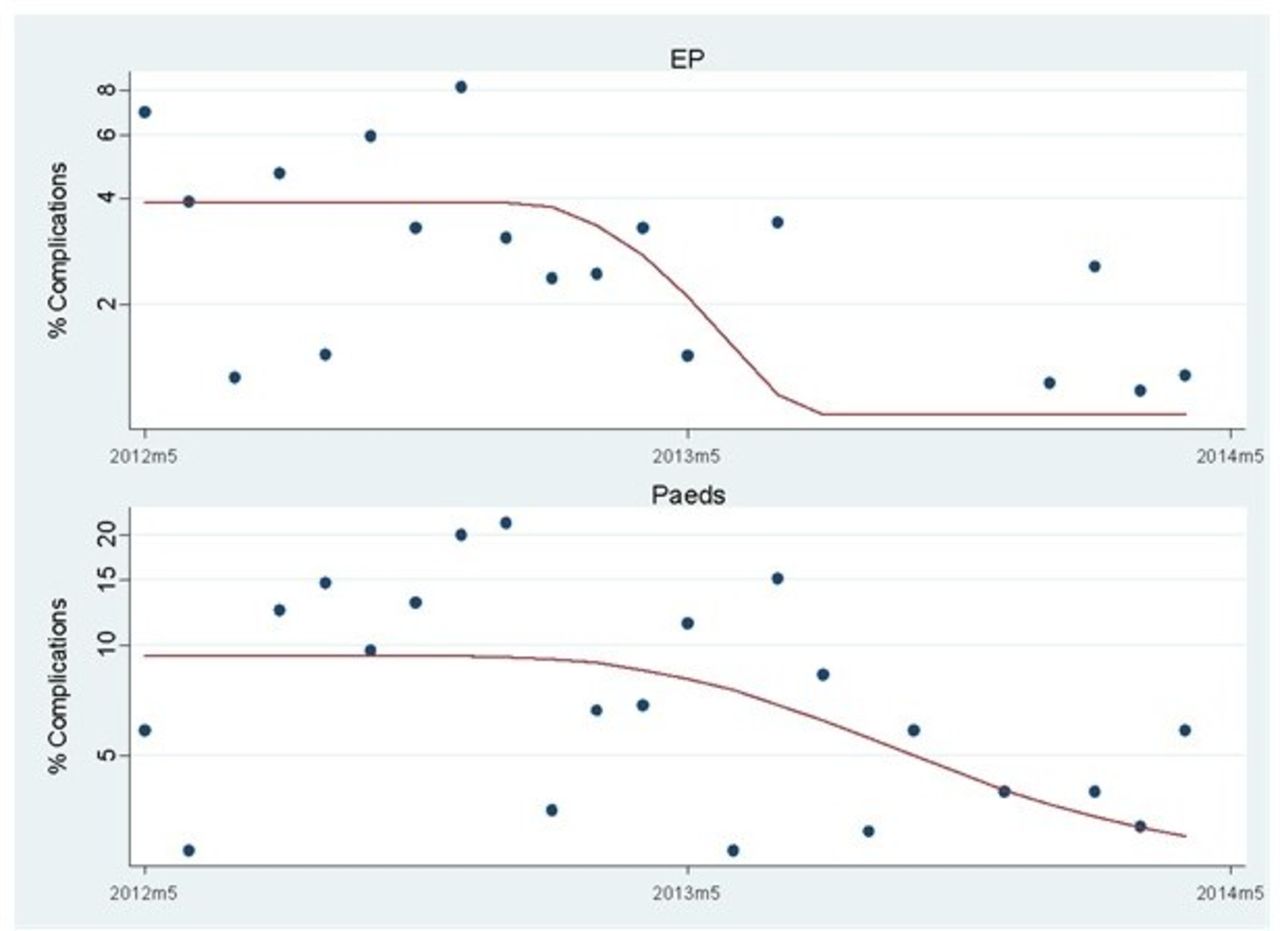
The rate of reported complications from all procedures (diagnostic and interventional) was significantly higher in 2012/2013 (88/4502; 2.0%; 95% CI 1.6% to 2.4%) compared with 2013/2014 (37/4489; 0.8%; 95% CI 0.6% to 1.1%, p≤0.001). Of note, there was a step reduction of 74.6% (95% CI 49.1% to 87.3%, p<0.001) in EP complications when checklists were introduced (figure 5). For paediatric procedures, there was no step change in paediatric complication rates at the introduction of the checklist; however, complication rates began to fall by an average 10.2% per month in 2013/2014 (95% CI 2.3% to 17.5%, p=0.012, figure 5). Although PCI complication rates were lower in 2013/2014 compared with the previous year (17/710 (2.4%) compared with 7/789 (0.9%), p=0.002), there was no step change or change in trend at the introduction of checklists.
Complication rates prior to and during checklist use. Dots, observed rates; line, model estimate. Significant reductions in both electrophysiology (EP) (top, p<0.001) and paediatric procedures (bottom, p=0.012) were noted following the introduction of the checklist (arrow).
The mortality rate of all patients undergoing CCL procedures in 2013/2014 was lower than in 2012/2013 (1.0%, 95% CI 0.7% to 1.3% vs 1.2%, 95% CI 0.5% to 1.0%), but this did not reach statistical significance.
Incident reporting
Table 1 shows PSI reporting forms submitted during the project year and the preceding year. Overall, there was a decrease in the number of incidents reported: 1.62% (95% CI 0.89% to 1.54%) of all procedures in 2012/2013 versus 1.18% (95% CI 1.27% to 2.03%) in 2013/2014 (p=0.075). No statistically significant difference was seen in the severity of incidents reported (p=0.866), although there were fewer incidents reported in each of the three most severe categories (red 2 vs 0; amber 7 vs 2; yellow 23 vs 10) during the year of checklist use. Examples of when potential adverse incidents were avoided by the checklist are shown in box 1.
Patient safety incident form submissions (fewer red, amber and yellow forms were submitted in the year following checklist introduction; p=0.075)
Examples of potential incidents prevented by the checklist process
At the Time Out, the operator mentioned the electrical cauterising knife he planned to use. The physiologist then alerted him that the patient had a hip replacement. The return electrode was repositioned on the opposite side of the body from the hip replacement.
The patient had a recent pacemaker, which had gone unnoticed. The physiologist saw the scar and informed the team at the Time Out, causing the operator to change the right heart catheterisation plan.
During the Time Out, the operator stated that he was not aware of any allergies, but was informed by the anaesthetist that the patient had two. The medication plan was amended to account for this.
Staff surveys
Over the course of the year following the introduction of the checklist, staff were surveyed three times (for specific questions, please see online supplementary information). There was an increase in the proportion of positive responses (a score of at least 4/5) from technicians/radiographers comparing the first and third surveys (78% vs 88%, p=0.001). For nurses, there was no difference in the proportion of positive responses (70.1% positive responses in both first and third surveys). However, fewer nurses reported that they observed errors which could delay procedures and increase the risk to patient safety in the third compared with first survey (70% vs 30%).
Patient surveys
The overall results of the patient questionnaires are shown in table 2. Over the course of the project, 90 patients completed surveys. Overall, feelings of safety were high, with 83 (92%) rating their feeling of safety at least 8/10.
Patient questionnaire results (values are proportion scoring (at least 8/10 or % yes))
Moreover, 54/90 (60%) of patients surveyed noticed the ‘Time Out’ portion of the checklist during their procedure, and overall this was associated with a strong feeling of safety (all but one scored at least 8/10 for feeling safer having noticed the ‘Time Out’). Overall, 41/90 (46%) of patients surveyed noticed staff following the checklist at any stage (‘Sign In’, ‘Time Out’ or ‘Sign Out’), and again this was associated with a strong feeling of safety (all but two scored at least 8/10). Conversely, those patients who did not notice staff following the checklist reported a high level of reassurance by the knowledge that a checklist was used (44/48 scored at least 8/10). Only 6/90 patients were aware of any problems with their procedure; all six were in the first half of the surveys.
Lessons and limitations
We report here on the impact of the introduction of a daily team brief and modified WHO safe procedure checklist for interventions taking place in the CCL at a tertiary cardiac centre. By engaging and working with all CCL staff, a checklist was designed and implemented that, when compared with the previous year’s procedures, led to faster turnaround between cases, a reduction in radiation exposure, fewer overall procedural complications and a trend towards fewer adverse incident reports. As a result, high levels of patient and staff satisfaction were seen.
While research into patient safety and teamwork in the surgical operating theatres has been developing for some years,10–12 and checklists have been employed in other areas of clinical cardiology,13 14 comparatively little work has taken place in the CCL. Cale and Constantino performed a literature search to examine the risk factors for, and strategies to prevent, complications in the CCL, but the authors noted ‘a lack of quality research on this subject’.15 Furthermore, the writing committee of a recent ‘Best Practice in the Cardiac Catheterisation Laboratory’ document published by the American Society for Cardiovascular Angiography and Interventions acknowledged ‘a dearth of high-quality published studies’ and recommended further research into quality improvement in the CCL.16 A previous study by Gordon et al looked at the impact of a checklist in patients who were undergoing procedures for structural heart disease, but this was partly retrospective, involved far fewer patients and did not use the WHO checklist design.17
The design of a checklist for the CCL must account for the fact that there are a number of differences between procedures performed in the CCL and in theatres. First, in the CCL, the volume of procedures tends to be higher, with emergency or emergent procedures comprising the majority of the workload—especially in hospitals performing primary angioplasty. This is significant as emergency surgical procedures have been associated with more complications that elective operations,18 and primary angioplasty is more prone to complications than elective cases. Second, the majority of patients who undergo procedures in the CCL do so under local anaesthesia, and are therefore awake and able to observe the functioning of the CCL team. Thirdly, the CCL is the setting for multiple professional groups working simultaneously; for example, a TAVI procedure may require the presence of cardiologists, surgeons, anaesthetists, theatre nurses, perfusionists, radiographers and cardiac technicians.19 Given these important differences, it appears logical to amend the existing WHO safe procedure checklist for use in the CCL. This is also in keeping with the WHO recommendation that the safe procedure checklist be adapted to local needs.
In conjunction with our staff, we adapted the WHO safe surgery checklist over a period of several months while simultaneously introducing team briefings. Later in the year, we noticed a marked downturn in checklist use over the summer months. Regular staff liaison, re-education and training were required to ensure the checklist was used in a total of 70.9% of cases by the end of the year. A number of improvements were subsequently recorded at the end of the project.
First, we noted a reduction in turnaround times between cases, suggesting that time spent performing the checklist may easily be recouped in between procedures. In this regard, the ‘Sign Out’ portion of the checklist is vital in ensuring patients have a definitive postprocedural care plan in place that allows them to be moved out of the CCL quickly but safely at the end of the intervention.
Second, we noticed a reduction in radiation exposure (as measured by DAP), the cause of which is likely to be multifactorial. For example, team briefs and checklist procedures should facilitate better communication, and thus procedure preparation and planning. In addition, lower complication rates (see below) would also reduce the need for extended radiation exposure. However, it should be noted that by the end of the study period, average procedural DAP levels had returned to normal. Further research is needed to determine whether this represents a limitation of our approach to checklist development and implementation, or whether it simply reflects the complicated nature of the procedures done in our tertiary referral centre.
Thirdly, we noticed fewer major procedural complications compared with the previous year, and fewer adverse incidents were also reported (although this did not reach statistical significance). A number of factors could contribute to this, including the introduction of the team brief, a more regimented ‘Sign In’ than previously used, the ‘Time Out’ prior to each procedure and an overall improvement in communication between CCL staff. Of note, in surgical operating theatres, a relationship has been found between communication errors and adverse events {Catchpole:2008it}, and both checklists20 and team briefings have been shown to improve communication in theatres.21
Lastly, our CCL safety climate questionnaire showed that our staff felt the CCL was a safer environment as a result of checklist use. Recent research has highlighted that the methods whereby a checklist is developed and introduced may influence its effectiveness,22 and in this regard we believe that our decision to assign a specific member of the study team (JB) to gain staff feedback on checklist design and use was crucial. Of note, we specifically chose to involve all our laboratory staff in the development process and to involve them all in a pilot phase prior to full launch. Subsequently, nursing staff noticed fewer errors that were likely to lead to patient harm, and an increase in positive responses from cardiac technicians and radiographers was recorded. Patients also reported feeling safer when they noticed the checklist being used. Together, these data suggest a general enhancement of CCL safety culture over the course of the year and show how a checklist and team brief might enhance team performance and lead to improved patient experience.
Limitations
This study was funded, and a dedicated member of staff was hired to be permanently available for staff training and education, and also performed instream analysis of data. Nonetheless, we feel that our experience—and the beneficial outcomes described—are obtainable in any cardiac centre, whether or not a dedicated member of staff is available. The implementation of morning safety-briefings and a procedural checklist appeared to catalyse a change in our safety culture that became self-perpetuating after the checklist format had been finalised.
The Hawthorne effect is a possible limitation of our efficiency and safety measures, in that staff were aware that checklists were being collected. However, it is unlikely that this contributed directly to the reductions in radiation exposure, complications and turnaround times, as staff were not aware of exactly which outcome metrics were being measured.
Finally, although several PDSA cycles were used to refine our checklist, it still contains a large number of items to be checked. A checklist with fewer items would be more in keeping with the existing WHO surgical checklist.
Conclusion
We have successfully designed and implemented a modified WHO safe procedural checklist for use in the CCL. The checklist was introduced along with morning team briefs and was associated with a reduction in patient radiation exposure, improved patient turnaround times, fewer procedural complications and an improvement in patient and staff experience. Overall, the use of team briefings and safe procedural checklists in the CCL appeared to be markedly beneficial for the patients and staff of our institution, and by the end of the year, checklist use remained consistently high. Based on these observations, further investigation of catheter laboratory checklists in multicentre trials appears warranted. Such trials should concentrate on checklist design and also on optimal methods of introduction and staff engagement.
References
Footnotes
Contributors ACL, JB, SD and EH designed the checklist. ACL and JB were responsible for data collection. All authors contributed to data analysis and manuscript writing and review.
Funding This study was funded by Health Foundation UK, SHINE Award 2012.
Disclaimer The sponsor had no role in the project design, data collection, data analysis, data interpretation or writing of the manuscript.
Competing interests None declared.
Provenance and peer review Not commissioned; externally peer reviewed.