Article Text

Abstract
Inadequate medication dispensing and management by healthcare providers can contribute to poor outcomes among HIV-positive patients. Gaps in medication availability, often associated with pharmacy workforce shortages, are an important barrier to retention in HIV care in Uganda. An intervention to address pharmacy staffing constraints through strengthening pharmaceutical management, dispensing practices, and general competencies of facility clinical and pharmacy staff was implemented in 14 facilities in three districts in eastern Uganda. Teams of staff were organised in each facility and supported to apply quality improvement (QI) methods to address deficits in availability and rational use of HIV drugs. To evaluate the intervention, baseline and end line data were collected 24 months apart. Dispensing practices, clinical wellness and adherence to antiretrovirals improved by 45%, 28% and 20% from baseline to end line, respectively. All clients at end line received the medications prescribed, and medications were correctly, completely and legibly labelled more often. Clients better understood when, how much and for how long they were supposed to take their prescribed medicines at end line. Pharmaceutical management practices also improved from baseline in most categories by statistically significant margins. Facilities significantly improved on correctly recording stock information about antiretroviral drugs (53%vs100%, P<0.0001). Coinciding with existing staff taking on pharmaceutical roles, facilities improved management of unwanted and expired drugs, notably by optimising use of existing health workers and making pharmaceutical management processes more efficient. Implementation of this improvement intervention in the 14 facilities appeared to have a positive impact on client outcomes, pharmacy department management and providers’ self-reported knowledge of QI methods. These results were achieved at a cost of about US$5.50 per client receiving HIV services at participating facilities.
- quality improvement
- healthcare quality improvement
- pharmacists
This is an Open Access article distributed in accordance with the Creative Commons Attribution Non Commercial (CC BY-NC 4.0) license, which permits others to distribute, remix, adapt, build upon this work non-commercially, and license their derivative works on different terms, provided the original work is properly cited and the use is non-commercial. See: http://creativecommons.org/licenses/by-nc/4.0/
Statistics from Altmetric.com
Introduction
Inadequate medication dispensing and management are critical yet often underappreciated drivers of poor outcomes among HIV-positive patients.1 2 In Uganda, the percentage of antiretroviral therapy (ART) naïve clients is reported to be higher compared with sub-Saharan Africa (12.3% vs 5.6%), indicating many more Ugandans with HIV should be on ART but are currently not.3 Drivers of HIV drug resistance in Uganda include intermittent drug supply, poor client monitoring, incorrect prescribing practices and poor ART adherence.4
In 2004, the Ugandan Ministry of Health (MoH) began rapid roll-out of ART to all eligible HIV-positive clients which sharply increased the number enrolled in ongoing care from 105 000 in late 2008 to over 290 000 in early 2011.5 6 The increase in clients in care put substantial pressure on the health system to deliver consistently high quality services. While MoH, with support from development partners, has led several initiatives since 2004 to improve the supply chain and use of medicines as part of improvement activities targeted at clinical HIV services, there has been limited attention paid to strengthening the performance of pharmaceutical human resources and organisational processes to assure medication availability, correct dispensing and appropriate use. It was reported in 2014 that Uganda had 700 pharmacists for the 35 million population, significantly less than the 1 pharmacist per 10 000 recommended by WHO, and limited capacity to train new pharmacists to bridge the gap in the near future.7 Considering this, it is essential to improve the efficiency and competence of other health worker cadres in performing pharmacy tasks for HIV.
To address pharmacy human resources constraints impacting HIV drug management and dispensing, in April 2012, the Ugandan MoH started a collaborative improvement project in three districts of eastern Uganda (Jinja, Tororo and Bukedea). The objective of the intervention was to use improvement approaches to address gaps in pharmacy workforce performance that potentially compromise HIV client outcomes by affecting adherence to antiretroviral (ARV) medications and to help build evidence for how optimising the existing workforce can lead to service delivery efficiency gains and better HIV outcomes. This was in line with MoH’s 2011 National Quality Improvement Framework which called for application of improvement approaches to clinical and non-clinical health system processes. Technical support was provided by the USAID Health Care Improvement Project (HCI), the USAID-SURE Project, and the PEPFAR-supported USAID Applying Science to Strengthen and Improve Systems (ASSIST) Project. Previous work conducted by the HCI and ASSIST projects found that significant improvements in service delivery can be attained alongside improvements in human resources management and health worker engagement when factors affecting performance are addressed.8 9 Such an approach enables clinical and non-clinical health workers at all levels of the system to innovate and test practical ways that better use existing resources to improve HIV care delivery. This includes improving continuity of care between facilities and the community, facilitating self-care in the community, improving medicine availability and use, and optimising clinical outcomes.
Methods
Design
We conducted preintervention and postintervention evaluations, with no control group comparison, between March 2012 and August 2014. These included measures to determine the intervention’s effectiveness and efficiency improving the proportion of clients: (1) collecting their medicines as scheduled, (2) achieving good clinical improvements and (3) demonstrating good adherence to ART. In addition, pretest and post-test measurements were conducted of pharmaceutical management and dispensing practices and health worker knowledge of quality improvement (QI).
Study sample
Three districts were chosen because they were already implementing QI work. Fourteen health facilities providing both HIV/ART services and tuberculosis (TB) treatment in the three districts were purposively chosen for the intervention and the subsequent evaluation. These sites were selected because they were accredited to provide ART services and represented different facility levels within the districts They were identified as the highest volume ART centres in the three districts so the quality of their services impacted the clinical outcomes of many clients. Health facilities included three hospitals, eight health centre IVs and three health centre IIIs. After hospitals, health centre IVs are the largest facilities in Uganda. They typically have about 15 beds, an operating theatre mainly for emergency obstetric care, and serve a population of about 100 000 people. Health centre IIIs offer mainly inpatient services for maternity health and serve about 20 000–50 000 people.
Data collection
Data were collected through interviews, extraction of individual medical records, facility registers and workflow assessment observations.
Trained data collectors conducted interviews with all staff at participating facilities involved in medicine management using a standard questionnaire to assess competency in using QI methods to identify and address gaps in pharmacy services. Competencies included explaining basic concepts of improvement such as testing changes to improve performance, using appropriate tools to analyse the site-level situation, setting site-level improvement aims, developing change ideas, implementing action plans to test process changes, reviewing effects of the implementation and using data to determine the next steps.
Interviews were also conducted with all clients present on the day of data collection to assess their understanding of dispensing instructions. Record extraction sheets were used to retrospectively and independently collect data on medicine stock-out periods, adherence, appointment-keeping and clinical wellness from records and changes tested by teams as documented in the coaching logs.
Cost data were extracted from the project’s accounting documentation. Estimates of time spent by improvement team members and other staff were collected directly from staff.
No client identifier information was collected throughout the activity. A pilot test was conducted for all data collection tools prior to using them and amendments made accordingly. Piloting was done in two facilities outside the intervention area. Data collectors were trained on the tool before they started the collection process and spot checks were conducted to confirm accuracy of data entry.
Cost data were collected using the activity-based methods from the accounting records of the implementing partner for the USAID ASSIST Project, University Research (Uganda).
Technical information
In this study, we sought to address the following questions:
What QI competencies were acquired by health workers participating in the intervention to improve HIV and TB medicine management?
What changes were seen in participating facilities in terms of medicines’ availability, pharmacy roles undertaken by different staff cadres, availability of standard operating procedures (SOPs) for pharmacy management, timeliness of ordering ARV medications, stock management, labelling and dispensing, and adherence, retention and clinical wellness of clients on ART?
What factors enable improvement methods to be used beyond the period of outside technical assistance?
What was the cost-effectiveness of the QI activities in terms of expenditure per additional client attending appointments, experiencing good clinical wellness and remaining adherent to ART?
Data were collected on the following variables:
Proportion of health workers who score ‘High’ on a QI competency self-assessment tool at baseline and end line.
Proportion of health facilities that order drugs in a timely manner (facility’s most recent ARV order has date recorded within the last 45 days).
Proportion of clients being dispensed the correct drug that was properly labelled and included appropriate counselling.
Proportion of HIV-positive clients with at least 95% adherence to the ARV medications each month.
Proportion of HIV-positive clients collecting their medicines as scheduled.
Proportion of HIV-positive clients receiving ARVs who demonstrate clinical improvement.
Time and expenses required by the project, district and health facility staff on efforts related to the improvement intervention (ie, coaching, improvement team meetings, training, learning sessions).
In addition to the baseline and end line evaluations, monthly improvement indicator data were abstracted by improvement team members in each facility from client registers and recorded in QI documentation journals to objectively measure the impact of the changes tested. Each month, the improvement team recorded indicator data in journals and the USAID ASSIST Project coach visiting the facility recorded the QI team’s data electronically into the project database after checking data validity against a sample of three to five client records.
Analysis
We used Pearson’s χ2 test for proportions comparing baseline and end line compliance with improvement indicators. We then input these into the cost-effectiveness single-iteration decision tree using the actual proportions found in the evaluation for probability inputs.
Intervention
The intervention began with a design meeting in April 2012 in which representatives from the three districts (including leaders from the targeted facilities) and the MoH Quality Assurance Division and Pharmaceutical Division and Makerere University Faculty of Pharmacy were invited to attend. In the meeting, results from a rapid situational analysis conducted by the HCI Project in March 2012 in 12 facilities were presented. It identified gaps such as stock-outs of HIV testing kits and HIV care medicines, 40% of clients not being able to explain how to take their medicines on leaving the pharmacy window, delays in ordering, ordering not based on actual needs, lack of communication between clinical and pharmacy staff, and lack of adherence to dispensing standards. The analysis also found that pharmacy roles were mostly performed by non-pharmacy cadres, and only 1 of the 12 facilities surveyed had a pharmacist. Nurses performed pharmacy roles such as stores management, forecasting supplies, dispensing medicines, providing medicines information and advice to clients in most health facilities.
Meeting participants identified and prioritised the following areas for improvement because they were noted by most participants as deficits that needed addressing:
Reducing stock-outs and improving availability of adequate stocks of HIV care medicines.
Communication and information sharing between clinic teams in the HIV clinics with the pharmacy teams, to ensure accuracy in drug requisitions and rational use of available medicines.
Workflow problems and staff scheduling difficulties.
Dispensing practices, so clients have adequate and accurate information on the medicine they have been dispensed, how to take it and for what length of time.
Competencies in QI approaches for all health workers and their application in non-clinical areas for improved performance.
In line with Uganda’s National QI Framework and Strategic Plan from 2011, roles and responsibilities of national-level, district-level and health facility-level stakeholders were also agreed on. The national level was given responsibility for developing and disseminating QI policies, developing national budgets and coaching. Districts were responsible for coordination of QI activities within the districts, on-site coaching, supporting use of data and planning and budgeting for district QI activities. Health facility representatives were responsible for QI team formation and testing changes.
From 2012 to 2014, health facility staff were supported to use a continuous QI approach to identify staff competency and workload gaps related to management and use of medicines for HIV and then develop local solutions to overcome them. Eleven of the 14 facilities had previously participated in improvement activities targeting other aspects of clinical care, though this was implemented by district-level staff, not directly by health workers at the facility level. The 14 facilities were randomly assigned into four groups. This improvement activity was inserted into existing QI structures at the district level—existing QI coaches and district QI committees supported to the 14 sites and no new QI teams were formed in health units where they already existed. Improvement activities at the facility level were initiated in a phased manner over the period May–August 2012, with three to four facilities oriented to improvement methods and the plan-do-study-act approach to testing changes to address gaps they identified in their own facility, each month. The improvement team in each facility collected data monthly on key indicators of quality of pharmacy services, identified deficits in those services, developed and implemented changes in facility functioning to address problems, and assessed whether those changes led to the desired improvements.
Participating health facilities were supported through on-site coaching visits from the project, MoH, regional-level and district-level staff to test changes to improve availability and rational use of HIV medicines resulting in better client adherence to treatment, retention in care and clinical improvement. They were also supported to address any factors that affect individual health worker performance, such as lack of clear roles and responsibilities and were also supported to improve their competencies in improvement methods. For example, through process mapping (a sequential process of understanding all steps in an activity and how they link with each other), it was determined that staff with the responsibilities of dispensing were assigned many duties and had little time to explain to clients how to take their medications, which resulted in poor adherence and therefore poor health outcomes. The team agreed to allocate more time to ensure the dispenser spent at least 1 min explaining to clients how to take their medications. The extra time was created by taking away other tasks the dispenser had. This included prepackaging commonly dispensed medications such as cotrimoxazole, paracetamol, amoxicillin and some ARVs a day before the clinic day. Tasks to be performed by the dispenser were clearly written and shared with all dispensers in a meeting to facilitate a common understanding to job tasks.
The first learning session for the collaborative improvement intervention was held in August 2012 as a district-level sharing session where representatives of improvement teams from each of the 14 participating health facilities met at their respective district health office with the district health officer and HCI staff. In each of the three sessions, facility teams shared their progress in this new area of application of improvement in pharmacy practice, comparing their experiences on changes implemented and results observed. The meetings also served as an opportunity for the MoH and district staff to take stock of what the facilities had achieved and determine next steps. In all, 83 health workers (all members of the facility-level QI teams and including clinical officers, nursing assistants, registered nurses, midwives, pharmacy technicians, store managers, counsellors and expert clients) attended these sharing sessions: 25 in Jinja, 30 in Tororo and 28 in Bukedea. Through facility presentations, participants highlighted the initial gaps in medicines’ management and client outcomes and shared changes they had tested so far to improve ordering, storage and dispensing of medicines. They also shared changes to address gaps in clients’ adherence to treatment and to scheduled clinical appointments and clients’ clinical improvement. All 14 sites developed action plans for the subsequent 3 months. While coaching visits to facilities did not resume until April 2013, facility-level teams continued to test changes.
A second learning session was convened by ASSIST in March 2014 in Mbale district, a neighbouring district which is equally accessible by all three of the intervention districts. The 72 participants included representatives from all 14 health facilities, the 3 district health offices, and MoH headquarters and regional coaches. Some district health officers attended in person.
Sites presented on the quality gaps they had and the changes they made to deal with those gaps. The discussions highlighted ideas for areas where facilities were still having challenges and strategies to sustain good performance. All changes tested by the 14 teams were compiled into a single document which was shared with all teams for future reference (table 1).
Gaps and changes tested to improve medicines’ availability and use
Results and discussion
Client-based clinical outcome indicators
After implementation of the changes, significant improvements were observed in the percentage of clients demonstrating good clinical wellness (maintaining stable body weight, having no new opportunistic infections and exhibiting good functional status) and percentage of clients with good adherence (determined by pill count). Greater improvements were seen on these indicators in health centres, which started at lower levels compared with hospitals. Tables 2 and 3 below compare facilities for which baseline and end line data were available. Three health centres did not have baseline data on clinical wellness or adherence. While their baseline performance is unknown and therefore not included in tables 2 and 3, the three health centres achieved end line performance well above the baseline performance of the other health centres. Facilities that lacked baseline and data were excluded from the analysis represented in tables 2 and 3. At end line, 87% (1666/1924 clients) of clients demonstrated good clinical wellness and 85% (1625/1911) demonstrated good adherence in these three facilities. In the one hospital that lacked baseline data for adherence, 96% (433/451) of clients demonstrated good adherence at end line.
Percentage of clients demonstrating good clinical wellness (11 facilities)
Percentage of clients with at least 95% adherence to antiretroviral (ARV) medications each month (10 facilities)
There was no improvement observed in appointment-keeping, which was measured as the percentage of clients collecting their medicines as scheduled (table 4). However, at baseline the proportion collecting their medications was higher than other indicators. This measure may have been overestimated in that period or it could be that patients may be good at collecting medications while being simultaneously poor at adhering to their medication regimen. Appointment-keeping indicators are often difficult for facilities to measure accurately for several reasons, including national policies that define a client who comes within 7 days of their scheduled appointment as having kept the appointment, clients who come well before their scheduled appointments, and clients who have multiple appointments within the same month.
Percentage of clients collecting their medicines as scheduled (eight facilities)
Five health centres and one hospital did not have baseline data on the percentage of clients collecting their medicines as scheduled, and are excluded from table 4. While their baseline performance is unknown, the five health centres achieved end line performance of 97% (6039/6225) of clients collecting their medicines as scheduled and at the hospital 83% (3625/4376) of clients collected their medicines as scheduled.
Pharmaceutical management and dispensing practices
Dispensing practices mostly improved from baseline to end line (table 5). There were 2 facilities added to the 12 included in the initial rapid assessment, which were then included in the analysis. All clients at end line received the medications they were prescribed, and medications were correctly, completely and legibly labelled more often at end line. Clients better understood how, when, how much, and for how long they were supposed to take their prescribed medicines at end line, but there was no increase in their ability to answer why they were getting the prescribed medicine. There was no clear explanation for the latter finding but the information was used to stimulate improvement in communication of information on the reason for medications among health workers.
Dispensing practices (14 facilities)
Likewise, pharmaceutical management practices improved from baseline (table 6). More facilities have SOPs in place and specific responsibilities assigned. Facilities also significantly improved on timely ordering of drugs and correctly recording stock information about essential ARVs.
Pharmaceutical management practices (n=14 facilities)
Because of the scarcity of pharmacists and pharmacy assistants in Uganda, the project encouraged other cadres of staff to undertake pharmaceutical roles within their facilities. Involvement in pharmacy roles increased among all cadres. As presented in table 7, the biggest changes across all cadres was in completing pharmacy documentation, forecasting medicine requirements, and providing medicine information and advice. Smaller changes were seen in increasing shared responsibilities for stores management and dispensing. Among cadres, the largest increases in responsibilities for pharmacy roles were among nurses, clinical officers, midwives and medical doctors. The shortage of pharmacists and pharmacy assistants remained from baseline to end line, when only two of the four facilities that were supposed to have a pharmacist on staff had one. Four facilities had no position for a pharmacy assistant. All 10 facilities with pharmacy assistant positions had at least one pharmacy assistant.
Change in the percentage of facilities in which different medical cadres undertook pharmacy roles from baseline (n=11) to end line (n=14) (March 2012–August 2014)
Coinciding with an increase in staff taking on pharmacy roles, the facilities made improvements in managing unwanted and expired drugs. Systems for storage of unwanted and expired drugs, redistribution of unwanted drugs through the district health office, and registry and shipment of expired drugs through the district health office to the National Medical Stores for destruction were strengthened and clarified.
Health worker knowledge of QI
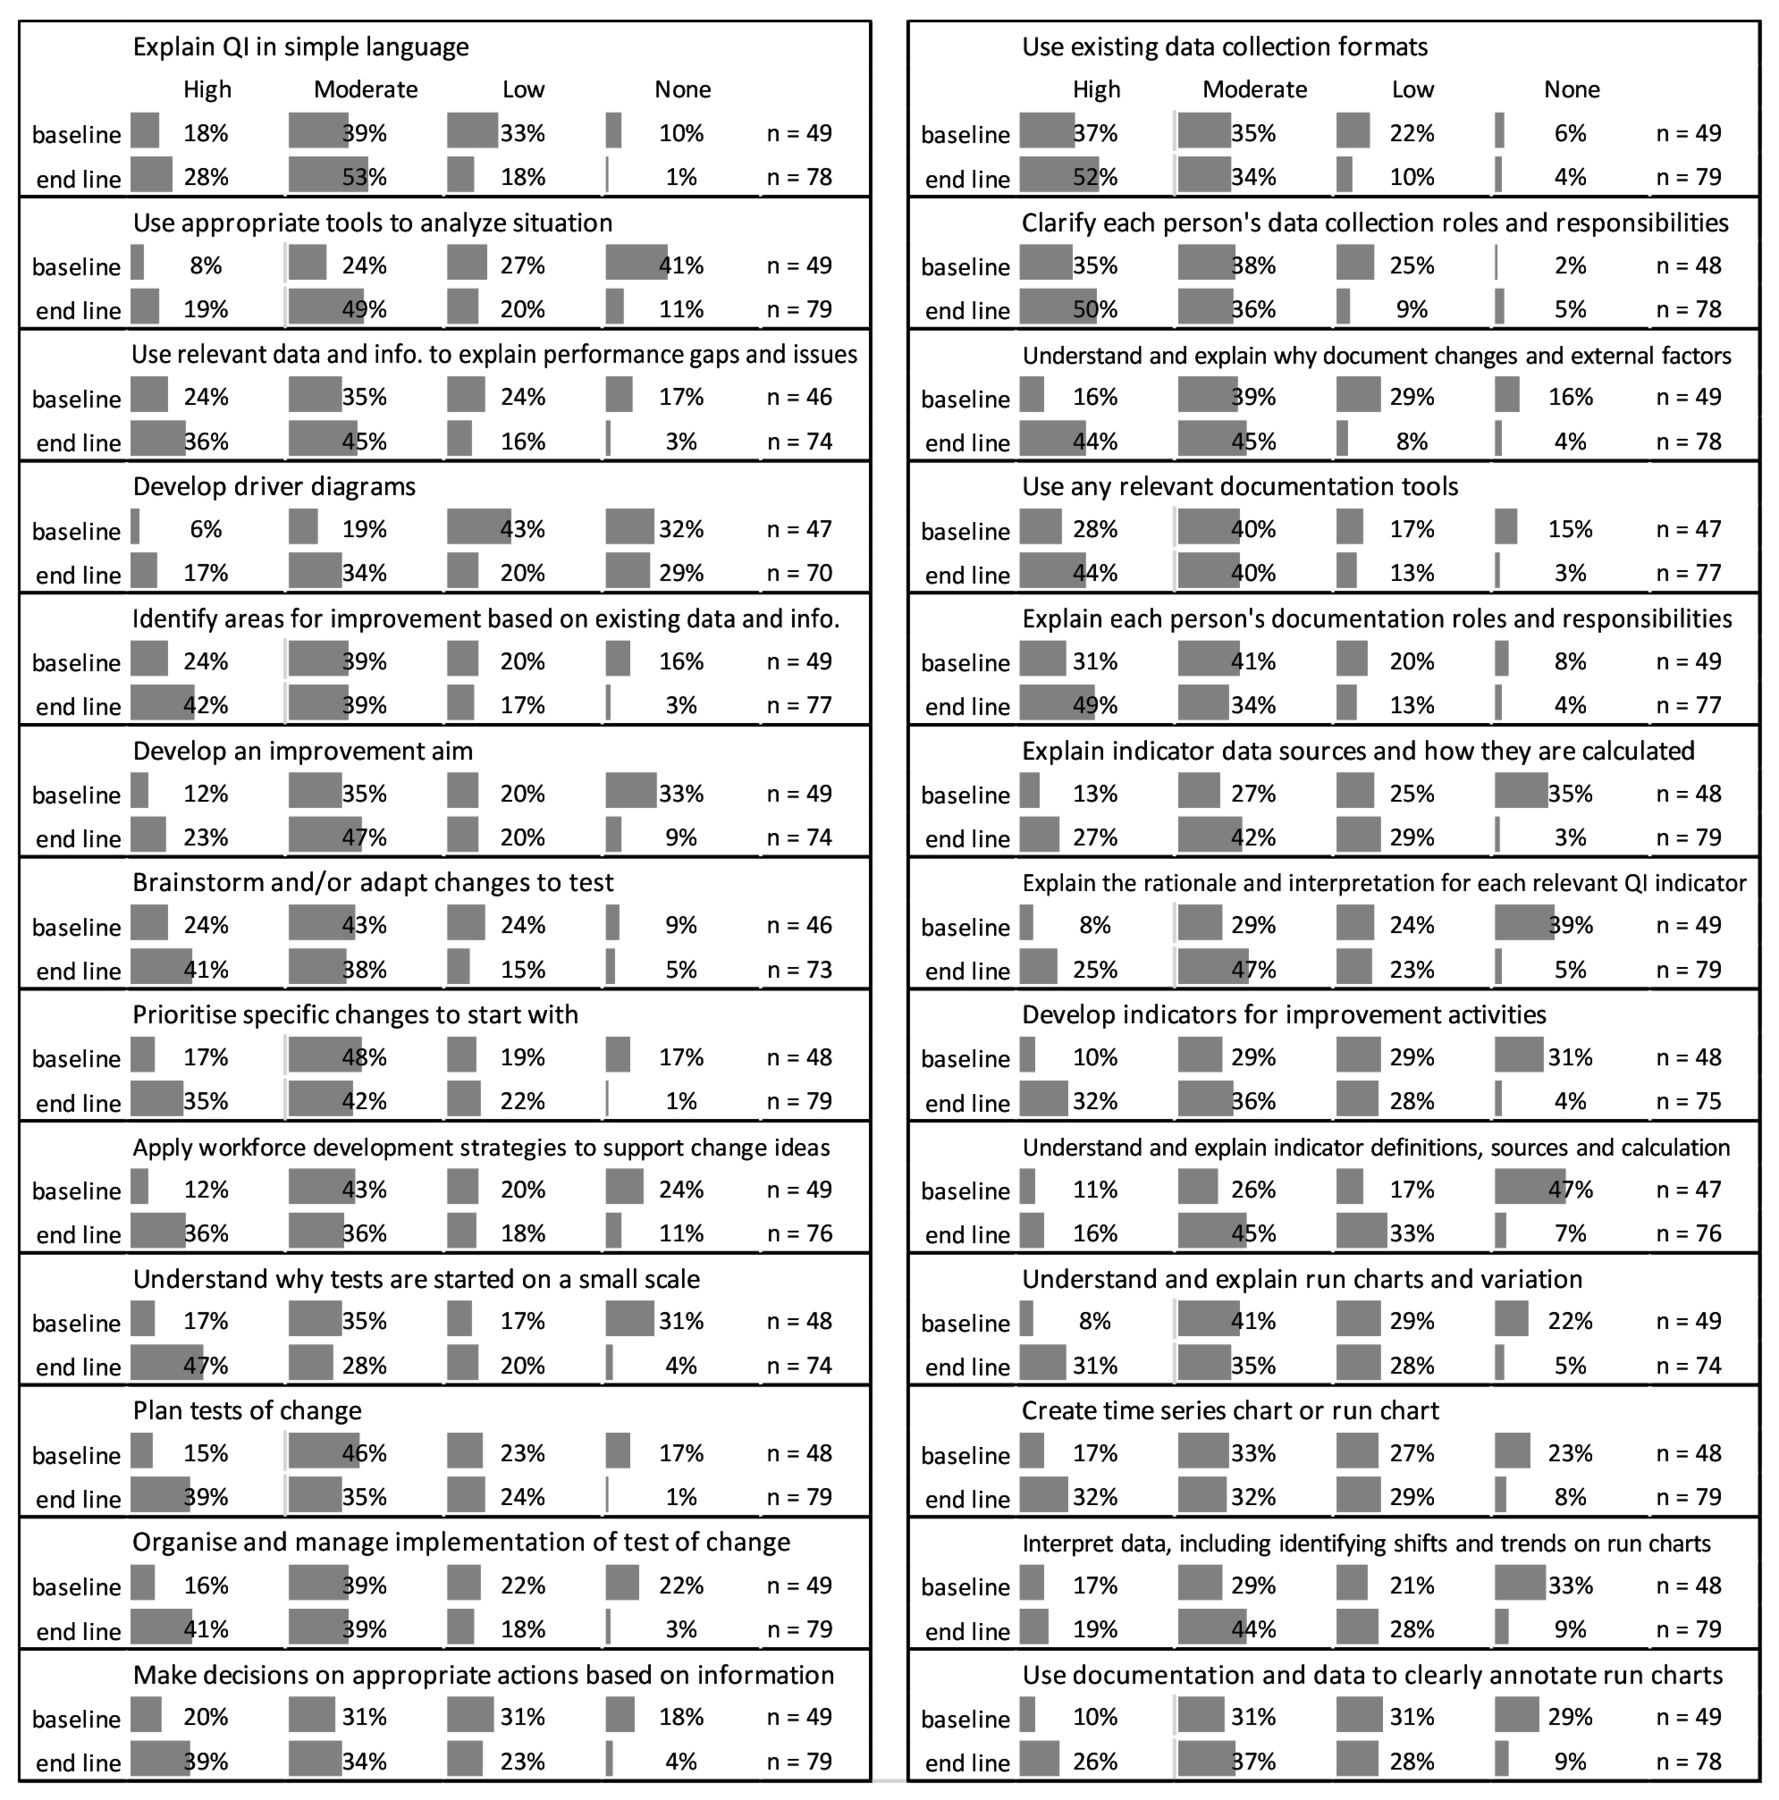
In March 2012 (baseline) and August 2014 (end line), health workers were asked to self-assess their competency level on 27 QI competencies. The options were:
None: I do not have this knowledge or ability.
Low: I need a lot of support to learn this knowledge or action.
Moderate: I need some support to improve this knowledge and my ability to do this action.
High: I fully possess this knowledge or I am able to do this action.
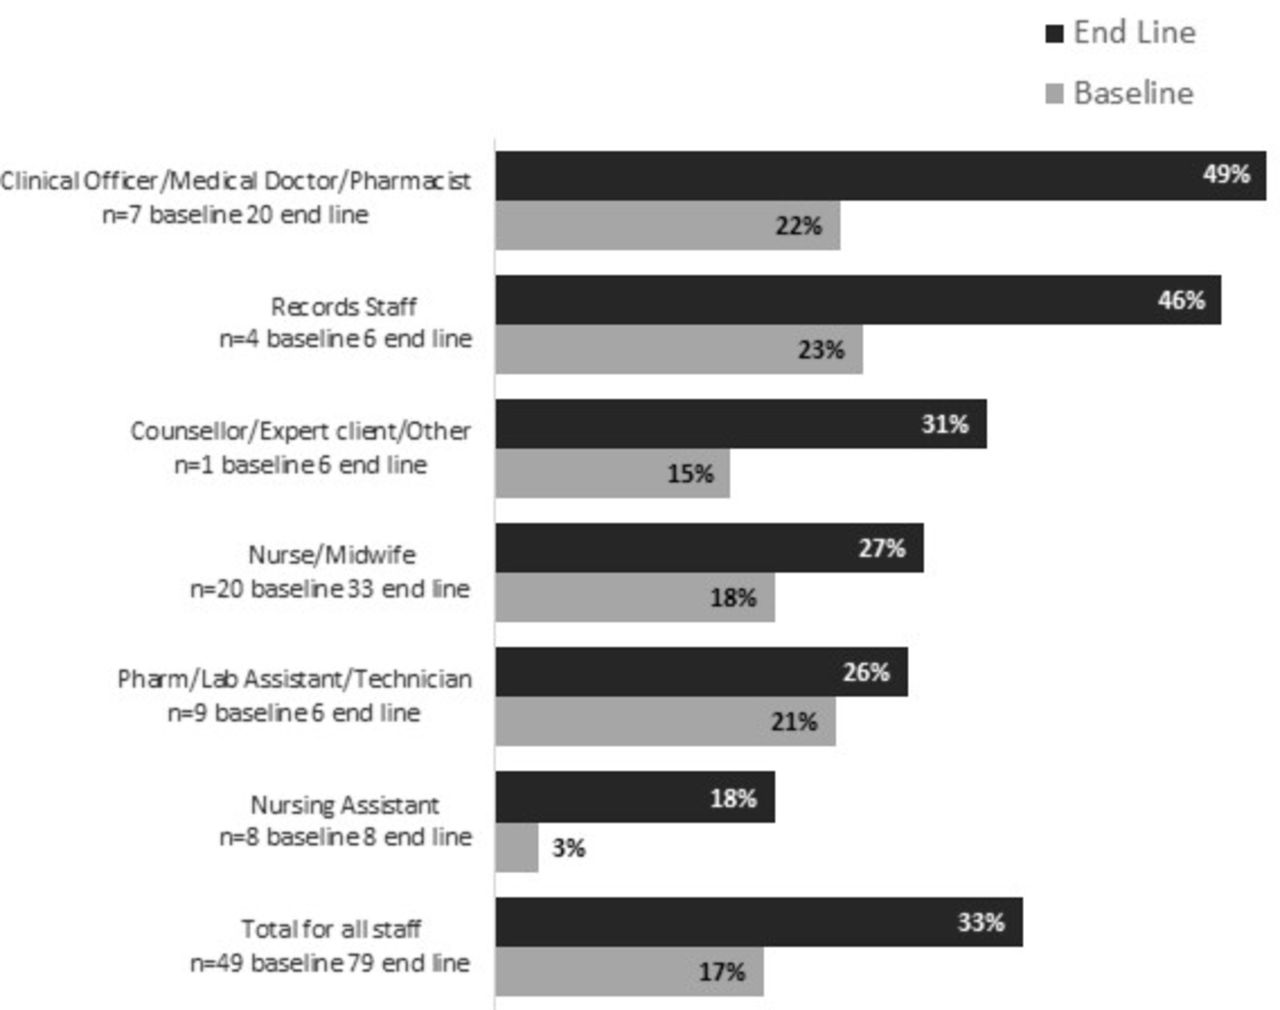
Overall, data on 128 health workers from the 14 facilities were available for analysis of self-reported competence (49 at baseline and 79 at end line). About 17% assessed themselves as having a ‘high’ competence baseline and 33% did so at end line (p=0.0445) (see figure 1). All cadres assessed themselves as highly competent more often at end line compared with baseline, with the biggest improvements seen among clinical officers, medical officers, pharmacists and records staff. Due to the small sample size, differences for individual cadres were not statistically significant.

Average percentage of staff who self-rated their quality improvement (QI) knowledge as high by cadre.
There were also increases in the percentage of health workers who reported ‘moderate’ understanding of the 27 QI competencies. At baseline, there was no competency for which more than 75% health workers rated themselves as having high or moderate competency. At end line, they did so for 12 of the 27 competencies. At baseline, there were 12 competencies for which fewer than 50% health workers rated themselves as having high or moderate competency. At end line, at least 50% of health workers rated themselves as having high or moderate competency for all 27 competencies (figure 2).

Self-assessment of competency level (high, moderate, low or none) for implementing quality improvement (QI) interventions at baseline and end line.
Cost data
Costs of the collaborative improvement intervention were determined from the implementers’ perspective and included those of the project and the in-kind efforts of the MoH. Project costs included improvement expert staff salaries, travel costs, office, and associated operating expenses and facilitation fees specifically for this activity. We used activities-based costing to include all activities from planning, designing, and conducting learning sessions and coaching visits that were included in the total. MoH costs were estimated by determining the amount of time spent by different cadres of health workers involved in all activities associated with the improvement intervention and multiplying it by their average salaries (table 8). During the intervention, there were 12 333 clients receiving services in the 14 participating facilities. This was used as the denominator of the costs.
Total Implementation costs
We determined the incremental cost-effectiveness of the intervention by dividing the additional cost required to implement the improvement activity and dividing it by the improvements in the indicators of service performance seen during the intervention period. Given the multiple process measures of effectiveness of the intervention, it is not possible to account for its cost-effectiveness in terms of a single outcome. Therefore, we report efficiency in terms of the additional number of individuals (clients or clinicians) and additional number of cases completed to compliance in the whole programme for the cost of US$68 300 to the project and the MoH (table 9). An example of the interpretation is that for the cost of US$68,300, there were 3453 additional clients with good clinical wellness and five additional pharmacies in which the incharge has SOPs and 20 additional physicians, clinical officers or pharmacists who rate their knowledge of QI methods as ‘high’, and so on.
Incremental results for the total programme cost
Lessons and limitations
Lessons
Implementation of this improvement intervention in the 14 facilities appeared to have a positive impact on client outcomes, pharmacy department management, staff utilisation and performance, and self-reported knowledge in QI methods over the time that it was implemented. These results were achieved at a cost of about US$5.50 per client receiving HIV services at the participating facilities. This is approximately a quarter of the cost of a month’s supply of tenofovir for one patient in Uganda.10 It represents about 8% of total spending on health per capita.11 However, about 40% of that cost was the in-kind contribution by the MoH which included facility staff time taken by their involvement in improvement activities that did not contribute directly to increased government spending. It is anticipated that if local MoH personnel such as district health officers could assume responsibility for coaching support of facility-based improvement teams, the overall cost would be less because the project transport costs would be avoided.
Efficiency of this intervention was calculated based on dividing the total cost of the intervention by the number of clients served at the participating facilities during the period of the intervention. If we assumed that the effects of the intervention in improving the reported indicators lasted beyond the period of the intervention, even with substantive attenuation of the effect, it would have seemed significantly more efficient.
Limitations
This evaluation only examined the effects of improved pharmaceutical management at facilities on changes to clients on ART. It did not account for changes in outcomes for clients with conditions other than HIV who were receiving medications at the same facilities over the same period. Given that the intervention aimed to improve pharmacy functioning overall, it was expected that outcomes for other conditions related to receiving quality pharmaceutical services would also have improved.
The study also did not measure individual staff competence in performing pharmaceutical tasks or their productivity, which might have given a more sensitive measure of the intervention’s effect. It is also possible that the intervention had a positive effect on other aspects of clinical operations given that it was partly aimed at general system deficiencies and not confined to pharmacy problems. This would have biased the study towards showing a lower effect than may have been seen otherwise. It is also possible that collecting data on balancing measures that reflect changes in other parts of the operations of a facility may have shown a decrease.
This was a preintervention/postintervention evaluation without a control group. It was therefore not possible to account for secular trends, positive or negative, in the outcome variables that may have occurred in the participating sites not associated with the intervention. However, the assumption that all changes reported here were due solely to the intervention is a limitation of the study. Collecting data in control sites was beyond the scope of this evaluation. A longer period of baseline data on the indicators reported in this study was also not available.
The QI knowledge data from the 480 staff in the participating facilities were self-reported from a questionnaire. Knowledge levels may have been reported higher than may have been found by a more objective measure due to social acceptability bias. Also, clinical outcomes data for clients were taken from ART cards and registers rather than from primary data collection by either physical examination by independent data collectors or client questionnaires. This may have led to inaccuracies in the data rather than a bias in one direction or the other. For some sites, there were no baseline data available for some indicators, so these missing data were removed from comparison with the end line data.
Conclusion
This evaluation showed improvement associated with the intervention along with the costs of implementation. This is important information for those making programme decisions because it indicates the feasibility, sustainability and general efficiency of supporting this kind of non-clinical improvement activity in Uganda. It demonstrates how optimisation of the existing workforce can lead to effectiveness and efficiency gains in HIV service delivery and outcomes. With severe shortages of pharmaceutical workers in high-HIV burden countries like Uganda, this intervention presents a more immediate option to longer-term investments in training and development of new pharmacy staff. We recommend implementing the intervention in other facilities that provide ART services in Uganda as part of a package of interventions to improve enrolment and retention of patients with HIV in ART care.
Acknowledgments
This activity was funded and directed by the USAID Office of HIV/AIDS. The authors thank Stephen Okiror, Harriet Egessa, Proscovia Takoba and Robert Kyeyagalire for supporting the teams through coaching sessions and Humphrey Megere, Mirwais Rahimzai, Lani Marquez and Silvia Holschneider from the USAID ASSIST Project, Jacqueline Calnan from USAID Uganda and Diana Frymus of USAID Washington for their comments on the manuscript. The authors also thank the QI teams at the 14 health units and the support and collaboration of the USAID-funded Securing Ugandan’s Right to Essential Medicines (SURE) Project implemented by Management Sciences for Health in Uganda for supporting the health units to address gaps in medicines requisition, storage and dispensing.
Footnotes
Handling editor Jessamy Bagenal
Contributors JBB, EB, TW and EK conceived and designed the study. JBB, EB and SH analysed the data. JBB, EB and SH wrote the paper.
Funding This study was funded by USAID (grant_number AID-OAA-A-12-00101).
Competing interests None declared.
Patient consent Detail has been removed from these case descriptions to ensure anonymity. The editors and reviewers have seen the detailed information available and are satisfied that the information backs up the case the authors are making.
Ethics approval The improvement intervention posed minimal risk and were part of the programme activities that were approved by the Ugandan MoH and USAID who considered them operational activities exempt from the research ethical review process.
Provenance and peer review Not commissioned; externally peer reviewed.
Data sharing statement All data collected during this study, including unpublished data, are available on request from the corresponding author.