Article Text

Abstract
Venous thromboembolism (VTE) is a significant cause of mortality and morbidity among hospitalised patients. A VTE risk assessment reduces this through facilitating correct prophylaxis. Since 2010, the Commissioning for Quality and Innovation payments framework dictates that >95% adult inpatients must have a VTE risk assessment within 24 hours of admission. This target is not currently being met by the urology department at Guy’s and St. Thomas’ Trust (GSTT). Following analysis, a quality improvement project aimed to increase VTE risk assessment rates for patients admitted under urology at GSTT. Two series of interventions were introduced following the Plan, Do, Study, Act structure aimed at urology theatres and wards, respectively. These boosted awareness of the VTE risk assessment and streamlined it into routine surgical workload. Despite not reaching the 95% target, the project increased rates among patients admitted directly to surgical units by 5%–8%. It highlighted the difficulties in driving a change in established routine and demonstrated a need for firmer interventions with effective communication.
- healthcare quality improvement
- pdsa
- quality improvement
- clinical practice guidelines
This is an Open Access article distributed in accordance with the Creative Commons Attribution Non Commercial (CC BY-NC 4.0) license, which permits others to distribute, remix, adapt, build upon this work non-commercially, and license their derivative works on different terms, provided the original work is properly cited and the use is non-commercial. See: http://creativecommons.org/licenses/by-nc/4.0/
Statistics from Altmetric.com
Problem
Venous thromboembolism (VTE) is a major cause of hospital-acquired mortality and morbidity in the National Health Service (NHS). It is estimated to lead to 25 000 deaths among hospitalised patients in the UK each year.1 In 2010, the Commissioning for Quality and Innovation (CQUIN) payments framework issued a national target for >95% patients to receive an initial VTE risk assessment within 24 hours of admission, the final 5% accounting for patients quickly transferred or discharged.2 Trusts failing to meet this target are now liable for penalty fines of £200 per patient missed.2 While Guy’s and St. Thomas’ Trust (GSTT) as a whole reaches this national target, some departments such as urology frequently fall short. This may jeopardise patient safety and needs improvement.
The GSTT urology department is a large tertiary centre treating several thousand national and international patients each year. The majority are admitted for elective surgery. The VTE risk assessment is carried out on Electronic Patient Records (EPR), an online platform to evaluate risk factors and contraindications. Prophylaxis prescription is then undertaken on different software. This duplication of work induces frustration and negatively impacts perception of the VTE risk assessment.
This quality improvement project was undertaken by medical students under the supervision of a urology consultant. The aim of this was to ensure at least 95% of adult patients admitted under urology at GSTT had an initial EPR VTE risk assessment within 24 hours of admission in 6 months. Ethical approval was not required for this project.
Background
VTE encompasses both deep vein thrombosis (DVT) and pulmonary embolism (PE). VTE risk assessment identifies appropriate prophylaxis by stratifying risk of VTE against major bleeding. Patients admitted under urology commonly have risk factors for both, thus VTE risk assessment is paramount. VTE risk factors include active cancer, pelvic surgery, advanced age and immobility secondary to these, compounded by attachment to lines and catheters.3 The estimated risk of DVT and PE after urological surgery is 10% and 1%, respectively.3 Evidence for bleeding rates is limited.4 5 Nevertheless, pharmacological thromboprophylaxis is often contraindicated in haematuria, a common urological problem.6
Previous quality improvement projects involving VTE risk assessment use a VTE ‘champion’ (namely a designated individual) to conduct assessments, education, prompts, reward schemes and measures to streamline assessment into routine work.7–11 Although identifying no clear solution, they demonstrate most success with a VTE ‘champion’, information technology (IT) on-screen prompts and reward schemes. They indicate that educational measures alone are not sufficient but advocate these in conjunction with other interventions to promote an attitude change towards thromboprophylaxis.
Baseline measurement
A 2-week baseline audit was undertaken at the start of the project for all new adult urology admissions. Data were collected off EPR and a pro forma used to capture variables including admitting ward, admission time, admission route (elective or emergency), time of VTE risk assessment and designation of assessor. These objective measures were chosen to provide reliable, unbiased information. The same measures were used in subsequent audits following each Plan, Do, Study, Act (PDSA) cycle. Patients without EPR-documented treatment notes were excluded from analysis based on the assumption that their procedure was cancelled and thus were not truly admitted.
At baseline, 75% of the 139 admissions had a 24-hour EPR VTE risk assessment. Seventy-six patients were admitted directly to an NHS surgical unit (direct surgical group) and had a rate of 67%. The remaining patients were first admitted to one of the urology wards or the private surgical unit. Seventy-nine per cent of assessments were completed by doctors and 21% by Advanced Nurse Practitioners (ANPs) based on the ward. These figures demonstrate a high reliance on ward assessments as opposed to those completed in theatres, meaning a longer wait for assessment and risk of being missed altogether.
Design
The project design was informed by problems highlighted in the baseline audit, shadowing of the patient journey and discussion with the multidisciplinary team (see figure 1). Subsequently, two interventions were developed, the first in theatres and the second on the wards. Sustainability was at the forefront of thought with an aim to generate low cost and long-lasting interventions.
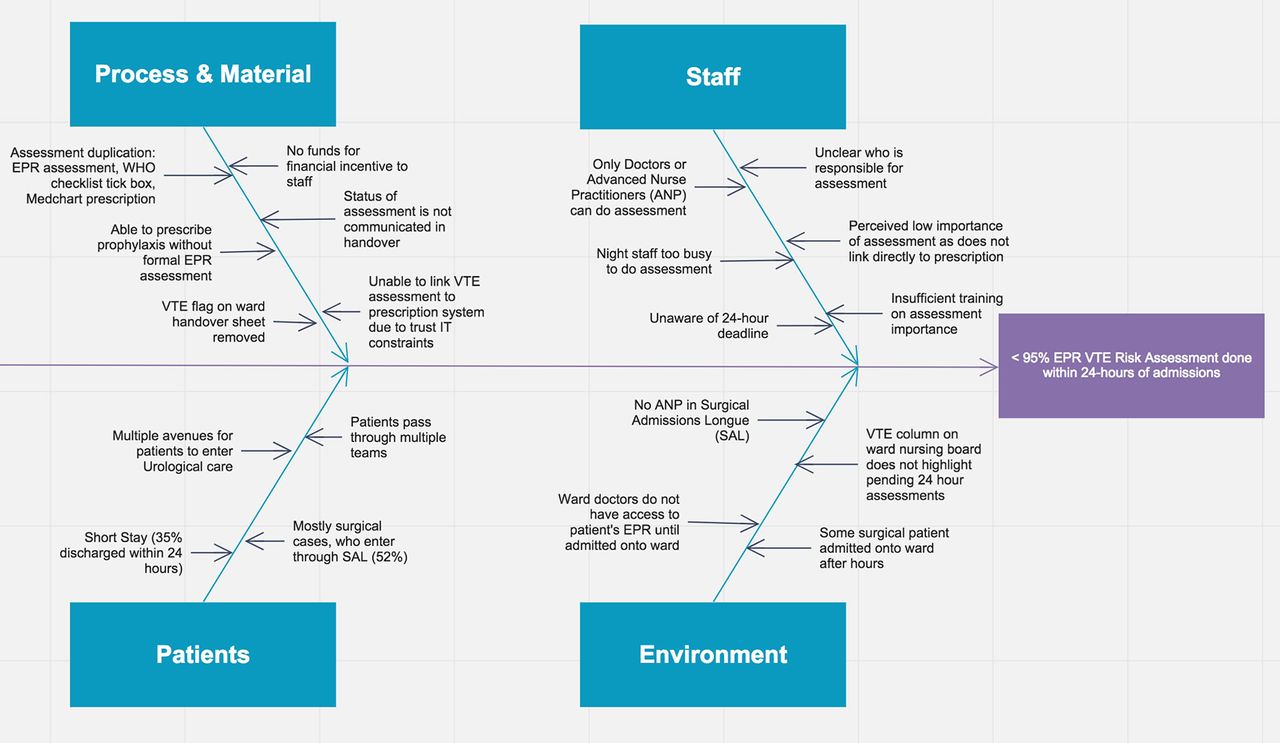
A fishbone diagram summarising factors contributing to urology inpatients not having a 24-hour Electronic Patient Records venous thromboembolism (EPR VTE) risk assessment.
The first intervention aimed to improve rates among surgical patients, taking inspiration from the concept of a VTE ‘champion’ to identify a clear assessor.6 7 While a single champion each day was not realistic given the high patient turnover, the intervention urged surgeons to take responsibility for their own patients using a poster prompt to incorporate assessment into postsurgical routine. Since assessments were more commonly carried out by junior ward doctors rather than senior surgeons, some barriers to change in responsibility were anticipated.
The second intervention was for non-surgical patients and a safety net for assessments missed in the direct surgical group. Ideally, the intervention would have been IT based given the online nature of the EPR assessment; however, the trust had a ban in place for all new IT projects. An incentive or reward scheme as in other projects was also considered, but this was deemed unsustainable long-term.9 Instead, a poster was used containing trust guidelines both to inform and prompt assessment. It clearly displayed risk factors to consider and highlighted both the importance and urgency of the VTE assessment.
Strategy
PDSA 1a (11 January 2017): This 1-day cycle determined the efficacy of assigning surgeons the responsibility of completing VTE risk assessments. It used posters and stickers introduced into a single theatre with a verbal reminder from one of the auditors to the designated surgeon of the day. The poster was placed above the theatre computer and highlighted the poor assessment rates uncovered in the baseline audit, with an emphasis that surgeons were now assigned the responsibility of completing the assessment. It prompted the VTE risk assessment to be completed on EPR at the time where surgeons would log onto the system to scan in the paper operation notes, thus streamlining it into normal workload. It also directed placement of a ‘VTE complete’ sticker onto the paper copy of the WHO surgical safety checklist, a mandatory document for all surgical patients, prior to scanning.12 This helped to reinforce the routine and enabled tracking of intervention uptake. About 100% of the designated surgeon’s VTE risk assessments were completed accompanied by 100% of WHO surgical safety checklists containing a sticker, thus indicating a 100% intervention uptake. Feedback from the surgeon stated that posters were well placed and the intervention was an easy change to make to normal routine but that the stickers were too large and would need frequent replacing.
PDSA 1b (2–15 February 2017): This cycle modified PDSA 1a and scaled it up to all urology theatres. Alterations included an updated educational poster with VTE and bleeding risk factors to emphasise importance and replacement of stickers with smaller, long-lasting ‘VTE complete’ ink stamps attached to the posters with wipeable string. These were again placed above the theatre computers. Surgeons were primarily contacted by email as busy schedules meant face-to-face communication was difficult. The email outlined the poor baseline VTE risk assessment rates and clearly explained how the intervention would work. The project supervisor regularly delivered verbal reminders in an attempt to improve compliance. The intervention achieved an 8% increase in assessment rates for the direct surgical group but only 18% WHO checklists contained a stamp. Feedback suggested that the intervention was not communicated clearly enough and the stamp added extra work.
Although PDSA 1a obtained encouraging results, PDSA 1b demonstrated that adding additional work to an already busy theatre environment was likely to be met with resistance and thus was not wholly successful. It also revealed that a safety net was needed for assessments missed in theatres to be picked up on the wards postsurgery.
PDSA 2 (23 February–1 March 2017): This cycle aimed to inform and prompt VTE risk assessment on the wards using posters. These were placed in the doctors’ office above the computers, at the nurses’ station and attached to mobile computers used during ward rounds. They clearly displayed the trust VTE prophylaxis guidelines to facilitate informed assessment and highlighted the poor assessment rates currently achieved. On the day they were placed, staff were informed of their purpose. Data collected showed a 5% increase in the direct surgical group from baseline but no change in the full cohort or those admitted directly to the ward. This suggests that posters are not effective forms of communication and can go unnoticed. In hindsight, a formal face-to-face education session in conjunction with the posters may have been more appropriate.
Results
The main outcome measure was 24 hours VTE risk assessment rates (post admission), collected off EPR. All statistical tests were done in R and graphs and charts were constructed using Excel. Following PDSA 1a, 100% of the designated surgeon’s risk assessments were complete but since this was a trial run, data were not collected on all admissions. During the other cycles, full cohort assessment rates remained similar; however, there was an 8% and 5% increase in the direct surgical group following PDSA 1b and PDSA 2, respectively (see table 1). These results unfortunately did not achieve statistical significance (P<0.05), which may be due to an insufficient sample size.
Twenty-four hours EPR VTE assessment rates at baseline and following PDSA 1b and PDSA 2 in the full cohort and in those admitted first either to an National Health Service surgical unit (direct surgical group) or the urology wards
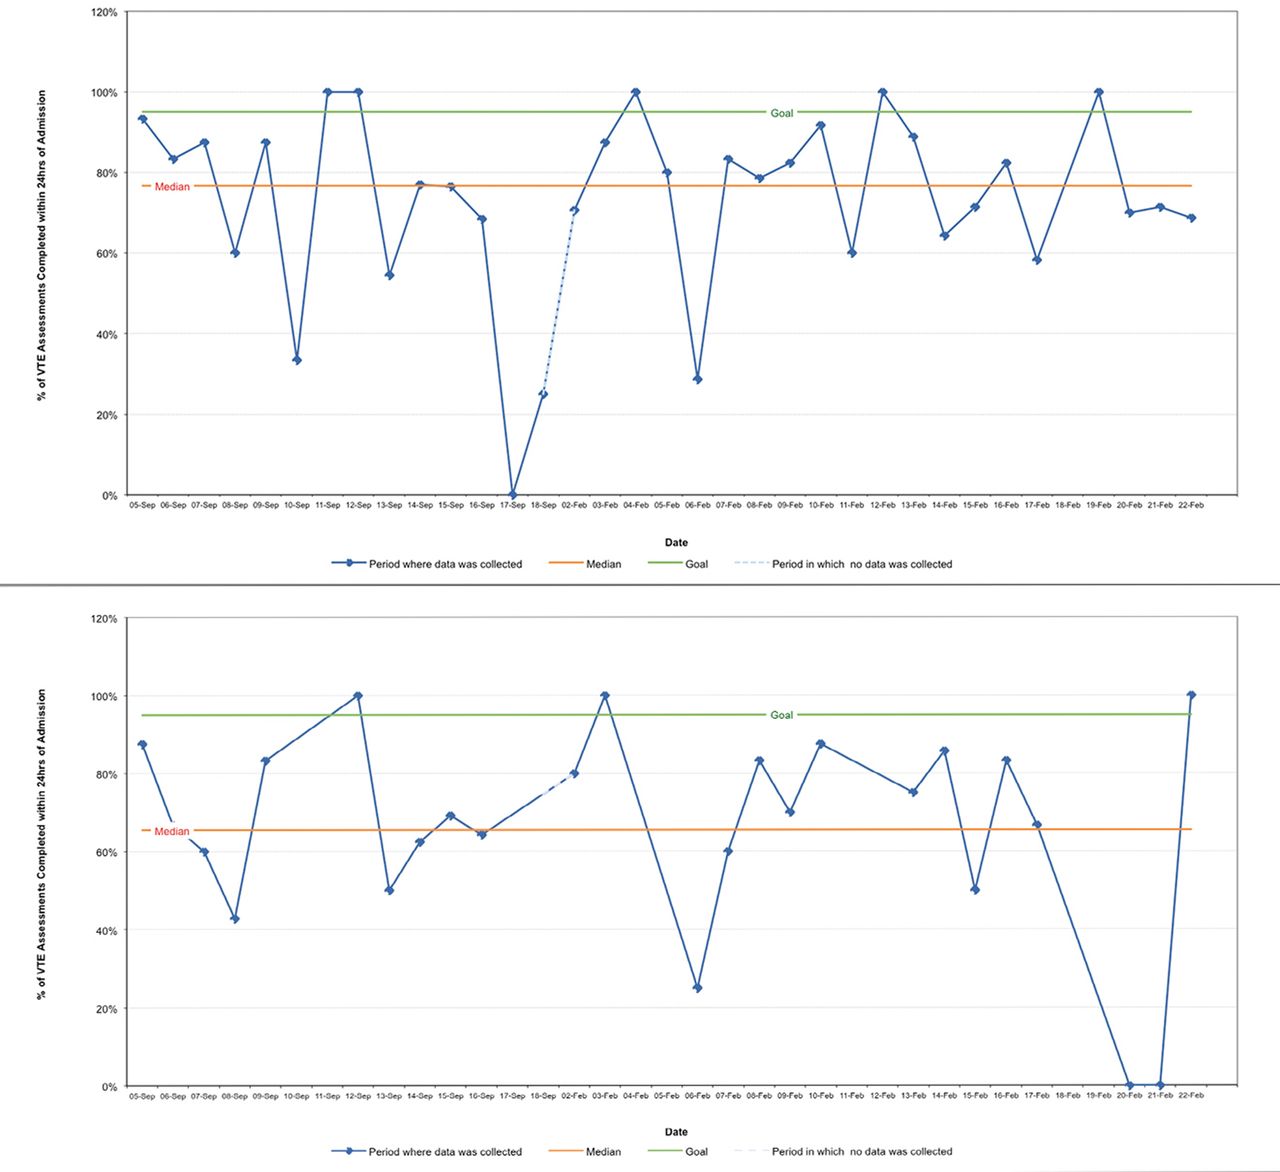
Run charts were generated from the data (see figure 2). There were days where no patients were admitted (represented by no marker point), which demonstrates normal variability in urology and should not affect reproducibility of the methodology. They show some evidence of improvement with proportionally more points above the median after intervention. However, there are no significant shifts, trend or runs in either chart at the 5% significance level.13

Two run charts showing the effects of Plan, Do, Study, Act cycles on 24-hour Electronic Patient Records venous thromboembolism (EPR VTE) risk assessment rates for the full cohort and the direct surgical group. The median was generated from the baseline audit 5–18 September 2016 and days without a marker point are those where no patients were admitted.
An unexpected benefit noted was an increase in the proportion of doctors completing assessments when compared with ANPs from 79% at baseline to 88% after PDSA 1b and 98% following PDSA 2. This may suggest raised awareness of the VTE assessment among doctors and could indicate higher assessment rates during surgery as opposed to reliance on the ward.
Lessons and limitations
Despite increased VTE risk assessment rates among the direct surgical group, unfortunately this project did not meet the stated aim. There are several reasons for this both within the system and the study design that can provide lessons for future quality improvement projects.
First, the project highlighted the need for effective communication. While PDSA 1a was successful, this was not replicated in PDSA 1b where there was a poor intervention uptake with only 18% WHO checklists being stamped. One reason for this was a large staff body and difficulty in communicating face-to-face, with an email more easily overlooked. This may have led to misunderstanding of the intervention and little incentive to comply. PDSA 2 was communicated to staff members on the wards present at the start of the intervention thus relying on them to communicate the message, an unrealistic expectation leading to an unsustainable transference of information. To improve, interventions should be clearly explained face-to-face in a series of staff meetings or handovers as repeated spaced repetition is known to be an effective and sustainable form of learning.14
The second lesson is that driving change on an established routine is very challenging. This is illustrated by Prochaska’s ‘transtheoretical model’ and ‘stages of change’ whereby a change in routine is described as a gradual process, taking many months and moving through several stages.15 To do so, a person should be well informed of the benefits and risks and be willing to change. To make someone amenable to change, it needs to be easy without adding work and regarded with high importance. This was not wholly addressed in PDSA 1a and 1b as the stickers/stamps added work and without immediate repercussions for failure to comply, there was no perceived urgency in the VTE risk assessment. Staff attitudes are key in generating sustainable change and this should have been a greater focus in the project.16 In addition, a 6-month time limit on a project of this scope is not sufficient to drive the necessary changes or change attitudes and cannot generate large enough sample sizes to produce statistically significant results.
This change process was also limited by pre-existing negative views on the EPR assessment and frustration at having to prescribe on different software. Information was given on posters to raise the profile but face-to-face education would have been more effective at highlighting the effects on patient safety. However, this project also demonstrates that educational measures alone are not sufficient. The trust ban on IT projects hindered other interventions such as linking assessment and prescription systems that could have tackled the problem at its heart. Furthermore, an IT-based version of PDSA 1a and 1b such as a pop-up alert on EPR while surgeons upload operation notes would have more effectively grabbed attention and boosted sustainability by eliminating the need to replace stamps.
Failing improvement, firmer interventions may be necessary with either reprimands or rewards associated with intervention uptake to ensure compliance. Ideally, PDSA 1b would have been built on further, creating a permanent change on the WHO checklist meaning patients could not leave the theatre without completed assessments. Although the project team did not have the authority to make this change, it has been reported to those that do.
Conclusion
In conclusion, VTE risk assessment and prevention of VTE and major bleeding incidents is paramount to uphold patient safety. This project took inspiration from previous quality improvement projects that used educational measures, VTE ‘champions’ and streamlining VTE assessments into routine work.6–10 Although the stated aim was not met and further work is required, there was increased rates among elective surgical admissions and this project boosted awareness about the VTE risk assessment.
To improve, further staff education is necessary alongside firmer interventions such as changes to the WHO checklist and coupling assessment to the online prescription system. These are being considered by higher authority in the trust. With these cost-effective and sustainable changes, financial and social costs to both the trust and patients may be reduced. The importance of effective communication, the difficulties in driving change and the need to allocate a realistic timescale may be taken by future quality improvement projects elsewhere to maximise patient outcomes.
Acknowledgments
We would like to thank the GSTT urology department for their cooperation and Mr. Ramesh Thurairaja for his guidance and support during the project
Footnotes
Handling editor Jen Perry
Contributors EM, SI and FT together designed the quality improvement project and collected baseline data. EM and FT implemented PDSA cycles and collected data following each cycle. SI conducted statistical analysis. EM wrote the article draft. EM, SI and FT gave final approval for the article to be published.
Disclaimer All the views expressed in this paper are our own and do not reflect the official position of King’s College London.
Competing interests None declared.
Provenance and peer review Not commissioned; externally peer reviewed.