Article Text

Abstract
The NHS Institute for Innovation and Improvement has determined that a £7 million saving can be achieved per trust by improving theatre efficiency. The aim of this quality improvement project was to improve orthopaedic theatre turnaround without compromising the patient safety.
We process mapped all the stages from application of dressing to knife to skin on the next patient in order to identify potential areas for improvement. Several suggestions arose which were tested in multiple PDSA cycles in a single theatre. These changes were either adopted, adapted or rejected on the basis of run chart data and theatre team feedback.
Successful ideas which were adopted included, the operating department practitioner (ODP) seeing and completing check-in paperwork during the previous case rather than during turnaround, a 15 minute telephone warning to ensure the next patient was fully ready, a dedicated cleaning team mobilised during wound closure, sending for the next patient as theatre cleaning begins.
Run charts demonstrate that as a result of these interventions the mean turnaround time almost halved from 66.5 minutes in July to 36.8 minutes over all PDSA cycles. This improvement has been sustained and rolled out into another theatre. As these improvements become more established we hope that additional cases will be booked, improving theatre output. The PDSA cycle continues as we believe that further gains may yet be made, and our improvements may be rolled out across other surgical specialities.
This is an open-access article distributed under the terms of the Creative Commons Attribution Non-commercial License, which permits use, distribution, and reproduction in any medium, provided the original work is properly cited, the use is non commercial and is otherwise in compliance with the license. See:
Statistics from Altmetric.com
Problem
Optimising cost effectiveness of health care is the modern challenge for the NHS. Trusts in England estimate a £2.3 billion deficit by the end of 2016 1. It is therefore essential that every effort is made to make each service as efficient and as cost-effective as possible, without compromising patient care. Operating theatres are one of the most expensive areas in a hospital to run, with an average cost of approximately £1200 per hour.2 They also represent one of the most profitable areas of healthcare delivery for NHS trusts, if delivered efficiently. Streamlining could lead to significant savings. For example, the NHS Institute for Innovation and Improvement calculate that the average trust has an opportunity to save £7 million a year in efficiency savings by running a ‘productive theatre’.2
According to the National Joint Registry for England, Wales, Northern Ireland and the Isle of Man, 85,972 primary total hip replacements and 94,814 primary total knee replacements were performed in 2014.3 The ageing population is expected to create increasing demand for such orthopaedic services. Failure to improve output in the face of increasing demand will increase waiting lists, causing prolonged discomfort, decreased quality of life and additional morbidity. Improved efficiency with greater theatre output will help to reduce the waiting times for routine surgery. Hamilton and colleagues concluded that meeting waiting time targets is one of three factors which improve patient satisfaction with joint arthroplasty, and so it is imperative that every attempt is made to ensure waiting times are kept to a minimum.4
The aim of this project is to reduce the time between cases in an elective orthopaedic theatre setting.
Background
An audit reviewing efficiency of orthopaedic trauma theatres found efficiency to be sub-optimal with regular late starts and prolonged changeover times.5 Understandably, where work is unpredictable with variable case loads and where list changes are determined on clinical priority, theatre efficiency is difficult to achieve. However, in elective surgery list organisation should be predetermined, and optimally planned making run chart data comparisons valid.
This improvement project was conducted in the orthopaedic theatres of Southmead Hospital. The authors represent the improvement team consisting of two medical students, one orthopaedic trainee, one orthopaedic consultant and one consultant anaesthetist. We have also acknowledged the participation of key theatre staff to whom we are very grateful.
Baseline measurement
We have defined turnaround time as the interval between application of final dressing and knife to skin on the next patient. Over the course of 2 weeks, we collected data on 50 theatre turnaround times following observation of 69 major orthopaedic procedures, from the elective theatres in Southmead hospital, North Bristol NHS Trust. We observed the workings of the theatre team members during the turnaround time, thereby creating a process map of the many tasks required to complete theatre turnaround (see figure 1).

Process map illustrating all stages of theatre turn around time
Using this process map, we divided the process of turnaround into key stages (see figure 2) and designed a proforma which was used to record the time of these key stages and therefore the overall turnaround time between cases. We also collected basic data relating to the date, specific surgical procedure, and theatre number. The following times were recorded for all cases: Application of final dressing, patient leaves theatre, completion of cleaning, completion of kit checking, sending for next patient, next patient arrives, anaesthetic starts, anaesthetic finishes, patient positioning including sterile skin preparation and draping, knife to skin.

Illustration of key theatre turnaround times.
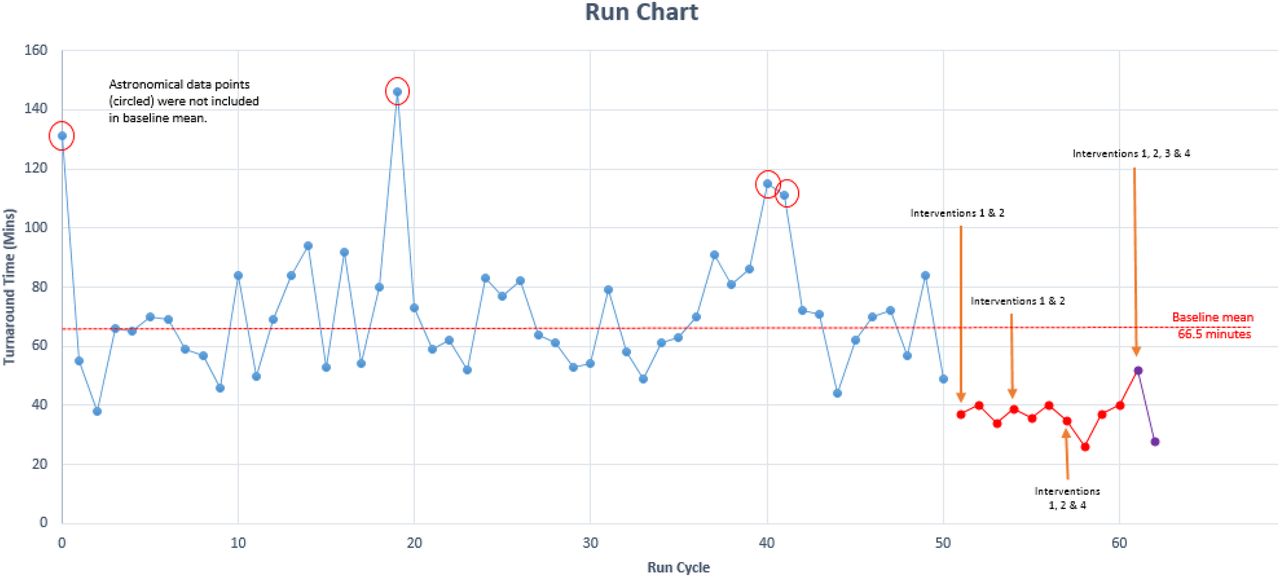
Following this period of data collection in July 2016, and after the exclusion of 4 astronomical data points (encircled on run chart in figure 3), the mean turnaround time was 66.5 minutes.

Run chart illustrating mean turnaround time prior to interventions and decrease in turnaround time after PDSA cycles.
Analysis of the time taken to complete each stage of the turnaround process led to the identification of areas for improvement. Close observation of, and discussion regarding theatre team working practices identified other suggestions for improvement.
In summary, we tried to improve theatre turnaround time by 20 minutes per case over the period of three months.
Design
Our project was run on a cost-neutral basis, so in order to improve theatre efficiency in this way we designed our interventions accordingly (e.g. no extra workforce employed). A consensus was reached regarding a list of simple interventions following discussion with all key stakeholders (theatre scrub and anaesthetic clinical staff, theatre managers, surgeons, and anaesthetists). We routinely check kit for the next case during surgery and our anaesthetists draw up and label drugs prior to the arrival of the next patient. We introduced new interventions with a step-wise approach:
A 15 minute warning to the preoperative patient area: A telephone call from theatre to the preoperative area was intended to ensure the completion getting the patient ready for theatre. This was an opportunity for the patient to toilet if necessary, staff to complete any outstanding paperwork and gather the hospital notes and ensure the patient was appropriately attired for theatre.
The operating department practitioner (ODP) was encouraged to briefly leave theatre during surgery to check-in the next patient rather than doing this during turn around time. This is largely a matter of asking the patient some questions and completing paperwork.
Mobilise a dedicated cleaning team during skin closure. A dedicated cleaning team consisting of two healthcare assistants were employed prior to this quality improvement project. Feedback from them suggested that a 5 minute warning would ensure they could prepare mops and buckets for cleaning to start as soon as appropriate and without delay.
Simultaneous cleaning and sending. It was apparent from observing baseline turnaround times that waiting for theatre to be clean and ready before sending for the next patient resulted in unnecessary delays. We discovered that the times taken for cleaning and sending for a patient were both consistent, therefore sending could commence simultaneously.
Strategy
Our aim was to reduce mean theatre turnaround by 30 minutes during September and then roll this out to a second theatre over subsequent PDSA cycles. We considered the key stages of theatre turnaround as illustrated by figure 2.
PDSA cycle 1 (September 2016). Following our baseline measurement in July 2016 we decided to introduce changes 1 and 2, as described previously. We implemented these over a list of 4 cases where we observed 3 turnaround times. The expectation from this cycle was to observe a mean reduction in theatre turnaround time.
PDSA cycle 2 (September 2016). The aim of this cycle was to assess the sustainability of interventions 1 and 2. During this cycle we expected similar time reductions to what were seen in PDSA cycle 1. From observing PDSA cycle 2 we identified a further area where we thought time savings could be made. Cleaning theatre and sending for the next patient simultaneously would help to prevent delays down the line and so this was introduced into PSDA cycle 3.
PDSA cycle 3 (October 2016). Following the introduction of simultaneous cleaning and calling for the next patient, we expected to see further reduction in mean turnaround time. The mean turnaround time for this cycle was 34.5 minutes, which is an improvement on cycle 1 and 2 which had means of 37 and 38.5 minutes respectively. Following analysis of data collected from the 3 PDSA cycles, we thought it appropriate to introduce a 5 minute warning to the theatre cleaners so that they would be ready to enter theatre and start cleaning as soon as it was appropriate. We introduced this change into PDSA cycle 4.
PDSA cycle 4 (November 2016). The aim of this cycle was to assess the effect of introducing a 5 minute warning to the theatre cleaners. We expected to see a further reduction in turnaround time, in particular, the time taken to clean theatre once the patient had left. We also decided to introduce our interventions into a new theatre in this cycle, to see if the changes we had made were transferable to other theatres and other teams. The mean turn around time for this cycle was 40 minutes, a significant improvement on the baseline measurement but slightly longer than previous cycles. This is likely due to the interventions being introduced to a new theatre with different staff.
Results
The baseline mean theatre turnaround in July 2016 was 66.5 minutes as displayed in figure 3. The overall mean turnaround time in theatre following interventions was 36.8 minutes. This equates to a 45% reduction in turnaround time. This data was collected from 4 PDSA cycles which we'll discuss separately. The first cycle saw a mean turn around time of 37 minutes, a 44% reduction in time following interventions 1 and 2.
The second PDSA cycle also saw time savings, albeit not as great as the first. A mean turnaround time of 38.5 minutes was recorded which equates to a 42% reduction. This demonstrates sustainability of our interventions.
PDSA cycle 3 saw improved results with a mean turnaround time of 34.5 minutes. This is a 48% reduction in the mean turnaround time, compared with our baseline measurement.There were 3 intervals that displayed the biggest time savings. The largest of these being the time taken from arriving in theatre to the anaesthetic starting. This was reduced from an average of 7.4 minutes to 0.5 minutes. The 2 other areas which saw considerable improvements were the time from sending for the patient to the patient arriving in theatre, with a reduction from 8.2 minutes to 4.3 minutes. Additionally, savings were made in the time taken for patient to leave theatre to theatre being clean and ready for the next case. This was reduced from 9.1 minutes to 5.0 minutes.
The fourth PDSA cycle also saw an improvement in the mean turnaround time compared to baseline. The mean turnaround time recorded was 40.0 minutes, a 40% reduction compared with the baseline. Although this is a significant reduction, it is not as great as the previous PDSA cycles and this is largely due to the fact that we introduced the interventions into a new theatre and to a new team. However, we did introduce intervention 3 in this PDSA cycle which resulted in a mean reduction of 20% in cleaning time.
Lessons and limitations
This project taught us that implementing change requires meticulous preparation and careful discussion with all staff, listening to and addressing concerns sympathetically. Numerous concerns were initially raised at the conception of this project such as the potential for reduced patient safety, quality of care and patient unacceptance. None of these concerns were found to be valid when interventions were introduced, and discussion was helpful for alleviating fear. Staff need to be committed to improvement to ensure that culture changes within an institution, resulting is sustained change. We found a collaborative approach successful in this regard.
When preparations for implementing these new interventions were less rigorous on our part, staff understandably reverted back to usual practice which lengthened turnaround.
There are several limitations to our work. We were unable to introduce an lasting incentive to drive teams towards increasing efficiency. Moreover, efficient theatre staff who worked hard to complete operating lists ahead of schedule were regularly re-deployed to unpopular tasks in other theatres.
We have concerns that an audit effect may partially explain our results. Performance may have improved as staff knew times were being recorded. This may explain why the anaesthetic and positioning times improved despite no intervention apparently addressing these.
Although no safety issues occurred during this project, the potential for an anaesthetic issue arising whilst the ODP is out of theatre checking in the next patient exists. We therefore believe the ODP and anaesthetist should decide as a partnership when it is safe for the ODP to leave. However, the ODP's in adjacent theatres were alerted to the project and warned that they may be required in the case of an emergency.
Calling the preoperative patient area clearly requires someone to answer the telephone and could be time consuming. We refined this conversation to a 20 second call explaining the nature of the call, the identity of the next patient, and what action was required. A general improvement in communication like this may improve safety and the patient experience as preoperative staff have a better understanding of the progress being made in theatre and can communicate this to patients. Automation of this communication may further enhance efficiency. For example, if the preoperative patient area had an accurate indication of the time until each theatre is ready for the next patient, they may be able to better prioritise, allocate staff resources, and not leave patients in hospital gowns for any longer than necessary. We have considered a web based traffic light warning system to convey this information.
We believe our work is largely generalisable to most hospitals performing planned surgery, and should be particularly helpful to those adjusting to practice without anaesthetic rooms. Whilst many of these interventions should be successful on emergency lists we acknowledge the fluid and changing order of cases on such lists.
Conclusion
This project aimed to identify inefficiencies and delays in turnaround time within elective orthopaedic theatres. We successfully identified several areas for improvement and hence were able to implement interventions in order to streamline the turnaround process. Following the introduction of; a 15 minute warning to the pre-operative rooms, the patient being checked-in in the preoperative rooms rather than theatre, the patient being sent for prior to completion of theatre cleaning and finally, a five minute warning given to theatre cleaning staff; a 45% reduction in mean turnaround time was observed over four PDSA cycles between July and November 2016. It is apparent that the increased efficiency would allow more operations to be scheduled per day and thus result in shortened waiting lists reducing patient discomfort. If changes were to be implemented over all five elective orthopaedic theatres in Southmead hospital, a daily saving of £11,880 could be achieved, based on a four patient list. The four cycles that we witnessed spanned two months and therefore we can assume that these interventions are sustainable. However, it would be sensible to further assess the sustainability of our interventions by collecting more data in future. Although we only investigated elective orthopaedic procedures, there is scope to apply these changes to other surgical specialties as patient turnover is a series of uniform events consistent between all specialties.
Acknowledgments
We would like to thank all members of the orthopaedic theatre department for their support. Particular thanks go to Jolly Varghese and Shannon Nolan and Natalie Hay for their proactive participation and helpful feedback.
Footnotes
Declaration of interests Nothing to declare.
Ethical approval Ethical approval for this project was not required.