Article Text

Abstract
Patient experience is a key pillar of healthcare quality. We describe a framework of three short generic measures covering Patient Experience, Result Satisfaction and Service Integration. The Result Satisfaction measure is described for the first time.
These measures capture twelve aspects of patient experience covering the relationship between patients and clinicians (Patient Experience), the immediate results of the consultation or treatment as perceived by patients (Result Satisfaction) and collaboration between different healthcare services and silos (Service Integration). Each measure has four items.
These measures are compared with three national measures: the Friends and Family Test and the General Practice Patient Survey used in England, and HCAHPS used in US hospitals. The expected benefits of national measures are not being achieved and we need to think again about how best to tailor health services to meet patients’ expectations.
The three measures described (Patient Experience, Result Satisfaction and Service Integration) are generic, short and have low reading ages. They share common forms and scoring schemes, which mean that they can be used individually or in combination at all levels of a healthcare provider.
- Patient-centred care
- Patient satisfaction
- Quality measurement
- Quality improvement methodologies
- Surveys
This is an open access article distributed in accordance with the Creative Commons Attribution Non Commercial (CC BY-NC 4.0) license, which permits others to distribute, remix, adapt, build upon this work non-commercially, and license their derivative works on different terms, provided the original work is properly cited, appropriate credit is given, any changes made indicated, and the use is non-commercial. See: http://creativecommons.org/licenses/by-nc/4.0/.
Statistics from Altmetric.com
Introduction
All patients want and deserve a good experience of care. Patient experience is a key quality outcome, which can be used to improve quality, governance, accountability and choice.1 However, it is also a complex, multiattribute concept that reflects patients’ perceptions and experiences of receiving care.
A short definition of patient experience is the sum of all interactions, shaped by an organisation’s culture, which influence patient perceptions across the continuum of care.2 Patient experience is patient-reported perception of a healthcare organisation and their journey across the continuum of care. Patient-reported experience measures (known as PREMs) focus on the healthcare provider, which provides the service.
Patient experience has three dimensions: relational, functional and integration.
Relational experience relates to the interaction between clinician and patient.3 This is the focus of most efforts to improve patient engagement and patient-centred care.
Functional experience, or Result Satisfaction, is about immediate benefits perceived by patients at the time.4 This does not cover medium-term and long-term benefits or patient outcomes.
Integration experience, or Service Integration, relates to the patients’ experience of care, which cross traditional silos.5 This is the focus of whole system approaches.
Measures are needed for all three. PREMs focus on the care provider, while patient-reported outcome measures are about the subject of care.6 Patient experience is more objective than patient satisfaction. Some people are satisfied with standards of care that others find inadequate. However, patient experience surveys have been criticised for survey length, infrequent sampling frequency and slow feedback.7
We should distinguish between things that impact health outcomes and those that are cosmetic. For example, good communication between staff and patients may lead to faster recovery, but the quality of wall-paper in the reception area probably does not.
All patients seek high levels of experience, effectiveness and safety.8 Many PREMs are specific to particular types of care, such as inpatient stays, general practice appointments, outpatient visits, maternity care, care homes or domiciliary care. Our focus is on generic measures, which apply to all patients, irrespective of their problems or the type of treatment they receive.
Study aim
This paper has three main aims.
First, it aims to show how the concept of patient experience can cover relational, functional and integration experience. These are different and complementary concepts.
Second, it describes some criteria used to develop new measures of functional and integration experience, as well as a modified measure of relational experience.
Third, it compares these measures in length and readability with three existing measures.
Methods
We used a similar development approach throughout. This involved literature review, informal focus groups with clinicians and users, and our own experience in developing questionnaires. Each measure evolved through multiple iterations over months or years until everyone was happy. The development and validation of any new measure is not something to be undertaken lightly. It always takes much longer than expected, even knowing that this is not a quick job.
We use four core criteria, which can be measured easily: relevance, responsiveness, brevity and readability.9
Relevance
Every question asked must be relevant and suitable for frequent, repeated use. Response rates are a measure of relevance. If people do not answer an item, this may be because it is not relevant, is worded ambiguously and they do not know how to answer, asks sensative or personal questions, or is inappropriate in some other way. In each case the question needs to be reviewed.
Responsiveness
Responses should be sensitive to the types of change that can be made by local staff and managers. Things that cannot easily be changed, such as clinic location, transport, parking, payments and regulations should not be asked routinely. Wording that generates noise or is not responsive to change should be avoided. Responsiveness can be measured by testing results statistically between different services, or before and after changes.
Brevity
Measures should be as short as possible to minimise time to complete by patients (or proxies if patients are not able to complete it themselves). Respondent burden is a function of survey length. Word-count is a simple measure of brevity.
Readability
Wording needs to be clear to all respondents. This means that only simple words are used, which are widely understood in the same way by the target population. This also simplifies translations into other languages. Readability is a measure of clarity. Many readability measures have been developed including: the Flesch reading ease score,10 the Gunning fog index,11 the standard measure of gobbledygook12 and the Flesch-Kincaid grade (FKG).13
We use FKG, which equates roughly to the US school grade. Reading age is approximately FKG plus five. Statistics are based on the full published text, including instructions, framing statements, items and options. The word count and FKG were measured using Microsoft Word 365 (V.16.63).
Options and scoring
In each measure, the strength of each item is rated using four options. Each option is indicated in mutually supporting ways to reduce cognitive effort, avoid the need for training and improve face validity. These are:
Written labels.
Position decreasing in excellence from left to right.
Colour (green, yellow orange and red).
Smiley face emojis.
Written labels are the most important. You cannot use colour, position or emojis when the measure is completed during a telephone call.
The options may vary according to context. Our original paper on patient experience used excellent, good, fair and poor.14 Here, we use the option set strongly agree, agree, neutral and disagree, with minor changes in item wording to mean the same things. There is benefit in using the same option set throughout. Each measure also includes a short preamble, which may be adapted to local context.
For analysis and reporting, each item is given a score on a 0–3 scale as follows: disagree 0, neutral 1, agree 2 and strongly agree 3. A summary score is calculated by adding the individual scores for each item, giving a scale with 13 possible values from 0 (4×disagree) to 12 (4×strongly agree). A high score is always good, and a low score is always bad. The summary score is blank if any item is missing.
For a population (more than one respondent), the mean scores are transformed to a 0–100 scale, where 0 (the floor) indicates that all respondents rated disagree and 100 (the ceiling) indicates that all respondents rated strongly agree. This is done by multiplying individual scores by 100 and dividing by 3 for items or by 12 for summary scores. This allows both mean item scores and mean summary scores to be scored 0–100, allowing comparison.
Results
Patient experience
The Patient Experience measure (also known as howRwe) was developed during the period 2012–14 for regular routine use. For more information, see the original paper, which uses different options and pronouns.14 The four dimensions are:
Compassion. This includes how individuals are treated directly, including empathy, emotional support, politeness, dignity, respect and privacy. The wording is ‘We treat you kindly’, where ‘we’ applies to the provider organisation and staff.
Communication. This broad area includes all aspects of communication between patients and their clinicians (both ways). It includes patient engagement, information provision, education, choice, consent, shared decision making and empowerment. (‘We listen and explain’).
Timeliness. This covers all types of delay, waiting, access, cancellation and responsiveness; it includes delays between referral and appointment, waiting to be seen and the time taken to answer a call from a bed or by telephone. (’We see you promptly’).
Reliability. This covers how well patients perceive the unit is managed, including safety, dependability, efficiency and whether information (eg, lab results) is available when and where needed and is acted on appropriately. (’We are well organised’).
The standard preamble is ‘How are we doing? (our recent care)’. However, this wording can be adapted to local context and the patient’s care pathway.
The PREM, showing the preamble, items and options is shown in figure 1.

Patient experience measure.
Result satisfaction
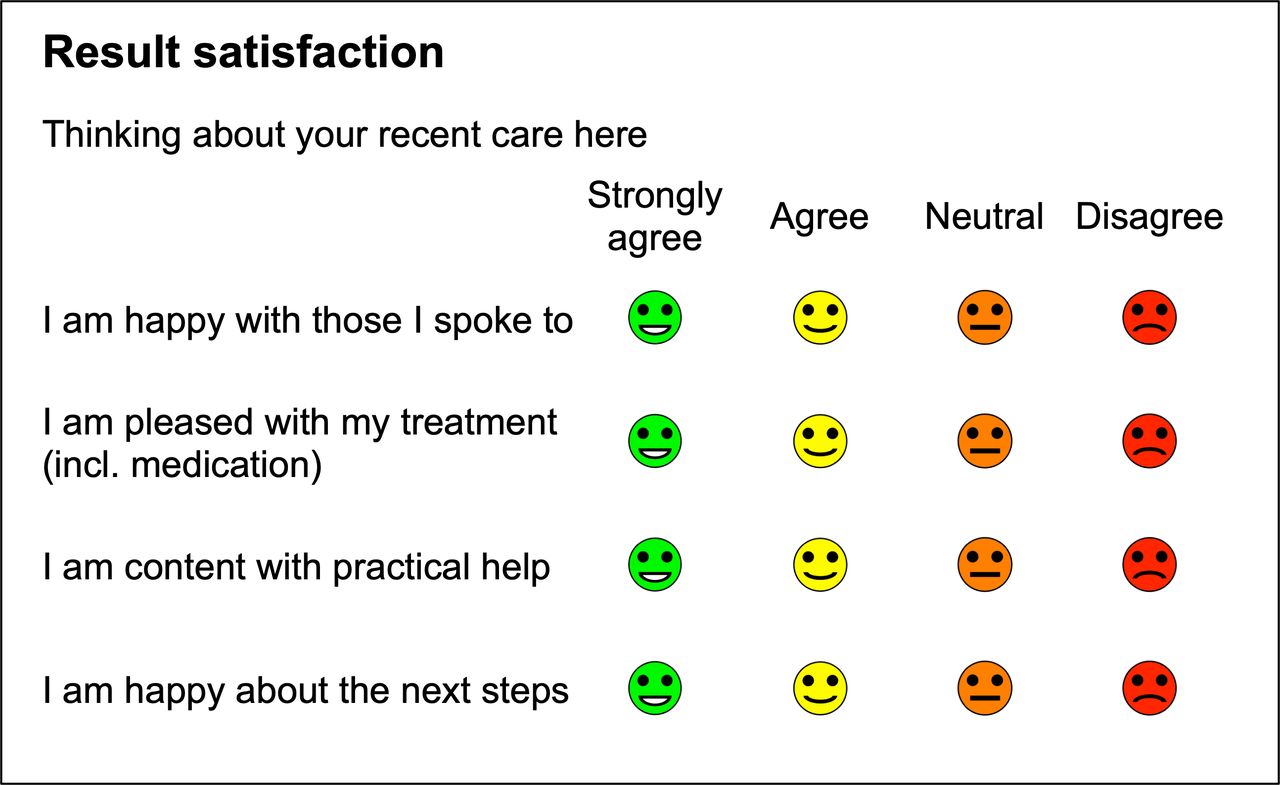
Result Satisfaction, or functional experience, covers the patient’s happiness, contentment and satisfaction with a specific session, stay or consultation. This measure was developed during 2022, and this is its first publication. It is designed for frequent routine use. The Result Satisfaction measure focuses on the patient’s perception of immediate results (outputs). The wording has been chosen to be apply to things which have happened, have been arranged or promised, as well as those those that have neither happened nor been promised.
The terms happy, pleased and content are often used synonymously but may have subtly different meanings. Happiness refers usually to immediate reactions, while pleased implies satisfaction and content refers to longer term expectation.
The order of questions goes from the past and specific, to the future and less specific.
We selected four dimensions for Result Satisfaction:
Consultation covers one-to-one face-to-face, video or telephone sessions with clinicians or provider staff. (‘I am happy with those I spoke to’).
Treatment covers all types of care, therapy and medication given, prescribed or changed. (‘I am pleased with my treatment (incl. medication)’).
Practical help covers arrangements made or promised, if any. (‘I am content with practical help’).
Plan covers future plans, tests and referrals, including doing nothing. (‘I am happy about the next steps’).
These questions should be used, for example, even when patients do not receive any treatment or medication, and when no special practical help has been arranged.
The format of the Result Satisfaction measure, showing the preamble, items and options is shown in figure 2.

Result satisfaction measure.
Service integration
When people living with multiple conditions are asked about their healthcare, they often say that they want better integration between different siloed services. They dislike having to repeat their stories time and again; they do not think different services share information well between them and they are surprised that some staff do not even know what other services do. Above all, they want healthcare services to work as if they were a single joined-up service, not as a set of independent fiefdoms.
Service integration is a core premise of patient-centred care, but conflicts with the traditional medical model, which favours specialty-specific silos. From early in their careers, doctors and nurses specialise in specific conditions and modes of treatment, leading to integration barriers.
Most PREMs focus on one hospital or service, not integration over the patient pathway and across services. This problem matters less when a patient only has one condition, treated by a single specialist. However, most money is spent on people living with multiple conditions and treatment has become more complex.
The Service Integration measure was developed around 2017 for routine use.9
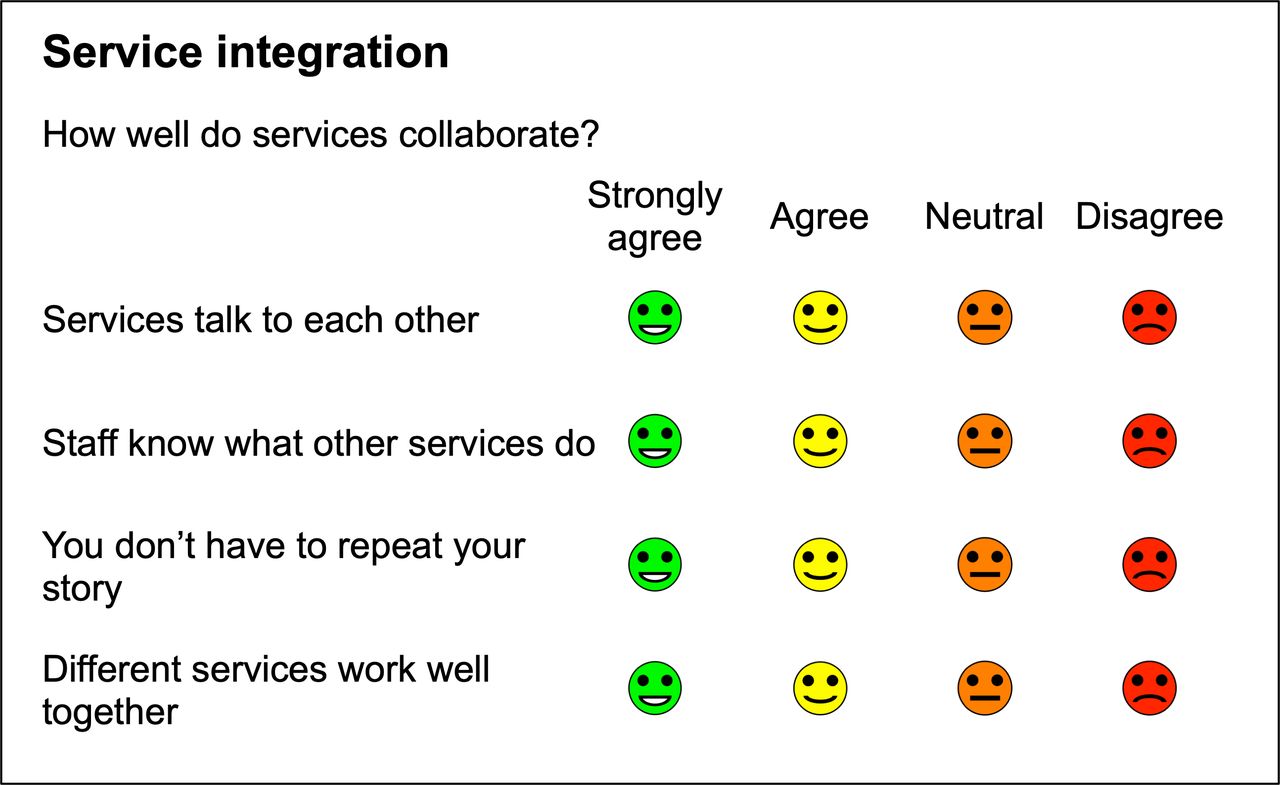
The four dimensions (figure 3) are:
Communication. How well services communicate. (‘Services talk to each other’).
Service knowledge. Patients’ perceptions of staff awareness of what other services do. (‘Staff know what other services do’).
Repetition. Whether patients need to repeat their stories endlessly. (‘You don’t have to repeat your story’).
Collaboration. How well different services work together as a team. (‘Different services work well together’).
Service integration measure.
The preamble is ’How well do services collaborate?’. The options are strongly agree, agree, neutral and disagree.
The scores obtained are often unexpectedly low, which provides further evidence that service integration is of real concern to patients.
Word count and readability
Table 1 shows the word count, FKG and reading age statistics for the Patient Experience, Result Satisfaction and Service Integration measures, together with those for three nationally used PREMs.
Word count and readability
The longer national measures, such as GPPS (General Practice Patient Survey) and HCAHPS (Hospital Consumer Assessment of Healthcare Providers and Systems), include data used for classification, such as setting, age group, gender, ethnicity, etc.
The FFT (National Health Service Friends and Family Test) was introduced in the NHS in England in 2013. More than 90 million responses have been collected. The FFT was originally based on the Net Promoter Score.15 Following criticism,16 it was revised substantially in 2019 and now has just one quantitative question and one or more free text questions.17 The text questions provide most of the value but need careful analysis.
The GPPS has been running since 2007. In 2022, the survey was sent to almost 2.5 million adults aged 16 years or over and registered with a GP practice in England. The survey had a national response rate of 29.1%, (down from 35.1% the previous year). It shows, for example, that patients find it harder to book GP appointments since COVID.18
HCAHPS is the nationally mandated survey of inpatient experience in the USA, which has been used since 2006. HCAHPS data are reported to the Centres of Medicare and Medicaid Services and directly impacts payments to hospitals. In March 2021, 4439 hospitals submitted results with 25% response rate.19
Discussion
The Patient Experience (howRwe), Result Satisfaction and Service Integration measures capture different aspects of the perception that people have of encounters with their care providers. They illustrate three different dimensions of patient experience, which can only be measured by asking patients themselves. Each measure has been designed for frequent routine use. They may be used together or independently.
Other publications distinguish between relational and functional experience,8 measured here by Patient Experience and Result Satisfaction, respectively, but, as far as we are aware, the relational, functional and integrated care aspects of patient experience have not been combined previously in a single set of short generic measures.
The Patient Experience (howRwe) measure has been widely used and shows that patients are generally well pleased with how they are treated by individual clinicians. The Result Satisfaction measure is new. The Service Integration measure has been less widely used than the Patient Experience measure, but notable differences have been identified between different services and localities.
Other measures address only one or two aspects of patient experience. Focus has been directed at patients’ perceptions of the different roles played by staff, such as doctors, nurses and admin staff. In our work, we do not usually draw these distinctions.
In mental health, self-reported patient satisfaction has been found to be reliable and valuable, but there is no consensus on a gold standard scale, its purpose, length or focus.20
These measures are quick and easy to use in different ways. The questions can be asked on-line, prompted by email or SMS text message with a URL, face-to-face, by telephone or on paper. Whatever method is used, it is essential to agree the workflow with all staff concerned. Most patients are happy to answer short surveys if they are asked nicely, but not otherwise. An agreed plan is required to set out who does what, when and where, including how the results will be used to improve quality.
National surveys
National surveys such as GPPS and HCAHPS can teach some important lessons. These surveys have been running since the 2000s, but response rates have declined over the years. The response rate of GPPS has fallen from 44% in 2007 to 29% in 2022, in spite of sending non-responders three full copies by post and three nudges by SMS text message. Response rates differed by patient age from under 20% for those aged less than 55 to about 60% for those aged over 65.21 On-line data collection accounted for under 41% of GPPS responses in 2022 (up from 37% in 2021).18 The digital divide is still a real issue for many patients.
HCAHPS response rates have fallen over the years from over 33% in 2007 to 25% in 2021. They vary from 17% (Washington DC) to 36% (Nebraska).22 There is evidence that high response rates are correlated with high satisfaction scores.23
Most national surveys are mandated centrally and are anonymous to protect privacy and confidentiality. It is not possible to identify individual patients or individual clinicians. They are used primarily for national, regional and local comparisons between providers. They do not directly affect the care provided at the individual level.
Coulter and colleagues have pointed out that while national patient experience data has been collected for many years, few providers systematically use this information to improve services. They conclude that it is unethical to ask patients to comment on their experiences if these comments will be ignored.24
Others have argued that existing approaches to measuring patient experiences are fragmented, duplicate effort, involve numerous requests for information and increase patient burden. They see patient experience as the starting point towards patient-centered care. They call for multistakeholder collaboration to deliver healthcare systems and interventions that are centred around and tailored to patient experience and help address patients’ priorities.25
Strengths and limitations
The strengths of Patient Experience, Result Satisfaction and Service Integration measures are that they are short, have a low reading age and a common format and scoring scheme. They can be used individually, together or in combination with other measures. Having four items in each measure, and twelve items overall, provides a level of granularity which helps managers improve services. More details can be provided in a free-text comment box.
These measures give managers the opportunity to track how they are doing, identify any areas of concern and take remedial action as early as possible. Their generic form allows different services to be compared using the same metrics. They can be used at all levels within a healthcare organisation.
Weaknesses are that the Results Satisfaction measure is new and the Service Integration measure is quite new, so they are not yet widely used. More work is required to test these measures in a range of operational situations.
Conclusions
This paper describes three generic patient-reported measures of Patient Experience, Result Satisfaction and Service Integration, which together cover relational, functional and integration aspects of patient experience. All three measures are generic and share a common format and scoring scheme. They are shorter and have a lower reading age than measures used in national surveys.
Ethics statements
Patient consent for publication
Footnotes
Twitter @timbenson
Contributors TB conceived and wrote the first draft of the paper. AB assisted in drafting and contributed to the design of the Result Satisfaction measure.
Funding The authors have not declared a specific grant for this research from any funding agency in the public, commercial or not-for-profit sectors.
Competing interests TB and AB are employees of R-Outcomes, which owns the copyright of the Patient Experience, Result Satisfaction and Service Integration measures.
Provenance and peer review Not commissioned; externally peer reviewed.