Article Text

Abstract
Background Recommendations for the diagnosis of pulmonary embolism are available for healthcare providers. Yet, real practice data show existing gaps in the translation of evidence-based recommendations. This is a study to assess the effect of a computerised decision support system (CDSS) with an enhanced design based on best practices in content and reasoning representation for the diagnosis of pulmonary embolism.
Design Randomised preclinical pilot study of paper-based clinical scenarios in the diagnosis of pulmonary embolism. Participants were clinicians (n=30) from three levels of experience: medical students, residents and physicians. Participants were randomised to two interventions for the diagnosis of pulmonary embolism: a didactic lecture versus a decision tree via a CDSS. The primary outcome of diagnostic pathway concordance (derived as a ratio of the number of correct diagnostic decision steps divided by the ideal number of diagnostic decision steps in diagnostic algorithms) was measured at baseline (five clinical scenarios) and after either intervention for a total of 10 clinical scenarios.
Results The mean of diagnostic pathway concordance improved in both study groups: baseline mean=0.73, post mean for the CDSS group=0.90 (p<0.001, 95% CI 0.10–0.24); baseline mean=0.71, post mean for didactic lecture group=0.85 (p<0.001, 95% CI 0.07–0.2). There was no statistically significant difference between the two study groups or between the three levels of participants.
Interpretation A computerised decision support system designed for both content and reasoning visualisation can improve clinicians’ diagnostic decision-making.
- clinical decision-making
- decision support, computerised
- diagnostic errors
- evidence-based practice
Data availability statement
All data relevant to the study are included in the article or uploaded as supplementary information.
This is an open access article distributed in accordance with the Creative Commons Attribution Non Commercial (CC BY-NC 4.0) license, which permits others to distribute, remix, adapt, build upon this work non-commercially, and license their derivative works on different terms, provided the original work is properly cited, appropriate credit is given, any changes made indicated, and the use is non-commercial. See: http://creativecommons.org/licenses/by-nc/4.0/.
Statistics from Altmetric.com
WHAT IS ALREADY KNOWN ON THIS TOPIC
Pulmonary embolism often presents a diagnostic challenge. This challenge is compounded by time pressure, ambiguous data and shortcuts in diagnostic clinical reasoning. A gap remains in physician adherence to diagnostic guidelines.
WHAT THIS STUDY ADDS
This randomised study of a computerised decision support tool with design aspects that used best practices of data visualisation and clinical reasoning support led to improved physician diagnostic performance in a preclinical setting.
HOW THIS STUDY MIGHT AFFECT RESEARCH, PRACTICE OR POLICY
Design of computerised diagnostic clinical decision support interventions should be based on rigorous methodology. This includes careful preclinical evaluations like this one prior to deployment in real care settings to objectively assess tool impact on physicians’ diagnostic reasoning and decision-making.
Introduction
Pulmonary embolism (PE) is a disease entity without specific clinical findings1 and its presentation offers a diagnostic challenge for physicians assessing patients with shortness of breath or chest pain. Several strategies and approaches have been suggested to increase the accuracy for the diagnosis of PE2–7 and for narrowing the gap between practice and evidence-based practice guidelines.8 Despite the efforts, literature9 suggests that a concerning 43% of patients suspected to have PE have received inappropriate diagnostic management. Furthermore, the threat of inappropriate diagnostic management overlaps the two dimensions of underestimating and overestimating the probability of PE. Underestimating this probability can be fatal,10–13 while an overestimation may lead to potential complications such as bleeding14 and ordering unnecessary tests with increased radiation exposure.15–17
Diagnostic decisions are often complicated by uncertainty, imperfect tests and potential harm for patients who are misdiagnosed. While the diagnostic performance of physicians has benefited from clinical decision support aids in a variety of situations18–21 and specifically for the prevention of deep venous thromboembolism22–24 and diagnosis of PE,25 effective design for decision support is lacking. Indeed, there is a gap between available design that has limited itself to content representation (eg, flow chart, pocket aid or applying a score in online tools) and what is expected of a design that takes in consideration knowledge constructs, heuristics and temporal constraints to support higher level analytical tasks.26 27 On this matter, clinicians rely on intuitive problem solving for decision-making most of the time by using heuristics that offer some advantages in terms of efficiency and resourcefulness.28 29 However, failures of such diagnostic strategies were shown by Tversky and Kahneman30 who studied, for example, the conjunction fallacy (giving a conjunction greater probability than either of the two components) in a PE decision task.30 31 Additionally, in another study, irrelevant anchors influenced the judgement of physicians who were tasked with estimating pretest probability for PE.32 From the above, there is a great need for decision support systems that extend their value to mitigate failures in clinical reasoning in addition to presenting knowledge and higher level cognitive tasks. In fact, while data and graphic design recommendations have demonstrated their potential benefit in different medical applications,33–36 a similar approach for design recommendations has yet to inform the design of interfaces for diagnostic decision support systems.
Computerised decision support systems need to achieve their potential to improve patient outcomes.21 Furthermore, there is a lack of understanding of what makes a system effective or not.37 From the above, unless design features of decision support systems extend beyond information display to encompass aspects of the reasoning processes and heuristics that may degrade in complex environments, then the full potential for cognitive support is at risk of failure by its own design limitations. The purpose of this preclinical study is to assess the performance of a computerised decision support system (CDSS) with a design that took into consideration a comprehensive approach to the visualisation of content, uncertainty sources and probabilistic reasoning in the diagnosis of PE.38 This body of work included a case study in medical reasoning that focused on delineating sources of uncertainties within a diagnostic task model while providing cognitive transparency of information structure and statistical frequencies to improve the user’s ability to compute a Bayesian solution for a conditional probability problem such as PE.38
In this randomised study of CDSS as compared with didactic lecture for PE diagnosis, we predicted that CDSS training would improve diagnostic performance on PE and that the effects would be similar to that of traditional teaching.
Methods
Setting
As part of a longitudinal programme of work conducted by the W21C initiative (W21C is a health systems research and innovation initiative based in the University of Calgary and the Calgary Zone of Alberta Health Services: www.w21c.org), we have undertaken a collaborative and multistep process with the Department of Computer Science (http://innovis.cpsc.ucalgary.ca/) for developing a computerised decision support system (CDSS) for the diagnosis of PE.27 38 Our study was deployed as a preclinical testing phase.
Patient and public involvement
No patients were involved in the design and conduct of this study.
Study population
We were interested in physicians in practice and in training who frequently encounter patients with suspected PE; therefore, emergency department and general internal medicine physicians were offered the opportunity to participate. In addition, we wanted to explore the possible effect of clinical experience; therefore, physicians in training (final year medical students and residents) completing internal medicine rotations were also invited to participate. Recruitment posters were displayed in relevant work locations with content including study objectives and research contact information.
Study design
We used a randomised design with two interventions. Participants in the first arm used a CDSS in the diagnosis of PE. Participants in the second arm used standard problem-solving approaches after receiving a didactic lecture about the diagnosis of PE.
A list randomising web resource (http://www.random.org/lists/) was used to generate five blocks of randomisation in each stratum of participants including (1) medical students from a large urban teaching hospital who completed one rotation in internal medicine; (2) first year subspecialty or internal medicine residents; and (3) practising physicians. Each stratum comprised 10 participants randomised to either the CDSS or didactic lecture in each block. The task of generating the blocks of randomisation was performed by a research assistant. The list for randomisation allocation was kept confidential from study investigators to ensure allocation concealment. Each individual participant completed baseline data and postintervention data in one single 90 min session. There was no follow-up data collection.
PE clinical scenario test cases
We developed 10 paper-based case scenarios of patients with suspected PE. The clinical plots for these scenarios were based on the authors’ prior clinical experience of similar presentations and reviewed with expert internists. The content of the scenarios did not include identifiable patient data and was limited to pertinent clinical information from history, physical examination, radiological and laboratory tests. The 10 cases contained a mix of probabilities for PE to include the three levels of simplified Wells scores of low, intermediate and high pretest probability for PE.39 All responses to requests by participants were predetermined and standardised including relevant test results. If a study participant requested additional data, the response was always that the requested information was unavailable. The 10 clinical scenarios were divided into two sets: scenarios 1–5 were baseline scenarios (1 high pretest, 1 low pretest, 3 intermediate pretest), while scenarios 6–10 (1 high pretest, 1 low pretest, 3 intermediate pretest) were reserved to be presented as new clinical scenarios after the intervention. Both study groups received baseline scenarios 1–5 prior to any intervention and were retested for the same baseline scenarios after either intervention, and then also with the new scenarios 6–10. All case scenarios, the algorithms of correct steps for each and the scoring script are available in the online supplemental appendix. Participants were handed the paper-based scenarios that included only the short clinical scripts, while the researcher had a different set of copies that included complete details of standardised responses and were used for scoring.
Supplemental material
Description of the two interventions
Participants randomised to the CDSS group completed five paper-based baseline clinical scenarios with a potential diagnosis of PE followed by a 20 min guided tutorial on the use of the CDSS for PE. This tutorial included time for participants to explore the user interface and become familiar with the CDSS. Knowing that externally derived explicit statistical probabilities may not actually be part of the natural decision-making process in clinicians who make experience-based decisions, the design of the PE CDSS provided multiple avenues of cognitive support. Users were able to enter responses by selecting and clicking on a set of options that covered the areas of stability of patient, contraindications, Wells score and test results.
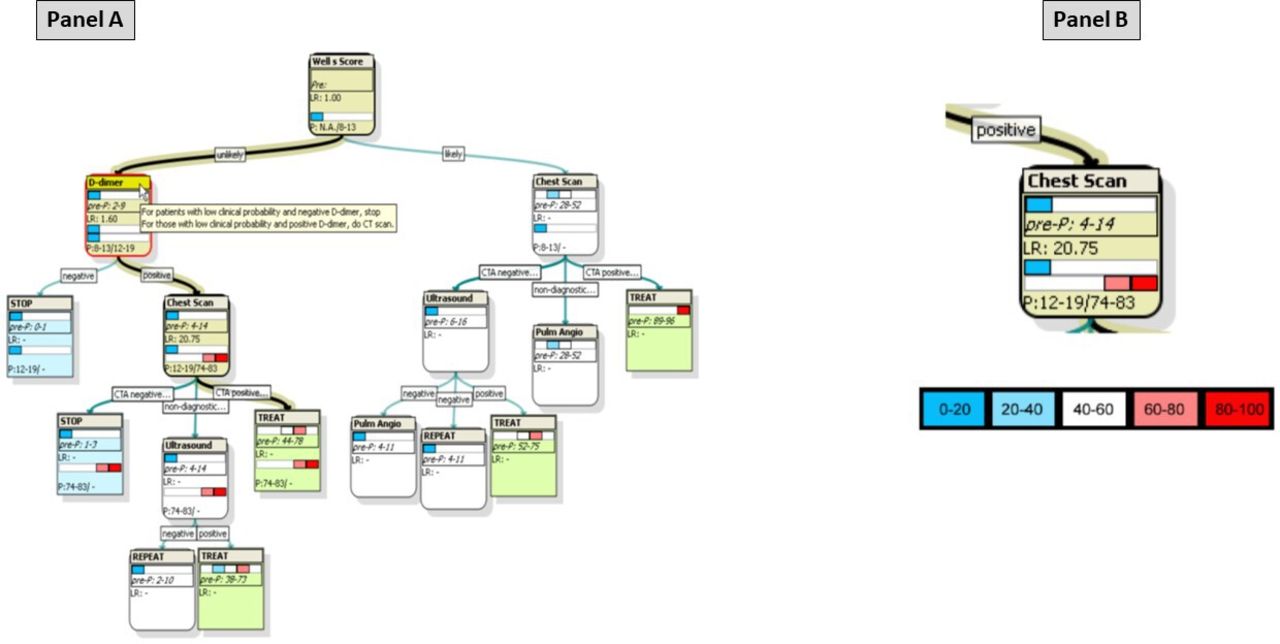
The CDSS provided automated calculations for changes in probability for PE (P) based on entries of test results and known likelihood ratios. The sequence of ideal diagnostic testing steps is also automatically highlighted. Figure 1 shows a screenshot of a black highlighted line and boxes for a case of low-moderate probability, abnormal D-dimer and positive imaging CT angiography ending with treatment recommendation in addition to a colour coding of the range of probabilities for PE (blue for lowest and red for highest). The current and most updated CDSS design is available for viewing at this weblink (https://project-b.researchcalgary.com/pe/assessment_tool/1024/).

Example visualisation provided by the computerised decision support system for pulmonary embolism (PE). Panel (A) shows a bolded and highlighted line that guides through the displayed pretest and post-test probabilities and suggestions depending on the sequence and result of diagnostic tests. Panel (B) shows the range of the probability metre represented in different colours (blue as low and red as high) and the final decision tree node in this example of a case of Wells score unlikely for PE, positive D-dimer and positive CTA. The pretest probability for PE when applying the Wells score is 8%–13%, and this value changed to 12%–19% with a positive D-dimer (LR+D-dimer=1.6; 95% CI 1.4–1.8). As recommended on the decision tree, CTA was done; the result was positive for PE, yielding a final post probability of 74%–83% (LR+CTA=20.75; 95% CI 13.29–28.96).3 CTA, CT angiography; LR, likelihood ratio; P, probability.
Following the tutorial on use of the CDSS, participants were asked to solve 10 clinical scenarios with the potential diagnosis of PE. The 10 clinical scenarios included the same five baseline scenarios solved prior to the intervention as well as five new case scenarios.
The same general procedure was followed by participants randomised to the didactic lecture group; however, instead of a tutorial about the CDSS, they were presented with a didactic PowerPoint lecture about the diagnosis of PE. This didactic lecture emphasised the algorithmic sequencing of diagnostic studies, with clinical pretest probabilities preceding imaging decisions.
Study outcomes
The primary outcome was concordance with evidence-based diagnostic pathways for PE.3 This was operationalised by the determination of the proportion of correct steps taken by a participant (numerator) divided by the total correct diagnostic steps that quantify the algorithmic decision-making process (denominator). This proportion for the correct decision-making process was derived for each of the 10 scenarios in accordance with recommended diagnostic algorithms for PE from the Prospective Investigation of Pulmonary Embolism Diagnosis (PIOPED) II study.3 This validation cohort study replicated earlier findings from PIOPED I,40 affirming that a priori estimation of the probability of PE remains crucial when combined in a diagnostic algorithm that includes D-dimer testing and imaging with multidetector CT pulmonary angiography or ventilation-perfusion scanning. The scoring method followed a modified format of the script concordance test41 42 with the correct script being based on the aforementioned algorithmic diagnostic pathways.3 Diagnostic pathway concordance was measured as the mean of proportions of tests ordered correctly for each of baseline scenarios 1–5, for each of scenarios 1–5 after the intervention and for each of scenarios 6–10 after the intervention. The score of this outcome ranges from 0 to 1, with 1.0 being the maximum achievable proportion.
The secondary outcome was the number of incorrect decisions taken by each participant on the same algorithmic diagnostic pathways. This secondary outcome provides complementary information to the primary outcome described above, and it was calculated to provide and analyse the effects of interventions using a more direct approach in keeping with the way people think about their performance and as an indirect association with risks involved in overestimating or underestimating presence of PE. This measurement is not merely the inverse of the proportions of correct sequence of decisions (because it is an unbounded count of incorrect steps, and not a proportional value ranging from 0 to 1 for diagnostic pathway concordance, as defined earlier). Rather, the number of incorrect decisions was calculated for a participant by counting the number of D-dimer blood tests, CT imaging studies and leg ultrasound tests that were done unnecessarily or not requested when they should have been. This count of incorrect decisions in individual cases was then summarised across cases by adding the total number of incorrect decisions across cases in the numerator and dividing by the total number of case scenarios. The score of this outcome was calculated as the average of number of incorrect decision steps taken per case scenario for baseline scenarios 1–5, post measure scenarios 1–5, post measure scenarios 6–10 and post measure scenarios 1–10.
Statistical analysis
The outcomes of diagnostic pathway concordance and numbers of incorrect diagnostic steps taken were analysed according to the intention-to-treat principle. The mean scores comparing the baseline measure and post measures were assessed by using t-test for paired data.
The comparison between the two intervention groups (CDSS vs didactic lecture) and mean scores of outcomes per the three levels of participants was analysed using one-way analysis of variance.
A p value of 0.05 was used for determination of statistical significance. A power calculation was not done a priori as the overall goal of this study was to conduct a preclinical pilot empirical assessment of this reasoning visualisation CDSS and to identify point estimates and CIs for groups to power a larger evaluative study. Further, the distributional characteristics of our outcome measures (diagnostic pathway concordance ranging from 0 to 1, and incorrect steps as an unbounded count) were not known a priori to inform a power calculation. STATA software for Windows (V.11.2) was used for analyses.
Results
Participant enrolment
The study flow chart is presented in figure 2. Overall, 48 candidates were assessed for eligibility, of whom 18 were excluded for not meeting inclusion criteria and 30 were randomised to either the CDSS or the didactic lecture. Table 1 shows the baseline characteristics of participants in both groups according to sex, age and level of experience. The data were collected completely from all participants within their assigned randomisation groups.

The study flow diagram. CDSS, computerised decision support system.
Demographic characteristics of study participants
Diagnostic pathway concordance
Figure 3 shows that there was a statistically significant improvement in mean diagnostic pathway concordance for scenarios 1–5 (figure 3A) when compared with baseline measures of the same scenarios in the decision support group (baseline measure=0.73, post measure=0.90, 95% CI 0.10–0.24, p=0.0001) and in the didactic lecture group (baseline measure=0.71, post measure=0.85, 95% CI 0.07–0.20, p=0.0002,).
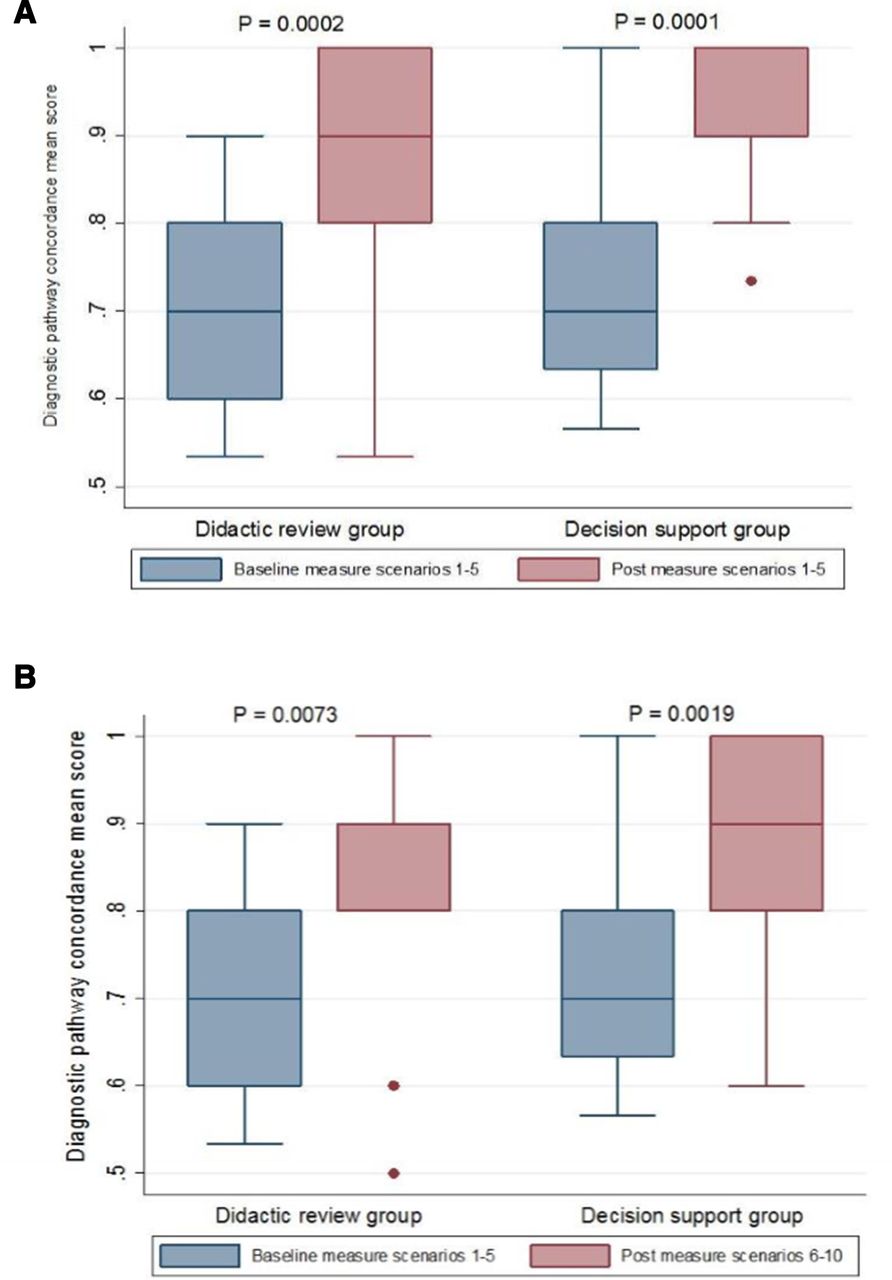
Diagnostic concordance scores. Box plots of scores for scenarios 1–5 (A) and scenarios 6–10 (B).
There was also a statistically significant improvement in pathway concordance when comparing the baseline measure for scenarios 1–5 with the postintervention comparison to scenarios 6–10 in the decision support group (baseline mean=0.73, post measure=0.89, 95% CI 0.10–0.24, p=0.0019), as well as in the didactic lecture group (baseline measure=0.71, post measure=0.84, 95% CI 0.03–0.23, p=0.0073) (figure 3B).
As for the level of experience of participants, analysis of the mean diagnostic pathway concordance did not show a statistically significant variation across experience levels of students versus residents versus staff, except for postintervention measures of scenarios 1–5 with students achieving the highest mean score of 0.98 in the CDSS group (p=0.04).
Number of incorrect decision steps
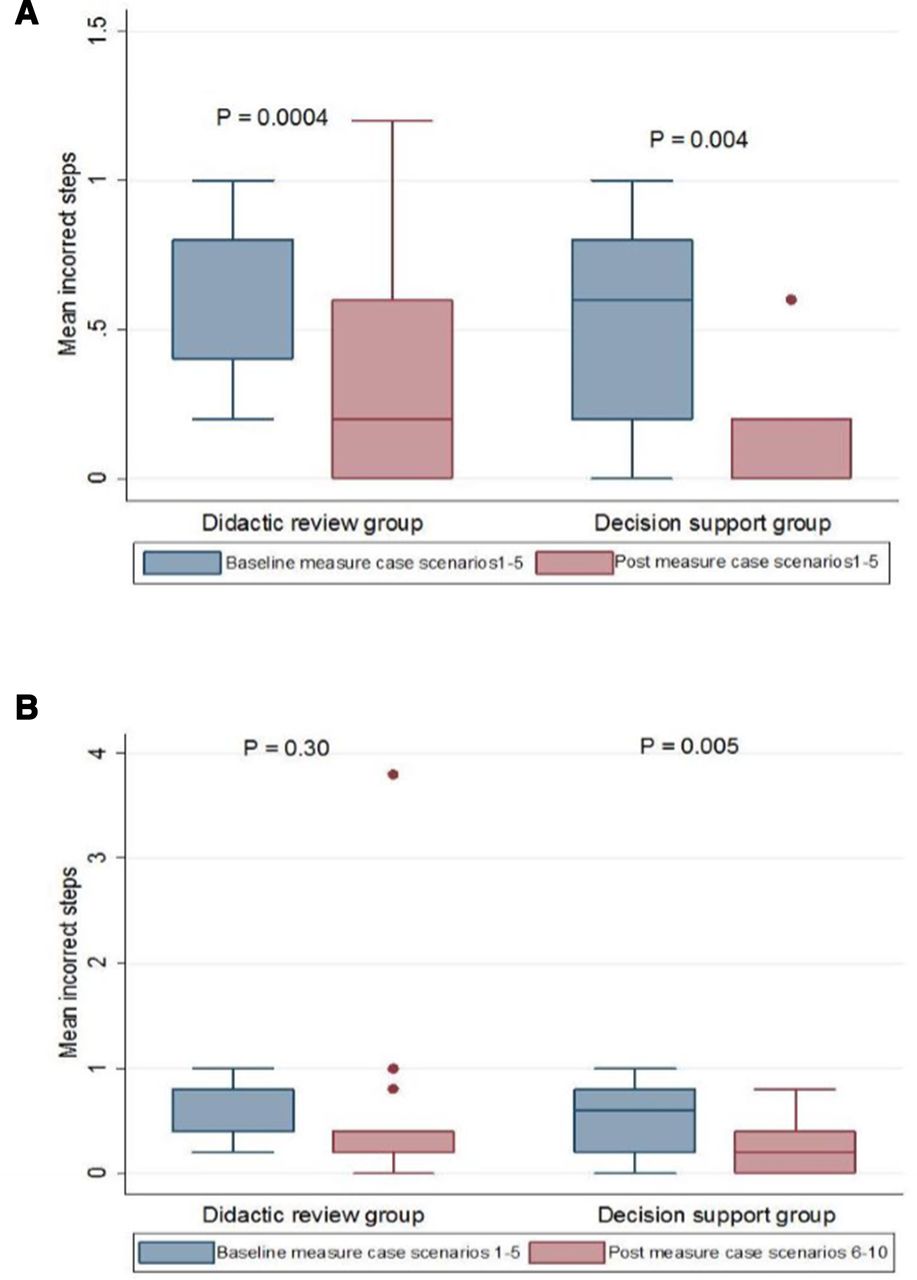
Figure 4 shows that there was a corresponding statistically significant decrease in the number of incorrect steps for scenarios 1–5 (figure 4A) when compared with baseline measures of the same scenarios in the decision support group (baseline measure=0.56, post measure=0.21, 95% CI 0.08–0.47, p=0.004) and in the didactic lecture group (baseline measure=0.64, post measure=0.37, 95% CI 0.16–0.49, p=0.0004).
Incorrect step scores. Box plots of scores for scenarios 1–5 (A) and scenarios 6–10 (B).
Comparing the baseline measure for scenarios 1–5 with postintervention measure of scenarios 6–10 showed a statistically significant decrease in the number of incorrect steps only in the decision support group (baseline measure=0.56, post measure=0.21, 95% CI 0.09–0.57, p=0.005). There was no statistically significant improvement in the didactic lecture group (baseline measure=0.64, post measure=0.53, 95% CI 0.39 - 0.63, p=0.30) as shown in figure 4B.
When comparing the two groups for this outcome, the between-group difference in numbers of incorrect steps taken for postintervention assessment of scenarios 1–10 approached statistical significance with a p value of 0.07. Table 2 shows that the CDSS group demonstrated a larger and sustained improvement in the number of incorrect steps taken for all postintervention measures.
Comparison between groups for outcomes of diagnostic pathway concordance and incorrect steps at baseline, after interventions and for differences between preassessments and postassessments
Discussion
In this pilot study, we describe the performance of a CDSS with a design that is based on data visualisation principles and cognitive bias avoidance strategies for the diagnosis of PE. The improvement in diagnostic adherence associated with this CDSS is at a minimum comparable to that produced by a didactic lecture delivered to participants minutes before undertaking a diagnostic exercise with clinical scenarios. To the extent that delivery of such a didactic lecture is not logistically practical in a real-world and just-in-time context of clinical case solving, the CDSS impact is both notable and promising for future clinical deployment. Furthermore, a CDSS should present a well-structured information model which identifies evidence-based relationships that remains reliable despite temporal constraints while allowing for explicit retrieval of crisp information and dynamic re-examination of assumptions.27 In addition to the above, the suboptimal baseline diagnostic pathway concordance results demonstrate that physician performance in PE diagnosis continues to fall short. This finding mirrors that of other studies9 and its clinical implications can include increased costs, the risk from unnecessary tests and potential harm to patients from missed diagnosis or unneeded treatment when PE diagnosis is incorrectly made.
As described earlier, the role of clinical decision support aids has been recognised to improve physician performance.18 19 Further, positive effects have been demonstrated in the specific domains of preventing or diagnosing venous thromboembolism. A study by Durieux and colleagues demonstrated that the implementation of clinical guidelines for venous thromboembolism prophylaxis through a computer-based clinical decision support system changed physician behaviour and improved compliance with guidelines in an orthopaedic surgery hospital setting.23 This observation was later emphasised in a review of literature on the implementation and effectiveness of computer-based prescriptions of appropriate prophylaxis for the reductions in venous thromboembolism events.24 In addition to the above, other studies demonstrated the value of CDSS for improving the yield of diagnostic tests including CT pulmonary angiography for PE despite challenges in physicians’ uptake and integration into clinical workflow.43–45 The clinical diagnosis of venous thromboembolic events, meanwhile, remains a challenging process because of the urgency of the potentially lethal clinical condition, time pressures in emergency room settings, the complexity of patients and presentations, as well as the presence of several cognitive biases that may trap the reasoning and mislead interpretation of results of diagnostic tests such as base rate neglect, playing the odds and posterior probability biases.46 Similarly, PE is one disease presentation where effective therapy is available but the task of differentiating this diagnosis from other possibilities remains inherently challenging with risks of underestimation or testing unnecessarily.
This study demonstrates the reality that passive dissemination of evidence-based guidelines does not result in appropriate adherence in practice. Indeed, the physicians tested here demonstrated considerable deviation at baseline from guidelines in their diagnostic approaches to PE clinical scenarios. Fortunately, though, both the CDSS and didactic lecture interventions demonstrated that healthcare providers with different levels of experience could still show a significant improvement in diagnostic approach when presented with or reminded about an evidence-based PE diagnostic approach.
There are caveats and limitations to our study. First, the study was not informed by an a priori power calculation for reasons stated in the Methods section. Post hoc, however, we see that the study had significant power for pre-post within-participant comparisons of diagnostic performance, for which we indeed found very significant changes in both pathway concordance and incorrect steps. Second, the use of paper-based simulation may not reflect the realism of the actual work environment with its inherent stresses, pressures and timelines. In addition to the above, this testing environment limits the ability to replicate a more realistic simulation in which multiple observations in the clinical setting help inform clinical impressions and ensuing actions. Knowing that the challenges of the clinical setting may produce different emotional and cognitive loads, with unpredictable effects on how physicians perceive the choice and necessity of available diagnostic tests, we realise that an evaluation of performance of this CDSS in real clinical setting is warranted and such tool testing in a real clinical environment is now underway.
Our study’s strengths include having participants at different levels of experience, and a range of simulated clinical cases that mimic the broad spectrum of patient presentations with suspected PE. The positive performance of this PE CDSS has provided critical feedback in this preclinical evaluation to assure that users in the healthcare domain will likely be helped by this proposed solution. Indeed, such validation is one key step to gathering feedback in visualisation design studies of real-world problems by real users.47 Specifically, this positive performance confirms successful cognitive task analysis of PE diagnosis and the design of an interactive solution for the purpose of externalising Bayesian reasoning and circumventing internal uncertainty.27 38 Furthermore, our evaluation of this CDSS for PE focused on the appropriateness of clinically relevant diagnostic steps that target the full diagnostic pathway of PE and compared it with baseline measures for both interventions rather than being limited to the use or non-use of a CDSS.
In summary, we found that this CDSS for the diagnosis of PE improved the diagnostic performance of healthcare providers at different levels of experience. Its benefits to decision-making were at a minimum comparable to that of a didactic lecture provided to physicians just before the presentation of diagnostic case scenarios. Future studies are needed to test its performance in clinical settings where the CDSS is integrated with computer-based physician ordering systems. Such a study would allow this CDSS to be compared with other decision support strategies in addition to understanding the operational challenges of embedding evidence-based decision support strategies into busy clinical environments.
Data availability statement
All data relevant to the study are included in the article or uploaded as supplementary information.
Ethics statements
Patient consent for publication
Ethics approval
This study involves human participants and was approved by the University of Calgary Conjoint Health Research Ethics Board (Ethics ID: E-23231). Participants gave informed consent to participate in the study before taking part.
References
Supplementary materials
Supplementary Data
This web only file has been produced by the BMJ Publishing Group from an electronic file supplied by the author(s) and has not been edited for content.
Footnotes
Contributors GA and WAG conceived and planned the study idea. TZ and SC provided conceptual support from computer sciences. WF, BH and KM contributed to review of study design and outcomes. GA carried out the simulations and experiments. GA took the lead in writing the manuscript. All authors provided critical feedback and commented on the manuscript. GA is the author acting as guarantor.
Funding The W21C programme receives funding from the Government of Alberta, Alberta Innovates Health Solutions and the Government of Canada (through Western Economic Diversification).
Competing interests None declared.
Patient and public involvement Patients and/or the public were not involved in the design, or conduct, or reporting, or dissemination plans of this research.
Provenance and peer review Not commissioned; externally peer reviewed.
Supplemental material This content has been supplied by the author(s). It has not been vetted by BMJ Publishing Group Limited (BMJ) and may not have been peer-reviewed. Any opinions or recommendations discussed are solely those of the author(s) and are not endorsed by BMJ. BMJ disclaims all liability and responsibility arising from any reliance placed on the content. Where the content includes any translated material, BMJ does not warrant the accuracy and reliability of the translations (including but not limited to local regulations, clinical guidelines, terminology, drug names and drug dosages), and is not responsible for any error and/or omissions arising from translation and adaptation or otherwise.