Article Text

Abstract
Prolonged wait times in healthcare are a complex issue that can negatively impact both clients and staff. Longer wait times are often caused by a number of factors such as overly complicated scheduling, inefficient use of resources, extraneous processes, and misalignment of supply and demand. Growing evidence suggests a correlation between wait times and client satisfaction. This relationship, however, is complex. Some research suggests that client satisfaction with wait times may be improved with interventions that enhance the waiting experience and not actual wait times. This project aimed to improve the average daily rating of the client waiting experience by 1 point on a 7-point Likert scale.
A quality improvement study was conducted to analyse client satisfaction with wait times and enhance clients’ satisfaction while waiting. Quality improvement methods, mainly co-design sessions, were used to co-create and implement an intervention to improve clients’ experience with waiting in the clinic.
The project resulted in the implementation of a whiteboard intervention in the clinic to inform clients where they are in the queue. The whiteboard also included static data summarising the average wait times from the previous month. Both aspects of the whiteboard were designed to allow patients to better approximate their wait times. Though the quantitative analysis did not reveal a 1-point improvement on a 7-point Likert scale, the feedback from staff and clients was positive. Since implementation, clinic staff and management have developed the intervention into a high-fidelity digital board that is still in use today. Furthermore, the use of the intervention has been extended locally, with additional ambulatory clinics at the hospital planning to use the set-up in their clinic waiting rooms.
- waiting lists
- time-to-treatment
- patient satisfaction
- healthcare quality improvement
- quality improvement methodologies
Data availability statement
Data are available upon reasonable request. All data relevant to the study are included in the article or uploaded as supplemental information. De-identified participant data are available from Andrea Waddell (https://orcid.org/0000-0003-1155-6015) and are not available for reuse.
This is an open access article distributed in accordance with the Creative Commons Attribution Non Commercial (CC BY-NC 4.0) license, which permits others to distribute, remix, adapt, build upon this work non-commercially, and license their derivative works on different terms, provided the original work is properly cited, appropriate credit is given, any changes made indicated, and the use is non-commercial. See: http://creativecommons.org/licenses/by-nc/4.0/.
Statistics from Altmetric.com
- waiting lists
- time-to-treatment
- patient satisfaction
- healthcare quality improvement
- quality improvement methodologies
WHAT IS ALREADY KNOWN ON THIS TOPIC
The relationship between healthcare service wait times and client satisfaction is complex and may be affected by several factors including the actual amount of time spent waiting and the experience while waiting.
Due to the complexity of the problem, improving the client waiting experience requires creative and innovative interventions. Co-design and quality improvement methods are combined in this study to improve client satisfaction with prolonged wait times.
WHAT THIS STUDY ADDS
To our knowledge, this is the first study that combines human-centred design and quality improvement methodologies to improve the client waiting experience in a mental health service.
This study uses end user feedback to develop, test and implement an intervention to improve client satisfaction with waiting.
This study outlines how to engage end users in the design and iteration processes.
HOW THIS STUDY MIGHT AFFECT RESEARCH, PRACTICE OR POLICY
This study provides a solution for clients who are dissatisfied with prolonged wait times and a practical approach to using co-design with clients and providers.
Problem
In healthcare, wait times are a complex issue with negative impacts on both clients and staff.1–3 An outpatient mental health clinic at a Toronto psychiatric hospital uses a first-come, first-serve drop-in model to provide clients with low-barrier access to mental health services. One consequence of this type of service delivery model is prolonged wait times as the demand is always significantly greater than the supply. Internal data collected from this clinic between October 2020 and March 2021 indicate that, on average, 47% of clients wait longer than 1 hour from the time of registration to the initial clinician assessment. The project team conducted a current state analysis to determine the impact of prolonged wait times. This included a review of client satisfaction data from a 2018 and 2019 survey (n=64), in which prolonged wait times were the most mentioned complaint with 41.9% of the 31 negative comments from clients referencing wait times. The amount of time spent waiting can directly affect client satisfaction. The clients’ experience while waiting, however, and not the actual amount of time spent waiting can also affect their overall satisfaction.4–6 Therefore, there is a clear need to improve the client waiting experience at this clinic.
Background
Prolonged wait times can be attributed to multiple factors, including but not limited to overly complicated scheduling, inefficient use of resources, extraneous processes, and misalignment of supply and demand.2 7–9 The relationship between wait times and client satisfaction is equally as complex. There is evidence to support the correlation between the actual amount of time spent waiting and client satisfaction.2 10–12 Clients become dissatisfied with their wait times when the actual wait time exceeds the expected wait time.10 Spechbach et al10 found that, for a typical emergency department visit, clients think a 60-minute wait is acceptable. Another study focusing on ambulatory clinics noted that client satisfaction scores steadily decreased with the amount of time spent waiting.11
A growing body of literature indicates that clients’ satisfaction with waiting may be improved through interventions that address other aspects of the waiting experience rather than the actual wait time.4–6 A study by Xie and Or5 noted that client satisfaction with wait times could be improved with interventions such as a change in atmosphere, additional education and increased staff empathy. Chu et al4 found that three simple interventions improved clients’ experience with waiting in an outpatient clinic. These interventions were: informing clients about delays, apologising for delays and providing options for distractions.4 Therefore, it is also possible to improve clients’ satisfaction with waiting by improving their waiting experience.
This clinic is a drop-in service that frequently calls capacity early in the afternoon due to the large volume of clients. As the number of clients requiring services often exceeds the current supply, a significant reduction in wait times may not be possible or sustainable long term. Given this information and the evidence in the literature, our aim focused on improving the client waiting experience, not the actual amount of time spent waiting. The aim of this project was:
To improve the average daily rating of the client waiting experience by 1 point on a 7-point Likert scale by June, 30th, 2021.
To tackle this complex problem, the project team protocolised an approach that incorporated experience-based co-design to create an intervention that was meaningful to both staff and clients.
Measurement
Four quantitative metrics were used to monitor change over time to evaluate the effectiveness of the intervention. The project team collected each measurement 2 weeks prior to, and continuously throughout each of the three Plan–Do–Study–Act (PDSA) cycles. PDSA cycles are a well-established and effective quality improvement methodology that enables rapid, methodical and iterative implementation of small-scale changes to realise improvement.13 14 In addition to these quantitative metrics, the project team regularly collected feedback from staff through informal observations of implementation, attending staff meetings and semi-structured interviews.
Client satisfaction survey
A client satisfaction survey was used to evaluate the average rating of the client waiting experience. Client satisfaction was measured using a survey consisting of a four-question, 7-point Likert scale asking clients to rate various aspects of their experience and the ability for free text in the fifth question (see online supplemental appendix 1). The project team developed a Likert scale survey based on the project’s needs and specific to this clinic. The daily average satisfaction score from each client survey response was plotted on a run chart and monitored for any change in client satisfaction.
Supplemental material
Workload: NASA task load survey
The NASA task load survey (NASA TLX), a questionnaire used to measure workload and to operationalise mental demand, physical demand, temporal demand, performance and frustration level (see online supplemental appendix 2), was used as a balancing measure to monitor any change in staff workload due to the intervention. Measuring staff workload was important in ensuring that the intervention was sustainable and did not contribute or lead to staff burnout. The survey was distributed to all clinic staff three times per week. The raw average index score of each question in the survey and the raw total average index score for the survey responses each day were plotted on a run chart.
Wait time inquiries
Wait time inquiries refer to the number of times clients inquired about any aspect of their wait time with the administrative staff. This is assumed to capture some dissatisfaction with the wait time experience as well as staff workload. Each occurrence was recorded as one client inquiry by the administrative staff. The intervention aimed to provide clients with more information about their wait time; therefore, it was anticipated that the number of inquiries would decrease with successful intervention.
Left without being seen
Clients who experience prolonged wait times are at a higher risk of leaving without being seen; therefore, the number of clients who experienced this was captured.3 Additionally, clients who leave without being seen are presumed to be highly dissatisfied with their wait time. The number of clients who left without being seen (LWBS) was collected daily and illustrated using a run chart.
Design
Design thinking and co-design methodologies were used to co-develop the final intervention with clinic clients and staff. Using interviews, journey mapping, co-design sessions and low-fidelity prototyping, the project team developed the intervention in collaboration with these key stakeholders. Client interviews (n=10) were conducted to uncover the root cause of client dissatisfaction15 with wait times (see online supplemental appendix 3 for interview guide). Affinity diagramming, as described by Nunnally and Farkas,16 is a qualitative thematic analysis method that involves identifying and grouping key themes. Using this method, the project team identified several key themes from our interview transcripts (see online supplemental appendix 4 for summary of the key themes), which were then used to create a journey map of the client waiting experience (see online supplemental appendix 5). The project team used human-centred design methods adapted from guidebooks written by IDEO and IBM15 17 to facilitate two 2-hour virtual co-design sessions (see online supplemental appendix 6) using Zoom and Miro, a collaborative whiteboard program. Six participants attended each session. Participants included one physician, one nurse, one social worker, one administrative staff and one client from the clinic as well as the authors’ client advisor.
The project team hosted an orientation session for the clients involved in the co-design sessions to ensure they were informed about the project and comfortable with the virtual platforms. This orientation session was also used as an opportunity to validate the journey map. Additionally, the project team created and distributed orientation materials including a Zoom guide, a co-design 101 resource, a Miro tutorial and a Miro ‘practice’ board for participants to familiarise themselves with the platform prior to the session (online supplemental appendix 7).
During the first co-design session, participants were introduced to the journey map created by the project team informed by a persona, ‘Tania the Tired Patient’. Participants then reviewed the journey map and identified the most important challenges that Tania experienced while waiting. Participants agreed that the lack of information provided to clients regarding wait times was the most prominent issue. The final activity of session one surmounted in the development of a needs statement:
The client (Tania) needs a way to know approximately how long she will be waiting so that she can plan her day and reduce her anxiety.
In the second co-design session, participants engaged in creative brainstorming to come up with ideas that addressed this needs statement. Ideas were then discussed further and eventually voted on based on impact and feasibility. The top two ideas both involved a client-facing whiteboard with a corresponding ticket system. Therefore, it was decided these ideas should be further explored as an intervention.
Following the co-design sessions, the initial intervention was further developed and refined prior to implementation by the project team. This was done using a low-fidelity prototype (see online supplemental appendix 8) that was reviewed by staff who provided feedback.
Patient involvement
A client advisor was a key member of the advisory board and was recruited through the organisation’s patient partner programme. The client advisor had experience with outpatient services at the organisation but no explicit encounters with the clinic where the project took place. As a member of the advisory board, the client advisor provided feedback on the study design, recruitment methods and methodology. Clients were involved in the study through interview questions to determine the current state, and in the co-design sessions used to develop the solution. The clients who participated in the interviews and in the co-design sessions were provided with the results if requested.
Strategy
The project team completed three PDSA test cycles to test and refine our intervention.
PDSA cycle 1
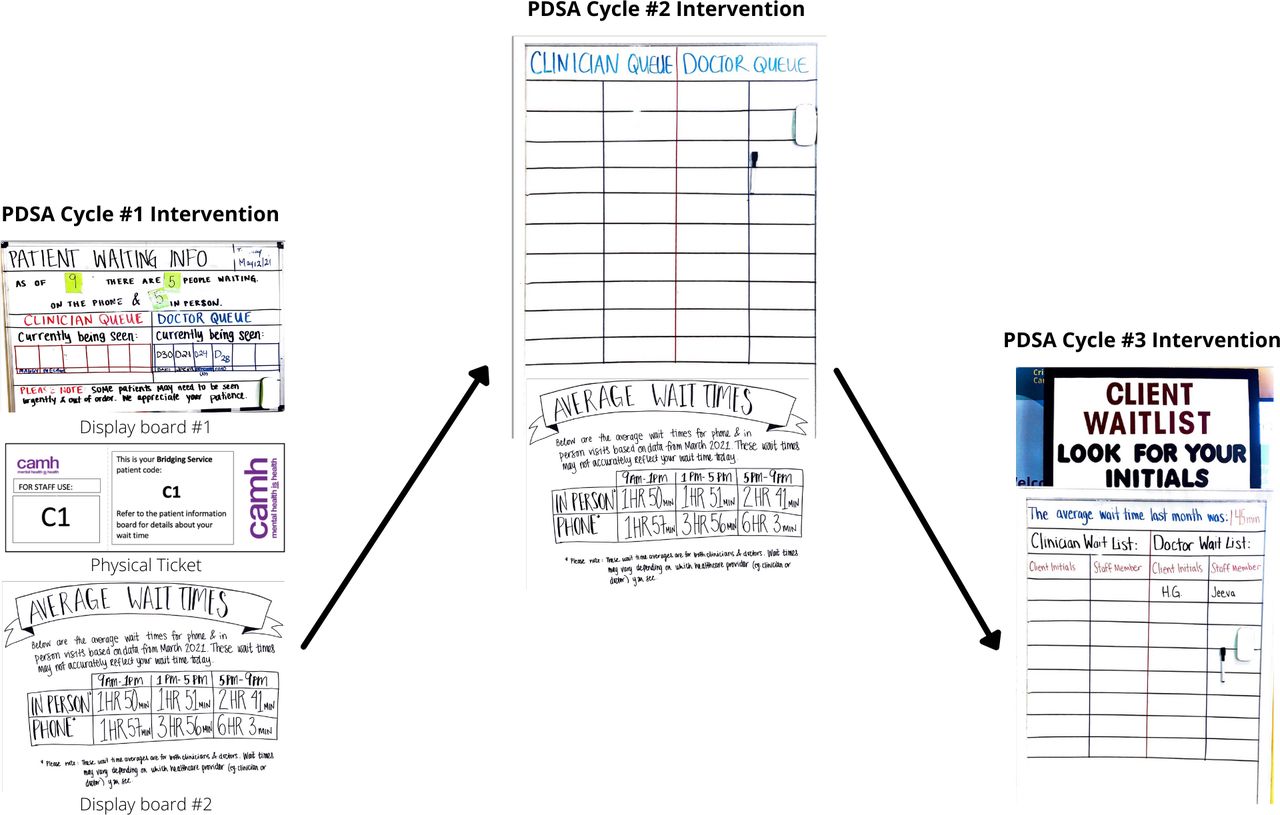
Our initial prototype was to have two display boards. The first was a whiteboard accompanied by a ticketing system. The client was given a ticket number and when they were being seen, their ticket number was written on the whiteboard. This was intended to inform other clients how many people were ahead of them. The second was a wait time poster that summarised the average wait times for in-person and phone visits from the previous month (figure 1). The project team saw no positive or negative change in our quantitative data analysis. Feedback from staff indicated the whiteboard caused a significant increase in their workload. Furthermore, clients found the whiteboard confusing and did not notice the wait time poster.

PDSA cycles.
PDSA cycle 2
For this iteration, the project team used a whiteboard on wheels, to help decrease the associated workload. To simplify the process, the project team replaced the ticketing system with a list of client initials on the whiteboard. When a new person registered, their initials were added to the whiteboard at the bottom of the list. The project team hypothesised that the purpose of the whiteboard would be easier to understand if unnecessary information was removed from the whiteboard. Therefore, the project team kept only the list of client initials on the whiteboard and removed all other information. Lastly, the project team made the wait time poster more visible by adding a colourful border and changing the location it was displayed. Again, the project team saw no positive or negative change in our quantitative data analysis. Staff reported the whiteboard was much simpler to use. Clients remained unaware of the wait time poster and were not aware the whiteboard on wheels was intended for them.
PDSA cycle 3
Signage and heading titles were added to the whiteboard on wheels to indicate to clients the purpose of the whiteboard. The wait time poster was eliminated, and the average wait time was added to the whiteboard instead. Although the project team still saw no change in the quantitative analysis, the project team did see some promising trends (see the Results section for details). Staff reported that clients were more aware of the whiteboard, and they continued to use the whiteboard after the project was completed.
Results
Our primary outcome measure of interest was the average daily rating of the client waiting experience. For 9 weeks, this measurement was collected using the Client Satisfaction Survey (described above) and the resulting data were plotted on a run chart. No shifts, runs or trends were detected. There was likely minimal change due to external factors affecting satisfaction such as the actual amount of time spent waiting, the level of care provided by the healthcare professionals and the amount of information they received about their treatment.2 11 12 However, the project team did observe a slight—but promising—uptick in the average daily rating after PDSA cycle 3, most obvious in the question ‘I am satisfied with the information I received about waiting’ (see figure 2). The project team hypothesised that this may have become a trend with longer duration of data collection in the intervention period.

Run charts.
Staff expressed that the intervention caused an increase in their workload in PDSA cycle 1. However, this was not reflected in the results of the NASA TLX survey (see online supplemental appendix 9). A trend towards decreased workload was observed; however, this was most likely due to external factors such as decreased patient volumes. The wait time inquiries run chart also did not show any shifts, trends or runs. However, due to the collection method of this metric, large amounts of data were missing, suggesting these results are unreliable. The last measurement, clients who LWBS, showed a shift after PDSA cycle 3 indicating an increase in the number of clients who LWBS (see online supplemental appendix 9). This result could be viewed negatively, as clients are leaving the clinic prior to receiving necessary mental healthcare. Alternatively, this result could indicate clients are more informed about their wait time and therefore can make more autonomous and informed decisions about their healthcare.18
Despite our varied quantitative results, the project team received positive staff feedback, especially following PDSA cycle 3. Feedback was gathered informally at staff meetings and through observation by the project team. At the time of project completion, the clinic was left with a medium-fidelity whiteboard. Since then, the clinic staff and management have further developed the intervention into a high-fidelity digital board that is still in use (see figure 3). The mere fact that the staff are not only still using the whiteboard but have also dedicated time to further iterate on it is a testament to its usefulness in the clinic. There has been spread of the intervention locally with other ambulatory clinics at the hospital preparing to use the set-up in their clinic waiting areas.

Digital whiteboard.
Lessons and limitations
When beginning the research project, the project team thoroughly explored the complicated problem of wait times within the setting of a mental health drop-in clinic. Ultimately, we decided to focus our project on improving client satisfaction with wait times instead of reducing the actual wait times itself—a limitation of our project. This approach was chosen as our background research indicated that wait times for mental health services are largely a systems-level issue outside the scope of a 1-year project. This clinic serves as a temporary mental health solution while patients find appropriate treatment in their community. Addressing this problem requires exploration of the volume and distribution of mental health resources on a larger organisational and provincial level.
Client and staff engagement was a clear strength of this project. The team met often and early with the client engagement team to get their perspective and input. A client advisor was engaged to inform the study design, client consent form and client interviews. The project also used well-attended co-design sessions with clients and staff to co-create an intervention that addressed the clinic’s specific needs. It should be noted that co-design is a resource-intensive activity as it requires several staff to be available and therefore may not be feasible for all research. The project team believes co-creating the intervention with participants strengthened the contextual relevance and is largely responsible for the successful intervention implementation.19
The final intervention evolved substantially from the initial intervention that was piloted in PDSA cycle 1. This highlighted an important lesson in the value of low-fidelity prototyping during the PDSA process. Our interventions for PDSA cycle 1 were created with inexpensive and easily adaptable materials such as a whiteboard, magnets, poster board and markers. Had the project team created our initial intervention with more expensive or permanent materials, it would have been much more difficult to implement the feedback the project team was given. Using low-fidelity prototypes ensured feedback could be integrated with each iteration, resulting in a more useful and meaningful final product.
Our largest limitation was with respect to our data collection which impacted the quality and accuracy of our results. Due to the COVID-19 pandemic, the project team was not always able to attend the clinic in person to complete data collection. Additionally, the busy nature of the clinic meant that the administrative and clinic staff had limited capacity to assist us. Specifically, the number of client satisfaction surveys collected at baseline was small (n=6). Although the number collected throughout the project increased, this small baseline amount may have impacted our results. It might have been possible to avoid this with a longer baseline data period or by altering our collection method from the beginning. Similarly, longer data collection during the PDSA cycles may have resulted in clearer quantitative trends. Additionally, the number of client satisfaction surveys collected each day was highly variable (0–6). This meant that a single poor rating would greatly impact the average daily rating if that day had a low yield. Our minimal quantitative results taught us a key lesson in the importance of feedback. This lack of quantitative data forced us to focus on informal feedback from the staff, which was incredibly useful and successful in informing the iterations of our intervention. The sustainability of our final intervention demonstrates the value of imploring feedback in the PDSA cycle process.
Conclusion
The amount of time spent waiting can directly affect patients’ satisfaction with waiting.2 10–12 However, in situations where demand is greater than the supply and prolonged wait times are unavoidable, specific strategies aimed at improving patients’ satisfaction with waiting have proven successful.4 5 10 This project demonstrates a practical approach to using co-design methodologies and quality improvement principles to create targeted solutions to prolonged wait times at a Toronto-based drop-in mental health clinic. While there were no positive or negative changes reflected in the quantitative data, feedback from patients and staff was positive. With respect to the quantitative data, different survey methodologies such as a binary scale, as opposed to a Likert scale, may have been more effective. Furthermore, the amount of data we were able to obtain was limited. When working on projects in this space in the future, more thought should be given to the potential burden of data collection on staff.
To ensure the sustainability of the intervention, the team took a two-pronged approach. First, end users were involved with its creation from initial inception through to testing. This increased the amount of buy-in from staff when implementing the intervention. Second, our goal was to create an intervention that became the new way of working, rather than something added on top of routine clinical care. By including the end user and ensuring that the intervention became part of the standard work, the intervention has remained sustainable. This has been demonstrated through the continued use and independent development of the whiteboard by clinic staff (as seen in figure 3). Advancements in technology tools, such as digital registration, digital wait time trackers and online scheduling, are becoming more widely available in healthcare settings, although there is an implementation lag when compared with corporate industries. Studies have shown that digital wait time boards correlate with improved patient waiting experience and can benefit the patient.6 This project provides further evidence for the use of wait time boards to improve patient and staff satisfaction with the waiting experience.
Data availability statement
Data are available upon reasonable request. All data relevant to the study are included in the article or uploaded as supplemental information. De-identified participant data are available from Andrea Waddell (https://orcid.org/0000-0003-1155-6015) and are not available for reuse.
Ethics statements
Patient consent for publication
Ethics approval
This study involves human participants and was approved through the Centre for Addictions and Mental Health (CAMH) Quality Improvement Ethical Review (QPER) process (no reference number or ID given). Participants gave informed consent to participate in the study before taking part.
Acknowledgments
The project team would like to thank their programme advisor, Dr Joseph Ferenbok, and the Advisory Board for their thoughtful insights. Advisory Board members included: Ms Donna Alexander, social worker, SAPACCY Clinic, CAMH; adjunct lecturer, Factor-Inwentash School of Social Work, University of Toronto. Ms Grace Collins, client advisor. Professor Christine Shea, lecturer and programme director, Quality Improvement and Patient Safety (QIPS), Institute of Health Policy, Management and Evaluation (IHPME), University of Toronto. Professor Olivier St-Cyr, assistant professor and UXD Concentration Liaison, Faculty of Information, University of Toronto.
Supplementary materials
Supplementary Data
This web only file has been produced by the BMJ Publishing Group from an electronic file supplied by the author(s) and has not been edited for content.
Footnotes
MD, KE, ZF and A-MV are joint first authors.
MD, KE, ZF and A-MV contributed equally.
Contributors AEW supervised the entire project, monitored and provided guidance for data collection and analysis (including co-design sessions) and revised the ethics protocol and the paper. She is the guarantor. MD created data collection tools, facilitated patient interviews, conducted qualitative thematic analysis, co-facilitated co-design session #1 and drafted and revised the paper. MD also organised all advisory board meetings. KE led the literature review and ethics submission. KE facilitated participant interviews, conducted qualitative thematic analysis, co-facilitated co-design session #1, did all PDSA quantitative data analyses and drafted and revised the paper. ZF was responsible for participant recruitment, conducted qualitative thematic analysis, co-facilitated co-design session #2, led persona and journey map creation, completed data collection and PDSA cycle #1 intervention implementation, and drafted and revised the paper. A-MV led wait time quantitative analysis, facilitated participant interviews, co-facilitated co-design session #2, conducted qualitative thematic analysis, completed data collection and PDSA cycle #2 intervention implementation, and drafted and revised the paper. Joseph Ferenbok attended regular meetings to provide guidance and mentorship regarding the direction of the project and revised the paper. Donna Alexander, Grace Collins, Christine Shea and Olivier St-Cyr attended monthly advisory board meetings to provide guidance and revised the paper.
Funding The authors have not declared a specific grant for this research from any funding agency in the public, commercial or not-for-profit sectors.
Competing interests None declared.
Patient and public involvement Patients and/or the public were involved in the design, or conduct, or reporting, or dissemination plans of this research. Refer to the Methods section for further details.
Provenance and peer review Not commissioned; externally peer reviewed.
Supplemental material This content has been supplied by the author(s). It has not been vetted by BMJ Publishing Group Limited (BMJ) and may not have been peer-reviewed. Any opinions or recommendations discussed are solely those of the author(s) and are not endorsed by BMJ. BMJ disclaims all liability and responsibility arising from any reliance placed on the content. Where the content includes any translated material, BMJ does not warrant the accuracy and reliability of the translations (including but not limited to local regulations, clinical guidelines, terminology, drug names and drug dosages), and is not responsible for any error and/or omissions arising from translation and adaptation or otherwise.