Article Text

Abstract
Aims and objectives This study sets out to describe benefits from the implementation of electronic observation charting in intensive care units (ICU). This was an extension to the existing hospital wide digital health system. We evaluated error reduction, time-savings and the costs associated with conversion from paper to digital records. The world health emergency of COVID-19 placed extraordinary strain on ICU and staff opinion was evaluated to test how well the electronic system performed.
Methods A clinically led project group working directly with programmers developed an electronic patient record for intensive care. Data error rates, time to add data and to make calculations were studied before and after the introduction of electronic charts. User feedback was sought pre and post go-live (during the COVID-19 pandemic) and financial implications were calculated by the hospital finance teams.
Results Error rates equating to 219 000/year were avoided by conversion to electronic charts. Time saved was the equivalent of a nursing shift each day. Recurrent cost savings per year were estimated to be £257k. Staff were overwhelmingly positive about electronic charts in ICU, even during a health pandemic and despite redeployment into intensive care where they were using the electronic charts for the first time.
Discussion Electronic ICU charts have been successfully introduced into our institution with benefits in terms of patient safety through error reduction and improved care through release of nursing time. Costs have been reduced. Staff feel supported by the digital system and report it to be helpful even during redeployment and in the unfamiliar environment of intensive care.
- Critical care
- Electronic Health Records
- Evaluation methodology
Data availability statement
All data relevant to the study are included in the article or uploaded as online supplemental information.
This is an open access article distributed in accordance with the Creative Commons Attribution Non Commercial (CC BY-NC 4.0) license, which permits others to distribute, remix, adapt, build upon this work non-commercially, and license their derivative works on different terms, provided the original work is properly cited, appropriate credit is given, any changes made indicated, and the use is non-commercial. See: http://creativecommons.org/licenses/by-nc/4.0/.
Statistics from Altmetric.com
WHAT IS ALREADY KNOWN ON THIS TOPIC
Hospitals in England are being encouraged to move to electronic health records including in intensive care unit.
WHAT THIS STUDY ADDS
Digital records with user codesign as part of wider electronic health record can reduce error, save time and are well received by clinicians.
HOW THIS STUDY MIGHT AFFECT RESEARCH, PRACTICE OR POLICY
There is very little evidence about whether this policy reduces patient harm, saves money and is acceptable to clinical staff.
Introduction
Many health providers in the UK are moving towards electronic health records (EHRs) or already use them. Secondary care providers are less likely to have EHR than primary care providers, the majority of whom have been using electronic records for 15–20 years.1 Electronic prescribing has been reported to reduce patient harm2–5 and benefits have been shown for EHR in terms of patient safety,6 including in critical care7 and in cost savings.6 8–10 In intensive care units (ICUs), complexity of care means that it has been difficult to provide an effective EHR, which does not overburden clinicians with data entry, and simultaneously provides comprehensive data collection and effective clinical decision support (CDS).
The EHR within our organisation, Prescribing, Information and Communication System (PICS) has been built by a dedicated team of programmers11 and is clinician led. PICS is used hospital-wide, for medication order entry and drug administration, recording of admissions, diagnoses and procedures, ordering and viewing of diagnostic tests, and nursing assessments. It supports a complex CDS rules engine. Within our hospital, a large, urban UK teaching hospital which has 100 ICU beds, we set out to build elements into the existing EHR so that the majority of remaining ICU documentation was electronic and fully integrated. We tested staff acceptance including if the complex digital charts supported staff during the COVID-19 pandemic, where many staff were redeployed, and therefore, unfamiliar with ICU.
Objectives
To study the benefits realised when implementing integrated electronic charts in intensive care in terms of patient safety, the quality of care and financial savings and understand staff acceptance including during periods of high pressure on staff.
Methods
Software design
There is a clear design framework on which the EHR is built in our institution, which follows an iterative development model. A clinically led project group was formed and had executive leadership.
The electronic ICU chart was built in June 2016 on the basis of the following principles: all the calculations would be done by the software where feasible; as much data would be dropdown values rather than free text where possible; where repetitive values were entered, the software would add the last values as the new number was likely to be similar; the user interface allowed a range of tools to easily change these numbers (mouse scroll; up/down arrows); maximum and minimum values would guide users to limit errors and empty or unfilled values would prompt users to complete the chart.
The screen display was configurable on a patient level basis such that sections could be moved to be next to each other where relevant (figure 1A). This could, for example, mean that for a cardiac patient on ICU, the sections for cardiac observations and drug infusions could be manipulated to be adjacent, whereas for a neurology patient neuro-observations and sedation scores could be moved together to the top of the chart.

ICU trolley and chart. (A) A section of the ICU electronic chart. This has been scrolled down to the fluids and ventilation sections. There are a set of buttons at A which if you click on them you are taken to the corresponding section(s) on the main screen (B), you can also rearrange the order of the sections at a which then reorders the main screen sections (B). (b) the ICU chart open on a computer and ICU trolley. (c) the ICU chart being used by an ICU nurse. ICU, intensive care unit.
Implementation
The finished software underwent our standard testing and change control process. A first pilot was run in two beds in ICU for 48 hours with six ICU nurses participating. A second pilot involved 16 nurses over 60 hours. Paper and electronic charts were run simultaneously. Feedback from pilots evoked several changes built into the software with a further change control cycle and subsequent full roll out across all 100 beds. Continuous feedback throughout and after roll out was reviewed by the project group; this led to a few immediate minor changes within the system and also to a number of improvements being scheduled for future phases of the ICU chart development.
Hardware
A total of 120 large, 32-inch screens and associated Dell computers, each with infection control keyboard, mouse and barcode scanner were purchased using capital investment provided by National Health Service England’s Safer Hospitals, Safer Wards funding stream. Each bed space in ICU had its own dedicated hardware (see figure 1B and C).
WIFI was already present across the ICU but this was improved prior to rollout. Network points were also enabled so each bed space computer could be hard-wired.
Benefits realisation
Error
We identified level 3 ICU patients who had a minimum of 4 and a maximum of 14 infusions. Two investigators studied charts over a 5–10 days periods identifying errors in calculating drug infusions.
Time-saving
A number of live and simulated observations were timed using two independent researchers. To ascertain how long it took nurses to prepare a new daily chart. Using paper charts, nurses must prepare a new chart each 24 hours. They copy demographic data into the chart and copy across the last sets of observations, fluid balance and infusions. They also copy the sites of lines, diagnoses and all other persistent information recorded on the paper charts. We looked at the average number of infusions across patients who were and were not highly dependent. Highly dependent, ‘level 3’ patients required advanced respiratory support alone, or basic respiratory support together with support of at least two organ systems. This level includes all complex patients requiring support for multiorgan failure.12 We then asked a team of nurses to create 10 of these ‘average’ charts and timed how long it took (in comparison, no time was required for this preparation within the electronic environment as the chart is continuous from day to day. A new patient admitted to ICU has a chart automatically generated by the system as the doctors admit the patient to the unit, and no data entry is needed by the nurse in the bed-space. Each subsequent day in ICU, the chart is continuous and no copying of information from the previous 24 hours is needed).
Two researchers watched nurses in the ICU both prior to and after the roll out of the electronic charts. Calculation of the time it took for nurses to input a set of observations was dependent on both the time taken to do the observations and for data entry. Interruptions to this process are frequent, because of clinical care and other demands on the nurse.
In simulated studies, researchers created a 10-hour scenario with changing observations, ventilation modes and syringe rates and charted observations on both paper and on the electronic chart. Different coloured pens were used on paper for blood pressure, oxygen saturations, etc and arterial blood gases, charted 3 hourly. We collected how long it took to calculate input and output volumes in the paper chart. We took an ‘average’ real patient and asked three nurse users to calculate the fluid balance for nasogastric, drug infusions, intravenous drug dosage and urine output for 10 calculations (see table 1).
Timing of task before and after institution of electronic intensive care charts
We created a paper chart for an ‘average’ level 3 ICU patient requiring 8 volume calculations for nasogastric feed, four drug infusions, intermittent intravenous drug dosage and urine output. Timings were taken for three nurses to perform these hourly and to calculate cumulative totals each hour for 10 hours.
Two independent researchers watched ward clerks filing old versions of the ICU charts and associated paperwork into patient files. If seven or more paper charts were already filed in the paper notes then a new folder would be created which also necessitated creation of a record within the patient administration system, a separate electronic system which records the administrative elements of a patients’ admission and is the basis of mandatory hospital reporting.
User feedback
Throughout the project, there was wide stakeholder engagement and users were encouraged to make suggestions and contributions to the project. Anonymous questionnaires were gathered before roll out (from 88 nurses, 22 doctors, 7 allied health professionals (AHPs)). We then reran the same questionnaires 2 years after roll out during the COVID-19 pandemic to understand if the software performed as expected to aid clinicians during crisis work periods (68 nurses, 40 doctors, 10 AHPs and 5 other; 49% of respondents were redeployed, that is they did not usually work in ICU) (online supplemental Appendix 1). Paper questionnaires were left in bed spaces and on doctors workstations to complete and a box located centrally in the ICU for surveys to be returned into.
Supplemental material
In order to calculate how long research study data took to extract from ICU, study teams were asked after the introduction of paper charts how they viewed the introduction as part of a wider feedback exercise to understand impact on wider teams. They were asked if they could find patients for studies more quickly, if they spent more or less time in the ICU, and by how much for each patient, and whether they viewed the change to electronic charts as a positive or negative development. These teams are small, comprising less than five members. The same methodology applied for people looking into complaints.
Financial balance
Costs of buying paper charts and storing notes were ascertained from hospital finance systems. The capital costs of the hardware, and ongoing costs to the organisation of hardware upkeep, software updates and day-to-day running were estimated on the basis of ongoing known costs and money spent on the project.
Patient and public involvement
This is a clinical system for doctors and nurses and AHPs; these are the end users and stakeholders. Patients were not involved in this study directly but would benefit from improved patients safety. Users were informed of the study and any publications will be shared directly with staff.
Results
Reduction in error (the difference between paper and electronic charts for calculation error)
The error rate in paper fluid balance (number of errors/number of fluid balance calculations recorded per day) on paper charts was 5.7/day in the first patient (over 10 days, comprising 240 hourly columns, approximately 10 calculations per hour); 8/day in the second patient (5 days, 120 hourly columns) and 13.4/day in the third patient (5 days, 120 hourly columns). There were a variety of errors made, commonly numbers were misread, a one was often misread for a seven, and eight and zeros were also interchanged. Errors were often seen at handover times or when one nurse had written a set of observations for a colleague, although people did also misread their own handwriting. Calculation errors were frequent; for example, where the difference between two values was calculated and the answer was either nine or eleven, while rounding up people often rounded down or vice versa. Values were often added with extra zeros and subsequent calculations were therefore out by a factor of 10. Electronic error rate for calculations in this study is assumed to be zero for the errors calculated, as misreading of numbers, and errors of addition and subtraction are negated by electronic calculation.
For each patient, nurses calculate a series of fluid balance additions and subtractions each hour (see figure 2) adding drugs, fluids and feed in, and urine, stool, vomit and aspiration out. These comprise at least 10 calculations each hour; 240 each day. For 100 patients over 365 days, approximately 8.75 million calculations are undertaken in ICU charts each year in our institution. Therefore, by using EHR between 6 and 14 data errors per patient per day were prevented, equating to 219 000 avoided errors per annum in fluid balance alone.
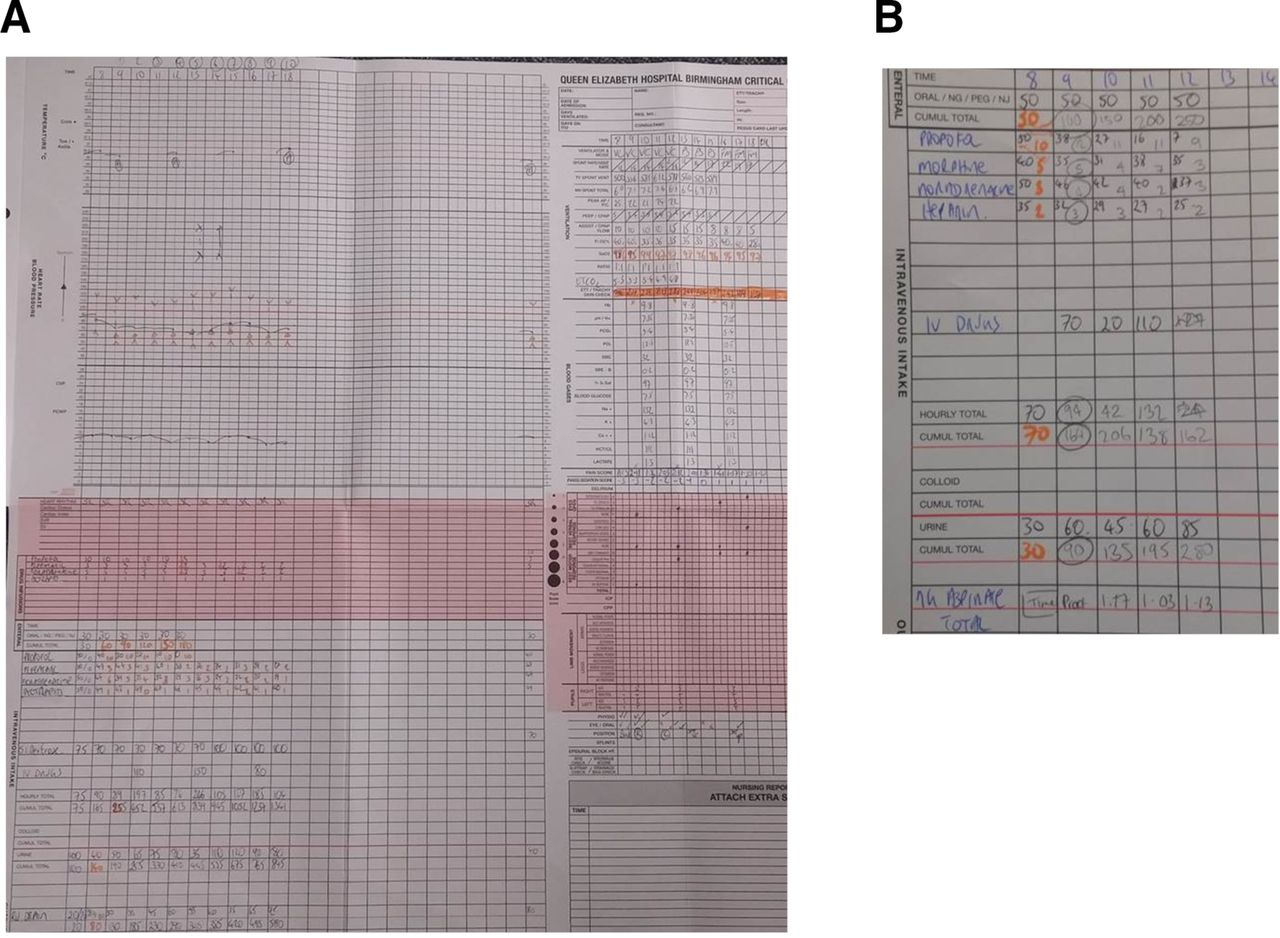
Paper charts and calculations in the intensive care unit before electronic chart roll out. (A) The A0 paper charts that a nurse had to create each morning which carried across the last set of observations from the previous chart and all observations from that day are to be added. not shown is the back of this chart. Information for heart rate, blood pressure and temperature was drawn on, so a visual display of any changes could easily be seen. (B) Some of the calculations which were needed to be calculated manually.
Time-saving
The uninterrupted time taken for a nurse to prepare an ICU chart was on average 11 min 16 s (table 1). We observed in real-time nurses preparing these charts and they were continuously interrupted by a need for clinical care, nurse handover or consultant ward rounds. This meant that in six observations, time to completing preparation of the new chart varied between 12 and 40 min (average 26 min). Time to prepare a new electronic chart is 0 min.
Time taken to enter a set of observations (temperature, heart rate, diastolic and systolic blood pressure, oxygen saturation, respiratory rate, confusion and pain scores) in the electronic chart compared with paper was comparable with a slight time-saving in the electronic environment. Arterial blood gas results were automatically uploaded in the electronic environment negating the need for manual entry. Average time to calculate input and output volumes on the paper chart was 56.7 s. These are generally calculated each hour, and sometimes more frequently. This again was an absolute time-saving.
In total nursing time saved was on average 44 min per patient per day on daily tasks (see table 1 for average time-savings). In our 100 bedded ICU the time saved (4400 min, 73 hours), therefore, equates six 12-hour nursing shifts each day.
Ward clerks spend between 5 and 15 min per patient per day filing old paper charts. For 100 patients this represents a time-saving of 8–25 hours as there is no filing required for electronic charts.
In discussing with staff who investigated complaints or issues raised by patients, the average time taken to look through the paper notes varied greatly. Notes and files often took some time to locate and in some instances were missing. From request to delivery of paper notes varied from 48 hours to several weeks. The staff chasing these notes reported delays in many parts of the pathway; even when notes had been located; it would still take weeks to obtain them. The charts post go-live were available instantly to the investigating teams, and these included nursing assessments and nursing/physiotherapy notes and medical notes transforming the investigation team’s experience.
Research teams reported that they could find eligible patients quickly and time in ICU was reduced from 40 to 20 min.
Financial balance
Costs savings fall into two primary categories: paper and staff time efficiencies. ICU chart paper savings (creation and storage) are projected to save £30k/year; staff savings are estimated at £3.5k/bed/year based on the blended hourly rates of band 2 ward clerks, band 5 and band 6 nurses with unsociable hours premia. The annual savings estimate is £257k, thus deducting hardware maintenance, replacement and support costs (£85k/year) the net recurrent savings per year are estimated at £172k (£2600 per bed per year) (table 2). On this basis, the project has a payback period of 4.7 years. It should be noted, however, that the staff savings are not cash releasing (table 2).
Cost balance for electronic charts
Project success, perceptions and user feedback
The software was well received (figure 3). Doctors, nurses and AHPs were already using the EHR in part and therefore trusted its high availability and speed, and were used to the layout of the application. They were also familiar with the benefits of the application in terms of legibility and remote availability.

Responses to staff surveys the figure shows staff responses to a questionnaire before roll out, at 2 months and at 6 months (for full questionnaire, see online supplemental Appendix 1). Each panel shows the responses of nurses, doctors and AHPs. Green bars indicate agreement with the statement, red disagreement and grey where users did not know. Ninety-one nurses, 20 doctors, 13 AHPs and 5 with other roles answered the questionnaire before roll out; 68 nurses, 40 doctors, 10 AHP and 5 other roles completed the survey 2 years after roll out during the COVID-19 healthcare crisis, 49% of these staff members were redeployed, with many doctors working in nursing roles. AHPs, allied health professionals; ICU, intensive care unit.
Modifications that were made to the system in response to immediate feedback were broadly divided into functionality changes and hardware requirements. As with all human systems, work-arounds were developed early and we were aware that these would become embedded if not identified. Examples of functionality changes included addition of rows to flowsheets, and widening previous value ranges.
Hardware issues also arose. The keyboard, chosen for infection control purposes was not well received. Users felt that this was difficult to type with as the keys were not raised, and that the infection control friendly mice were difficult to use due the lack of a mouse scroll wheel. Replacement of hardware in a rolling programme addressed these issues.
Feedback during the pilot was positive. Nurses who worked in the pilot were not specifically selected to work with the electronic chart; it fell to whichever nurses were rostered into the bed space that the chart was deployed. Of the nurses who used the chart in the pilot phase all agreed it was useful, user-friendly and should be deployed across the whole of ICU.
In staff surveys (figure 3, online supplemental Appendix 1), a majority of staff (70% nurses, 90% doctors) were convinced that the introduction of electronic charts was a good idea but only 50% of nurses were looking forward to their introduction. Half of nurses, and most doctors and AHPs thought that electronic charts would help in performing their job. Nurses were not convinced that the charts would improve patient care or safety, and half of nurses surveyed thought that data entry would be slower. In all staff groups the majority of people thought that the charts would improve error.
In surveys conducted 2 years later during the global COVID-19 pandemic, more than 90% of staff thought the electronic charts were a good idea and helped in their job roles. In all groups more than 80% of respondents thought that the charts improved patient safety and patient care. Most respondents also thought that data entry was quicker. Interestingly nurses thought that error rates were reduced, but a minority of doctors and AHPs answered ‘I don’t know’ to this question, presumably as there has never been published data to demonstrate error reduction.
Discussion
Error
Arguably the most important benefit associated with patient records is the positive impact on patient safety, and this is what drives the majority of programmes in healthcare in the UK. Error during calculation of volumes, rates and values is high on paper and this is known from both the prescribing literature13–15 and from previous studies in intensive care settings.7 We demonstrated a high error rate in our own paper charts, there is heterogeneity in the error rates and in order to establish the precise rate a larger study would be needed, however, even by the most conservative estimates, the error rate remains high. Although most of these are trivial if, for example, 1 in every 10 000 errors was significant, the technology would stop 1 significant error every 3 weeks. Humans are not routinely good at obsessive checking but computers are.
EHR does not completely remove error, as calculations within it are dependent on correct data entry and well-built rules, but by introducing pragmatic limits, users can be warned when unlikely values are entered. Calculations can also evoke algorithms which detect patterns of deteriorating physiology deployed in early warning scores.16–18
Time
Data entry is sometimes said to be slower in electronic environments but this was not substantiated here. For some values, we used automatic download of data, as with arterial blood gases, so that these no longer needed to be manually entered. Calculation of volumes and values is laborious in ICU, and transformed by digitalisation. There was no need in the electronic chart, to record drug infusion rates as these were automatically recorded on the chart. Nursing time saved equated to a several whole nursing shifts each day. Significant time was also saved for ward clerks and for staff investigating patient complaints. It is interesting in user feedback that staff report data entry is not quicker. Users quickly forget the inconvenience of preparing charts and searching for notes, and do not take these into account when considering data entry into digital systems.
The time-savings measured does not include the additional benefits; research studies are screened for more quickly, notes are accessible for audit, quality improvement, complaints and incident reporting. The labour of sorting through notes and addressing content is alleviated to some extent by the legibility and ability to electronically search, further improving ability to answer complaints or participate in research. The translation of time saved into economic benefit is not direct since each patient requires standard staffing ratios. However, this study does give some normalised of in kind benefit with respect to the ability of nursing staff to deliver direct care to the patient.
Additional benefits
In addition to demonstrating considerable time-savings and improvement in patient safety, there are other benefits that are not easily quantifiable but are obvious from user expectations and feedback. The charts are remotely available and this allows timely review of a patient’s status without the need to physically arrive at the ICU. For example, a surgeon in the operating theatre who has limited time between surgical cases can remotely check the status of a patient and even prescribe drugs remotely if necessary. In these situations, it is clearly important that patient review is not compromised, but there are many clinical situations where new microbiology results or biochemistry results necessitate changes in current treatment regimens and rapid treatment change is beneficial to the patient. Remote viewing of charts is also useful prospectively, for example, nurses awaiting transfer of patients from the ICU to the ward can view the clinical state of the patient before they arrive.
Many clinicians can simultaneously access the same patient’s electronic record and interact with it. Thus, on a busy ward round blood pressure can be viewed on one screen, while on a tablet another doctor adjusts a medication dose and a nurse documents notes on a third device. All members of the multidisciplinary team can simultaneously view the record during discussion.
Another unquantifiable advantage of an electronic chart is the ability to easily view historic charts. In the electronic environment, these are always available and have not been filed or removed from the patient record. This advantage continues after the time the patient is transferred out of the intensive care ward, where often, historic events within the ICU stay are opaque to the clinical teams subsequently caring for the patient. Even in current EHRs there is often discontinuity between ward care (where observations may be documented electronically) and ICU or the operating theatre (where often they are not electronically recorded or are recorded into separate systems).
A simple but powerful advantage of electronic charts is the legibility of the chart, with clear accountability of what is, and is not, documented. The chart does not get lost or misfiled.
Audit and accountability are improved. No-one can add retrospective notes and imply they were written contemporaneously. Contemporaneous notes can be added remotely (eg, by a remote consultant discussing a medical plan with a junior). It is clear from the record who has documented in the record, exactly when, and what that user’s specialty and designation is.
Research
All data entered into the EHR within our organisation is archived for audit for improvement in clinical care and for retrospective clinical investigation, and can be used, with the appropriate ethics and information governance in audit and research. Research teams were asked about their opinion on whether the electronic record had made any difference to workloads or data gathering and report changes in practice, efficiencies and disadvantages after changing to an electronic environment.
Research studies required a screening process and this had previously required a visit to view patients’ paper charts. After launch of electronic charts, screening could be performed remotely. This meant that researchers were focused on patients who fulfilled study criteria, thus reducing the time spend in ICU by two research nurses from 20–40 min to 10–20 min per patient per day. The research nurses reported not feeling as if they were in the way, but also reported a feeling of less presence within the ICU, as they no longer needed to visit
Reporting and artificial intelligence
Across the rest of the organisation, we are realising the benefits of being able to use data to inform practice. Thus alerts can be sent to appropriate clinical teams when patients with particular diagnoses are admitted, patients with high glucose are reported to the diabetes nurse specialists and patients with abnormal early warning scores are alerted to the outreach teams. These benefits are now used in ICU, with our informatics department being asked to set up regular reports, and stream alerts to mobile devices in a similar fashion to the rest of the organisation.
This will undoubtedly drive behavioural change as we have done elsewhere,19 so that reaching full compliance with set targets of care is possible with constant use of data to drive good practice.
Staff attitudes
The project was introduced into an institution where EHR was already ubiquitously used and indeed electronic prescribing and medicines administration was already in use in the ICU. In general, we have found that introduction of more detailed elements of the EHR was not only welcomed but was expected and driven by users, with demand for the software predating the roll out. This is clearly a different situation from de novo EHR roll out and is consequently met with less resistance. Initial staff surveys during roll out demonstrated that staff were generally receptive to the idea of EHR and thought that it would reduce calculation errors. Nurses were concerned that it would not improve patient care overall or patient safety, this view was not shared by doctors or AHPs and has been observed previously in EHR adoption20. The reasons for nurses being less convinced about EHR improving patient care and safety are likely to be complex, and include the confidence that nurses themselves feel interacting with digital systems.
Staff also respond differently over time as they become used to the new technology. In our institution, there is very high expectation that EHR will solve problems as this has been the experience of users in previous projects. Therefore, although error rate is demonstratively reduced by the introduction of electronic charts, some staff answered ‘I don’t know’ to this question, this may be a reflection of doctors who look for published evidence before answering ‘yes’ to questions of this type, where they assume the question is about EHR worldwide rather than the doctor’s own local experience.
Surveys of the established system were overwhelmingly supportive of the software despite the fact that nearly half of the staff had never worked in ICU, and therefore, were using the charts for the first time. The nature of the COVID-19 crisis meant that support, training and supervision of staff members was reduced, attesting that the software supported processes and patient care even in extenuating circumstances. Importantly in the question ‘Do you think electronic charts are a good idea, no doctor or nurse answered ‘no’ to this question.
Harm
We believe that EHR, if used incorrectly, can cause harm. We are cautious, for example, about the introduction of automatic download of patient data as it is likely that manual entry allows for consideration of parameters. On the other hand, we cannot know if all of the manually entered data is correct (indeed this would seem unlikely). We are well aware of the dangers of ‘alert fatigue’ and have published on this previously.21 22 Alerts within the system must be well designed, infrequent and relevant, to have an impact. Finally, we are aware that operating within EHR in a tertiary referral system is unhelpful if prescriptive. Complex medicine means that often practitioners are working outside ‘standard care’ and EHR which is restrictive or dictatorial is unhelpful and likely to be boycotted. We aim to provide safe limits and warn if parameters in prescribing, observations or values are outside these limits, but to avoid a railroad on which we require practitioners to remain. CDS is a powerful tool and used wisely can considerably reduce patient risk; multifaceted EHR provides enriched data all in one place to enable complex CDS rules. Already in the EHR we have built hundreds of complex rules which by combining the diagnostic lists, medications and results, can warn users of potential interactions or changes in the patient’s condition requiring reconsideration of current pathways of care. Finally, we intend to use automatic download of data from monitors, ventilators and pumps and will use these in complex algorithms, we have not yet explored this, or whether in itself this introduces error.
Conclusion
ICU charts can be successfully introduced into an institution and benefit clinicians in terms of efficiency, freeing time for direct patient care. Patients are protected from error and overall financial savings allow money to be recycled into other parts of the healthcare system. High staff acceptability is driven by good end-user design.
Important limitations are that this is a single centre study and due to the complexity of data analysis before electronic implementation, only examples of error (here for fluids) could be undertaken in depth. Future studies should include analysis of error in upload of data to electronic systems and the impact of automatic data download on staff time, attitudes, error rates and patient safety.
Evaluation of implementing EHR is complex and requires ongoing study to understand the true benefits and risks associated with its use.
Data availability statement
All data relevant to the study are included in the article or uploaded as online supplemental information.
Ethics statements
Patient consent for publication
References
Supplementary materials
Supplementary Data
This web only file has been produced by the BMJ Publishing Group from an electronic file supplied by the author(s) and has not been edited for content.
Footnotes
Contributors TP conceived and designed the study and is the guarantor for this work. All authors contributed to academic discussion, writing of the manuscript and review of this article.
Funding The authors have not declared a specific grant for this research from any funding agency in the public, commercial or not-for-profit sectors.
Competing interests None declared.
Patient and public involvement Patients and/or the public were not involved in the design, or conduct, or reporting, or dissemination plans of this research.
Provenance and peer review Not commissioned; externally peer reviewed.
Supplemental material This content has been supplied by the author(s). It has not been vetted by BMJ Publishing Group Limited (BMJ) and may not have been peer-reviewed. Any opinions or recommendations discussed are solely those of the author(s) and are not endorsed by BMJ. BMJ disclaims all liability and responsibility arising from any reliance placed on the content. Where the content includes any translated material, BMJ does not warrant the accuracy and reliability of the translations (including but not limited to local regulations, clinical guidelines, terminology, drug names and drug dosages), and is not responsible for any error and/or omissions arising from translation and adaptation or otherwise.