Article Text

Abstract
Background Medication reconciliation (MR) can detect medication history discrepancies at interfaces-in-care and help avoid downstream adverse drug events. However, organisations have struggled to implement high-quality MR programmes. The literature has identified systems barriers, including technology capabilities and data interoperability. However, organisational culture as a root cause has been underexplored.
Objectives Our objectives were to develop an implementation readiness questionnaire and measure staff attitudes towards MR across a healthcare enterprise.
Methods We developed and distributed a questionnaire to 170 Veterans’ Health Affairs (VHA) sites using Research Electronic Data Capture (REDCap) software. The questionnaire contained 21 Likert-scale items that measured three constructs, such as: (1) the extent that clinicians valued MR; (2) perceptions of workflow compatibility and (3) perceptions concerning organisational climate of implementation.
Results 8704 clinicians and staff responded to our questionnaire (142 of 170 VHA facilities). Most staff believed reconciling medications can improve medication safety (approximately 90% agreed it was ‘important’). However, most (approximately 90%) also expressed concerns about changes to their workflow. One-third of respondents prioritised other duties over MR and reported barriers associated with implementation climate. Only 47% of respondents agreed they had enough resources to address discrepancies when identified.
Interpretation Our findings indicate that an MR readiness assessment can forecast challenges and inform development of a context-sensitive implementation bundle. Clinicians surveyed struggled with resources, technology challenges and implementation climate. A strong campaign should include clear leadership messaging, credible champions and resources to overcome technical challenges.
Conclusions This manuscript provides a method to conduct a readiness assessment and highlights the importance of organisational culture in an MR campaign. The data can help assess site or network readiness for an MR change management programme.
- Healthcare quality improvement
- Implementation science
- Medication reconciliation
- Medication safety
- Surveys
Data availability statement
Data are available on reasonable request. Not applicable.
This is an open access article distributed in accordance with the Creative Commons Attribution Non Commercial (CC BY-NC 4.0) license, which permits others to distribute, remix, adapt, build upon this work non-commercially, and license their derivative works on different terms, provided the original work is properly cited, appropriate credit is given, any changes made indicated, and the use is non-commercial. See: http://creativecommons.org/licenses/by-nc/4.0/.
Statistics from Altmetric.com
- Healthcare quality improvement
- Implementation science
- Medication reconciliation
- Medication safety
- Surveys
What is already known on this topic
While standardised medication reconciliation programmes can reduce life-threatening medication errors and are required to meet Joint Commission performance standards, they can be difficult to implement successfully.
What this study adds
We developed and validated a programme readiness assessment questionnaire to measure staff attitudes about medication reconciliation, concerns regarding workflow and perceptions about their organisational climate. Most clinicians in our enterprise struggle with workload, time constraints and lack of resources to reconcile medications effectively.
How this study might affect research, practice or policy
Implementation scientists can use this questionnaire to survey their workforce before implementing a programme to anticipate implementation barriers—or after an implementation—to identify failure modes and plan quality improvement campaigns.
Introduction
Discrepancies in medication histories collected during transitions-in-care increase the risk of preventable adverse drug events and the cost of healthcare.1–6 For this reason, policy-makers in the USA including The Joint Commission, expect healthcare organisations to implement routinised medication reconciliation (MR) procedures.7–11 The Institute of Healthcare Improvement (IHI) defines MR as ‘the process of identifying the most accurate list of all medications a patient is taking…and using this list to provide correct medications for patients anywhere within the healthcare system’.12
The US Department of Veterans’ Affairs (VA) chartered a quality improvement (QI) initiative to update enterprise MR directives and disseminate an MR management ‘toolkit’. The directives outlined staff responsibilities, including requiring personnel to review specific medication sources, applying a structured workflow and using standardised electronic health record (EHR) documentation. The toolkit included new dedicated EHR-MR functions and change management plans for technology deployment.
Although MR is conceptually straightforward, institutions often struggle to implement best practices, inculcate new clinician habits or measure safety impact.8 13 14 In previous facility-level QI pilots within the VA, our team identified an array of sociotechnical issues mediating successful adoption.15–21 These findings echo prior research on MR implementation barriers including limited EHR interoperability (including prescription data), poor interface usability, competing organisational priorities, patient-centred social factors (eg, health literacy), and clinician time and staff resource constraints.5 22–28
Problem statement and purpose
The VA engaged our informatics team to assist with implementation of the new MR directives and toolkit across the enterprise. Our piloting efforts with prototype technology at one VA site provided us insights into potential implementation barriers.20 29 However, we did not know if these insights were generalisable. We needed to know what system characteristics were ubiquitous (eg, existing workflows, staff values, leadership climate), what barriers to anticipate, and what to include in our implementation plan. Furthermore, we needed a practical and scalable way to gather this information. Our intention was to complete an enterprise readiness assessment before publicising the new directives or deploying the MR toolkit to measure baseline staff attitudes, forecast implementation barriers and identify management levers of change. To conduct this readiness assessment, we needed a validated questionnaire that could be used nationwide. The objectives of our study were to: (1) develop a validated MR readiness assessment questionnaire; (2) measure current MR practices and perceptions within a large government health system; and (3) identify generalisable organisational issues that could inform implementation or scaling of our MR QI campaign. This report should interest safety officers, healthcare administrators, policymakers, implementation scientists and informaticians.
Methods
Study design overview
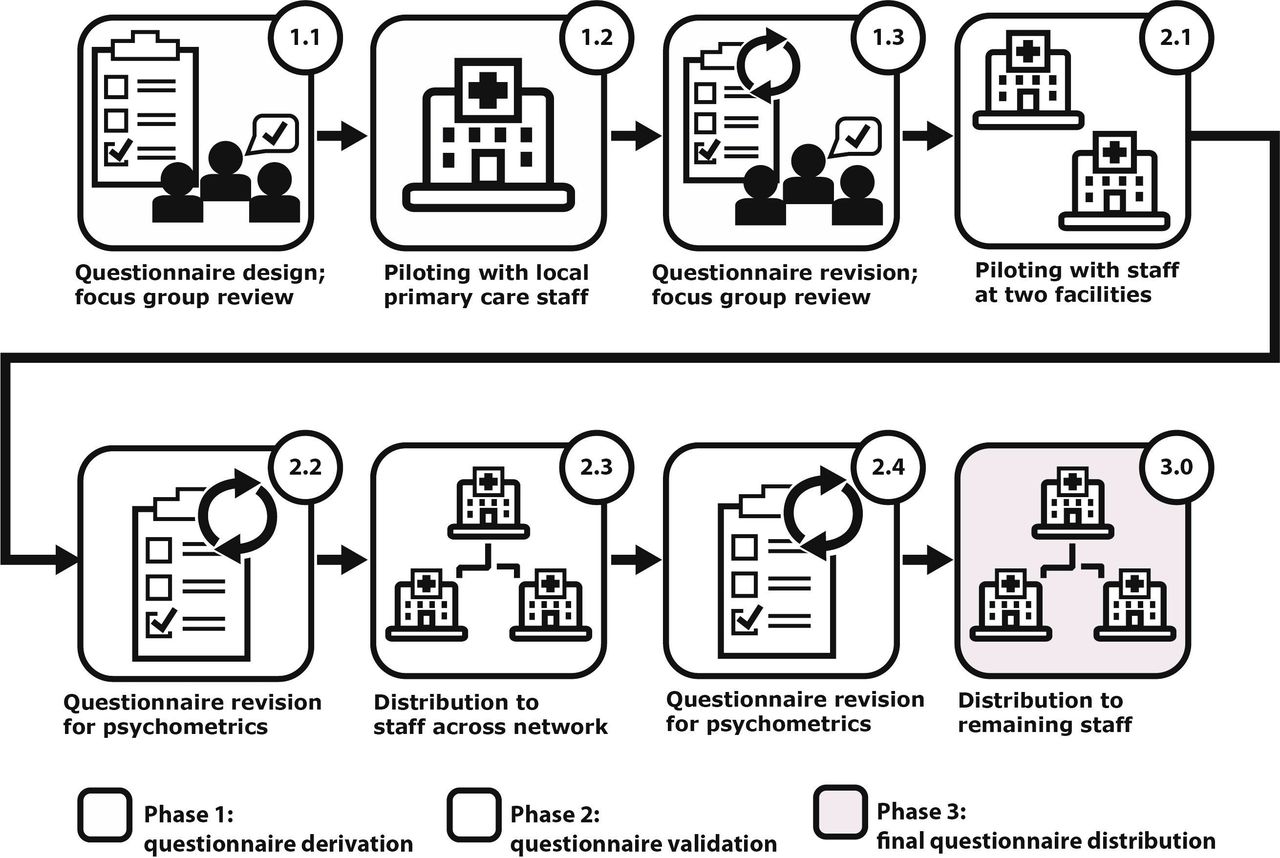
We developed and distributed a cross-sectional MR implementation readiness questionnaire. Development included a derivation phase, a validation phase and a final distribution phase (figure 1). During the derivation phase, we piloted a patient-centred MR technology at a single facility and distributed a postdeployment questionnaire to primary care providers because they were responsible for MR at this facility.20 29 The postdeployment context helped identify implementation constructs with the greatest effect on adoption (ie, predictive validity).30 We then adapted this questionnaire to measure beliefs of all clinicians (not just primary care providers) and activities throughout the enterprise before nationwide toolkit implementation. During the validation phase, we iteratively tested and adjusted the questionnaire to improve psychometric properties. During the final distribution phase, we administered the questionnaire to the remaining facilities in our network.

Workflow for development and validation of our readiness assessment questionnaire (created by the authors; BMJ is granted permission to reproduce).
Theory
We adapted Davis’ Technology Acceptance Model (TAM)—a ubiquitous technology adoption model—to study environmental, technical and attitudinal variables mediating user adoption of a technology.31 32 Our effective technology use (ETU) model is an ‘added-variables TAM’ measuring three independent predictors influencing adoption: (1) user values compatibility; (2) workflow compatibility and (3) implementation climate (figure 2).29 We defined user values compatibility as the degree of alignment between staff values and purpose of the innovation; workflow compatibility as the degree of alignment between current-state and future-state workflows; and implementation climate as a composite estimate of social influence (eg, management expectations) and facilitating conditions (eg, technology support).

The effective technology use model describing attributes of the user, climate, workflow and technology that mediate innovation adoption (created by the authors; BMJ is granted permission to reproduce).
Phase 1: derivation
Our first questionnaire included items measuring each ETU construct (online supplemental file 1). For face validity, we conducted interviews with two focus groups of primary care physicians and made revisions based on the feedback (figure 1; 1.1).30 33 For criterion-predictive validity (ie, the relationship between clinician perceptions and technology adoption) we piloted the questionnaire with primary care providers at one VA facility (figure 1; 1.2).20
Supplemental material
In preparation for enterprise-wide distribution, we updated the questions to account for the larger number of facilities. We expanded our scope to include more than primary care providers (figure 1; 1.3). We had not yet implemented the new MR toolkit and thus removed questions asking about perceptions of the MR technology. We formatted responses using a five-point Likert scale anchored by 5 = ‘strongly agree’ and 1 = ‘strongly disagree’. The first scale measured user values compatibility (eg, ‘reconciling medications is an important way to improve patient safety’). The second scale measured workflow compatibility (eg, ‘MR makes me do extra work’). The third scale measured implementation climate (eg, ‘our local clinical leadership has acted to remove obstacles encountered in our MR process’).
For face validity, we interviewed four clinician focus groups that included nurses, physicians, pharmacists and allied care professionals from six medical centres. Interview scripts explored the roles and expectations of interdisciplinary teams. We also asked administrators knowledgeable about local management practices to provide feedback on climate questions.
Phase 2: validation
We piloted our questionnaire at two VA facilities and modified it based on principal component analysis and Cronbach’s alpha scores (figure 1; 2.1 and 2.2). The validation phase questionnaire included three scales and 22 individual questions. Maximum cumulative score for values, workflow and climate were 35, 40 and 35, respectively.
We used REDCap software to distribute the questionnaire to network facilities (figure 1; 2.3).34 35 All VA personnel were eligible for participation, including clinician roles, other patient-facing roles and non-patient facing administrative roles. Although there are an estimated 367 000 care professionals and support staff across all VA facilities, VA Human Resource policies forbid collection of individually identifiable data. Therefore, we could not directly measure the respondent pool (ie, questionnaire response denominator), contact non-respondents for follow-up or prevent multiple participation. We used purposive snowball sampling, contacting facility-based personnel including clinical department chiefs, hospital executives, safety officers, public affairs officers and MR champions. The email included the purpose of the evaluation, a description of the questionnaire, a request to distribute and a link to the REDCap questionnaire. To maximise responses, we sent three different emails, distributed at 2-week intervals. We also placed reminder calls and emails to our contact list.
After 5 months, we conducted an interim data analysis of psychometric properties. We made three adjustments to improve validity and the informativeness of each scale (figure 1; 2.4). First, we updated language for user values compatibility questions to correct for positive skewness in the response distribution and limit social desirability bias. Second, we changed scale order, moving ‘user values compatibility’ to the second section to eliminate any primacy effect. Third, we removed an item from the workflow compatibility scale to improve internal consistency.
Phase 3: final distribution
Our final distribution phase questionnaire included 3 scales and a total of 21 individual questions (online supplemental file 2). Maximum cumulative score for each section was 35. We distributed this questionnaire to the remaining facilities in our network (figure 1; 3.0).
Supplemental material
Statistical analysis
We collected all data in REDCap and performed all statistical analysis using Stata (V.15).36 To measure item cohesion (ie, internal consistency) for each scale, we calculated the Cronbach’s alpha and intra-class correlation coefficients (ICCs). To calculate ICCs, we used the consistency ICC of average measurements among items, computed from a two-way mixed-effects ANOVA model.
Item-level data were heavily skewed to the left (ie, asymmetrically heavier weight of positive responses for positively coded items). Therefore, we calculated medians and IQR for each item. We summated overall values for each scale (reverse-coding negatively coded items) and examined associations between scales and clinical business units using regression analyses. We adjusted models for respondent tenure at the VA. We addressed missing data (just 2% of responses were missing some information) through pairwise deletion. We conducted meta-analyses to summarise scores and regression results for each scale across the entire VA; this method of summary remains valid regardless of differences in questionnaire versions (validation phase vs distribution phase).
Permissions and patient/public involvement
The Portland VA Medical Center Office of Research & Development reviewed this work and determined the project to be non-research operations and QI work. The VA Office of Personnel Management also reviewed and approved this work. There was no patient or public involvement in this work.
Results
Descriptive statistics and validation data
We distributed the validation phase questionnaire between 23 October 2015 and 12 May 2016 and the final distribution questionnaire between 3 May, 2016 and 18 July 2016. We received responses from staff at 142 of 170 facilities. While we did not have data on the actual breakdown of employee roles within the population, we suspected that nurses and providers were over-represented. We received 8704 responses (8515 with all scales completed)—4790 nurses (55%), 1530 providers (18%), 1020 pharmacy staff (12%), 370 administrative staff (4%), 637 ‘other clinical staff’ (7%), 246 social workers (3%) and 111 staff (1%) that did not report a role (online supplemental table 1S). A total of 3310 respondents (38%) had completed 0–5 years of service and 1262 respondents (14%) had completed more than 20 years of service.
Supplemental material
Table 1 includes construct validity, internal consistency and comparative performance statistics for the validation and distribution questionnaires.
Questionnaire validity statistics (created by the authors; BMJ has permission to reproduce)
Minor differences in calculated internal consistency between versions were negligible and consistent with sampling variance (ie, z-scores less than 2 in magnitude for all three scales, and jointly p=0.17 when combined using Fisher’s method to evaluate the omnibus hypothesis of no change in consistency across versions).
Comparing responses to the validation questionnaire and distribution questionnaire
User values compatibility scores were significantly lower in the distribution questionnaire (mean sum 29.4 vs mean sum 26.5; p<0.001; table 2). This was expected; we had sought to limit inflation of attitudes secondary to social desirability bias. We did not identify any significant differences in the distribution of responses in the workflow compatibility and implementation climate scales. Comparing the measurement properties using Rache response characteristic curves across versions, we saw a large improvement in curve symmetry and informativeness of responses for user values compatibility, and a small improvement for workflow compatibility (online supplemental figure 1S). The response characteristics curves for implementation climate were similar between questionnaires.
Supplemental material
Questionnaire response summaries (created by the authors; BMJ has permission to reproduce)
Staff beliefs and values regarding MR
Overall, most respondents valued and supported MR values and activities. In the validation phase questionnaire, 7592 (92.5%) of 8200 respondents agreed or strongly agreed with the statement ‘reconciling medications is an important way to improve medication safety’ (table 3). In the distribution phase questionnaire, 325 (74.7%) of 434 respondents agreed with the statement ‘I believe it is crucial to review every single medication with the patient or caregiver during the interview’ (table 4). In the validation phase questionnaire, over 80% of respondents believed it was ‘valuable’ for a patient to complete a medication review at every encounter (table 3), and in the distribution phase questionnaire, 80% of respondents agreed it is ‘crucial’ for the patient to leave every encounter with a correct list of medications.
Questionnaire item responses for the validation phase
Questionnaire item responses for distribution phase
Only 65.4% of respondents answering the validation-phase questionnaire agreed that their time was ‘well spent’ correcting and updating medications. Only 36.7% of respondents answering the distribution-phase questionnaire agreed that their time was ‘best spent’ doing these activities (table 4). Pharmacist and nurse user values compatibility scores tended to be higher (ie, more positive) than physicians and physician assistants (30.4 vs 28.0 out of 35, averaged over questionnaire versions; p<0.001).
Staff perceptions of MR processes and workflow
Respondents seemed to struggle to align MR processes with current workflow. About 90% of respondents believed MR was burdensome; the mean score was about 20 out of 35 (table 2), representing typical scores of 3 per item (ie, neutral valence). The validation phase workflow compatibility scale sums were rescaled by 7/8 to correct for change in scale maximum value between versions.
Nearly half of respondents believed MR requires a lot of mental effort, and roughly 75% had difficulty identifying important discrepancies at the point of care. About half of respondents believed MR processes increased their workload and added to their responsibilities. Emergency care staff reported the highest perception of burden (21.7 for emergency care vs 20.0 for non-emergency care; p<0.001), whereas outpatient and domiciliary staff reported the lowest (18.7 for either vs 20.3 for neither; p<0.001).
Respondents could choose multiple work areas as their main work area, but 95% of respondents chose just a single area. Thus, responses were non-overlapping in nearly all cases. For example, only 20 out of 8704 respondents identified emergency care and either outpatient or domiciliary care as their main work areas.
Staff attitudes towards MR implementation climate
Respondents harboured mixed feelings about the implementation climate. They tended to agree that hospital executives supported MR programmes and that clinical leadership promoted MR to achieve quality targets. Averaged over questionnaire versions, 60.2% agreed or strongly agreed with at least two of the first three items in the implementation climate scale (see also tables 3 and 4).
However, over 40% of respondents did not believe they were suitably incentivised to participate in MR work. Only about 30% agreed leadership removed implementation obstacles, and less than half (47%) believed they had sufficient resources. The most negative views were expressed by younger staff (22.2 for less than 30 vs 23.3 for over 30; p<0.001) and those with less tenure (22.9 for five or less years vs 23.8 for 20 or more years; p<0.001).
Discussion
Principal findings
In this MR readiness assessment, we examined staff perceptions and attitudes about MR before deploying an MR toolkit during an enterprise-wide QI campaign. By surveying a cross-section of clinical and administrative personnel in the largest US healthcare system, we were able to assemble a detailed portrait of staff concerns and organisational challenges facing MR implementation and dissemination. Typically, sustained improvement in MR processes and clinical outcomes is contingent on a combination of decision support technologies, a strong organisational climate and a schematised workflow.16 19 24 28
Unfortunately, our findings indicate that VA clinicians struggle with resource and technology gaps. They cited concerns over workflow compatibility and institutional support—including resources, time and leadership prioritisation. Approximately one-third of respondents did not think their time was well-spent reconciling medications, most thought it added to their workload and three-quarters had difficulty identifying important discrepancies at the point of care. The VA boasts a very mature information-technology infrastructure that includes a Health Information Management Systems Society stage 7 EHR and an electronic pharmaceutical supply-chain management system. Therefore, challenges identified in our study population are likely greater in community settings worldwide.37
To our knowledge, this is the largest survey published looking at the sociotechnical mediators of MR. Our findings are generally concordant with results from other studies examining barriers.13 26 38–41 High-reliability MR requires more than rote checklists, boilerplate language, or modal dialogue boxes.42 There must be an organisational and individual commitment to detecting discrepancies, identifying root causes and closing gaps.8 Our results indicate that many clinicians neither feel incentivised nor are given the resources to be successful.
Comparison to the literature and implication of findings
Respondent concerns over the mental workload and challenge of identifying important discrepancies may indicate a need for better EHR-based tools to collect, analyse, display and document discrepancies.43 44 A systematic review by Marien et al identified specific MR tools used during hospital admission, discharge and ambulatory clinic visits.24 These include (1) automated data retrieval, (2) side-by-side list displays, (3) point-and-click selection controls, (4) duration of therapy and refill displays, (5) context-sensitive decision support, (6) automated task documentation and (7) the ability to sort medications by class or disease. Prescription data interoperability and regional health information exchange can also provide a more complete picture of prescribing activity within a community.45
While clinicians need these capabilities to limit cognitive load and improve performance, many features are unavailable or poorly implemented in commercial EHRs.16 43 46–48 We believe next-generation tools should incorporate better visualisations, predictive analytics and artificial intelligence. They should also engage patients and leverage direct-to-consumer technologies such as online portals, smartphone applications and automated pill organisers.
User values compatibility scores in our study were lower among physicians and physician assistants compared with nurses and pharmacists. While it is difficult to know if one group felt more or less responsible for MR tasks, the literature indicates nurses, physicians and pharmacists often disagree over delegation of medication management responsibilities.40 For example, compared with nurses and pharmacists, physicians tend to prioritise other tasks in a resource-constrained setting.26 Therefore, it is crucial for organisational leaders to identify local champions, sponsor human factors evaluations and identify dedicated personnel (eg, pharmacy technicians) based on clinic resources and characteristics.8 19 49
Only a minority of respondents (31%–32%) believed leadership removed obstacles to completing MR and only half (47%–50%) thought they had the resources needed to address discrepancies. These data seem to align with what is known about the workload associated with MR. Compiling medication lists, identifying discrepancies, reconciling medications and managing formulary options is time-consuming, cognitively complex and a potential contributor to burn-out.19 20 50 Complex problems demand systems-based solutions. Successful MR programmes require team-based models of care, context-sensitive management pathways, better use of health information exchange and consumer-centred tools to engage patients as active stewards of their own medications.46 51
The MR literature offers some insight into the related failure modes and strategies that might increase a campaign’s success. However, it is not yet clear which interventions would have the greatest effect in our organisation. The best interventions need to be precisely matched to local context. Therefore, professionals charged with deploying an MR programme should consider using this questionnaire with a workflow analysis and a qualitative needs assessment to identify failure modes and to anticipate assets required for system-level change.
Strengths and limitations
There are several strengths to our study and findings. First, we were able to survey nearly every VA hospital and clinic in the US and conduct a near 360° angle view of all clinical roles. Second, in designing our questionnaire, we used a theory-based approach reflecting recent concepts from the systems engineering and technology adoption literature. Finally, we used a multistep process to validate our questionnaire. Therefore, we believe the final instrument could be re-used across a broad range of clinical settings and compared with our benchmarks.
This study has several limitations that may have affected our results. Our study design relied on snowball sampling to comply with institutional policies. This may be an important source of respondent bias, since we do not know the actual survey response rates. Second, our questionnaire did not explicitly ask about any MR technologies. Future work should directly measure the usability associated with embedded EHR tools. Third, some of the clinicians surveyed may not be responsible for MR at their facility. This could bias perceptions and values. Fourth, we were unable to recruit equal numbers of nurses, clinicians, pharmacy staff, social workers and administrative staff. The differences in subgroups limited our ability to compare beliefs across these groups. Future work should engage social workers and other groups under-represented in the literature. Finally, we analysed findings from two questionnaire versions—the validation phase questionnaire and the distribution phase questionnaire. While they were very similar in design and wording, we could not combine results. Given the large number of responses, we thought it is best to report findings for both sets.
Conclusions
Our findings can inform MR-related QI initiatives in hospitals and clinics. While prior researchers have reported on the attitudes of physicians and pharmacists, far fewer have studied nurses, social workers and other allied care providers.8 9 39 40 This manuscript provides a readiness assessment tool (online supplemental appendices 1 and 2) and a framework to plan and execute an MR change management programme.
Data availability statement
Data are available on reasonable request. Not applicable.
Ethics statements
Patient consent for publication
Acknowledgments
We acknowledge the contributions of Maureen Layden, MD MPH, and Eric Spahn, PharmD with VA Pharmacy Benefits Management (PBM) for their valuable suggestions on survey instrument design and distribution.
References
Supplementary materials
Supplementary Data
This web only file has been produced by the BMJ Publishing Group from an electronic file supplied by the author(s) and has not been edited for content.
Footnotes
Contributors BL contributed to the study design, data analysis and manuscript draft and revision. He accepts full responsibility for the work and/or the conduct of the study. He had access to the data, and controlled the decision to publish. VLC contributed to the study design, questionnaire distribution, project management and data analysis. She reviewed the manuscript. KA contributed to the study design, data analysis and manuscript development. AM contributed to study design and data analysis. She reviewed the manuscript. AR-A contributed to study design, questionnaire distribution and project management. She reviewed the manuscript. NG contributed to study design, questionnaire distribution and project management. She reviewed the manuscript. JW contributed to study design, data analysis and manuscript draft and revision.
Funding The VA National Center for Patient Safety (NCPS) funded portions of this work (no award/grant number). The authors also wish to acknowledge the generous support from the Portland Division of Research & Development, the VHA Chief Business Office, the Portland Center to improve Veteran Involvement in Care (CIVIC), the VA Veterans’ Engineering Resource Center (VERC), and the Oregon Clinical and Translational Research Institute (OCTRI).
Competing interests None declared.
Patient and public involvement The Portland VA Medical Center Office of Research & Development reviewed this work and determined the project to be non-research operations and quality improvement work. The VA Office of Personnel Management also reviewed and approved this work. There was no patient or public involvement in this work.
Provenance and peer review Not commissioned; externally peer reviewed.
Supplemental material This content has been supplied by the author(s). It has not been vetted by BMJ Publishing Group Limited (BMJ) and may not have been peer-reviewed. Any opinions or recommendations discussed are solely those of the author(s) and are not endorsed by BMJ. BMJ disclaims all liability and responsibility arising from any reliance placed on the content. Where the content includes any translated material, BMJ does not warrant the accuracy and reliability of the translations (including but not limited to local regulations, clinical guidelines, terminology, drug names and drug dosages), and is not responsible for any error and/or omissions arising from translation and adaptation or otherwise.