Article Text

Abstract
Improving the use of viral load (VL) testing for adolescents and young people living with HIV (AYPLWH) is a priority for Kenya’s Ministry of Health (MOH). Despite expansion of VL testing coverage and rollout of national policies, guidelines and training, VL result utilisation for AYPLWH remains suboptimal, with inadequate adherence to national guidelines recommending everyone on antiretroviral therapy (ART) with unsuppressed viral load (UVL) (≥401 copies/mL) receive three enhanced adherence counselling (EAC) sessions and a repeat VL test within 3 months. In March 2019, ICAP at Columbia University partnered with the MOH to launch a Quality Improvement Collaborative (QIC) at 22 health facilities in the Eastern Province to optimise management of AYPLWH on ART with UVL. Over 17 months, facility QI teams tested interventions targeting client education, workflow modifications, commodity management, community engagement and improved documentation. The QIC led to marked improvement in the proportion of clients completing three EAC sessions and repeat VL testing. Median completion rate was 16% (n=479) at baseline (from March 2018 to February 2019) and rose to 73% (n=755) during the implementation period (from March 2019 to July 2020). In the final month (July 2020), rates rose to 90% (n=31). Another success was the increase in the proportion of clients whose VL was resuppressed on repeat testing, which improved from 34% (n=273) at baseline to 62% (n=710) during the implementation period and 77% (n=44) in the final month. The QIC also led to improvement in the proportion of AYPLWH on first-line ART whose regimens were switched within 2 months of recorded UVL results, which rose from 58% (n=48) at baseline to 94% (n=128) during the implementation period. In summary, the QIC helped facility teams to identify and prioritise local, contextually appropriate innovations which led to swift improvement in three critical indicators of VL utilisation.
- Quality improvement
- Continuous quality improvement
- Quality improvement methodologies
- Time-to-Treatment
- Collaborative, breakthrough groups
Data availability statement
Data are available upon reasonable request.
This is an open access article distributed in accordance with the Creative Commons Attribution Non Commercial (CC BY-NC 4.0) license, which permits others to distribute, remix, adapt, build upon this work non-commercially, and license their derivative works on different terms, provided the original work is properly cited, appropriate credit is given, any changes made indicated, and the use is non-commercial. See: http://creativecommons.org/licenses/by-nc/4.0/.
Statistics from Altmetric.com
- Quality improvement
- Continuous quality improvement
- Quality improvement methodologies
- Time-to-Treatment
- Collaborative, breakthrough groups
WHAT IS ALREADY KNOWN ON THIS TOPIC
Globally, adolescents and young people living with HIV are an underserved population with many barriers to obtaining high quality services causing poor ART adherence and unsuppressed viral load results. While the Kenyan Ministry of Health has implemented numerous essential health system strategies, the know-do gap persists and this vulnerable population continues to have high rates of HI treatment failure. QI approaches have been shown to be effective in addressing these types of ongoing quality challanges.
WHAT THIS STUDY ADDS
In collaboration with the Kenyan Ministry of Health, ICAP at Columbia University implemented a QIC to improve VL utilization for adolescents and young people living with HIV on ART with an unsuppressed viral load. The use of QIC methodology empowered Kenyan QI teams to design and implement local solutions which resulted in a ‘change package’ of successful initiatives that can be disseminated for wider scale implementation.
HOW THIS STUDY MIGHT AFFECT PRACTICE AND POLICY
Institutionalising QI methods into routine health facility operations is critical to sustaining improvements. Health sector policy makers should consider institutionalising the QIC approach and fostering its targeted implementation to address refractory quality challenges into national quality guidelines and strategies.
Problem
Kenya has made great strides towards achieving the 2030 UNAIDS 95-95-95 targets and is on track to achieving HIV epidemic control. In 2020, 79.5% of adults living with HIV in Kenya knew their HIV status, 96% of these were on antiretroviral therapy (ART) and 90.6% of adults on ART were virally suppressed.1 In contrast, 78.9% of children living with HIV infection knew their status, 93.2% of these were on ART and 67.1% of children on ART had a suppressed VL. Viral suppression among adolescents and young people (AYP) remains challenging.2
Globally, AYP living with HIV (AYPLWH) are an underserved population, requiring uniquely tailored interventions specific to their distinct needs. In 2019, 460 000 (260 000–680 000) AYP between the ages of 10 and 24 were newly infected with HIV, of whom 170 000 (53 000–340 000) were between the ages of 10 and 19. Recent data indicate that only 27% of adolescent girls and 16% of adolescent boys aged 15–19 years in Eastern and Southern Africa were tested for HIV and received the result in the past 12 months.2 Compared with adults, adolescents and young people are less likely to be tested for HIV, those who tested positive for HIV are less likely to be linked to treatment, and those on ART are less likely to be virally suppressed. Of the 1.75 million (1.16 million–2.3 million) adolescents (aged 10–19 years) globally, only 54%, or 940,000, were receiving ART in 2020.3 Adolescents have less viral suppression as compared with adults related to numerous individual and structural factors.4
In Kenya, as elsewhere, the HIV epidemic among adolescents and young people between the ages of 10 and 24 years is characterised by relatively high HIV incidence and suboptimal treatment outcomes, including a high loss to follow-up, low adherence to treatment and low viral suppression.5–8 According to the 2018 Kenya AIDS Response Progress Report (KARPR), 12% of PLHIV in Kenya (1 493 400 people) are 15–24 years of age; this age group also contributes 33% of new HIV infections and 10% of HIV/AIDS-related deaths. Only 54% of ALPLWH aged 10–19 years are virally suppressed.9 10 Identifying practical, contextually appropriate interventions to improve treatment outcomes in adolescents and young people is a high priority for Kenya’s Ministry of Health (MOH) and National AIDS and Sexually Transmitted Infections Control Programme (NASCOP).
Background
While HIV incidence rates and poor treatment outcomes are decreasing among adults and young children in Kenya, they continue to worsen among adolescents and young people who are more likely to be lost to care after enrolment, less likely to adhere to ART after initiation, and less likely to be virally suppressed.11 12 Studies have shown that individual, health systems and structural factors specific to this at-risk population lead to the poor retention, suboptimal adherence to ART and reduced viral suppression as compared with adults.13
Kenyan national guidelines recommend that adults and adolescents on ART with unsuppressed viral load (UVL) receive three enhanced adherence counselling (EAC) sessions at monthly intervals for 3 months followed by repeat a VL test, with a switch to second-line ART if persistent UVL is found.14 15 ‘Treatment failure’ is determined when the repeat VL remains ≥1000 copies/mL despite 3 months of excellent adherence.16
Initial efforts to improve HIV treatment outcomes among AYPLWH in Kenya included the rollout of national policies, guidelines, HCW training and attention to the availability of medications, commodities, supplies, laboratory testing, and monitoring and evaluation systems. Despite these interventions, AYPLWH continue to have high rates of treatment failure, ongoing transmission risks, and high morbidity and mortality.9 Kenya has subsequently prioritised the use of modern quality improvement (QI) approaches to address this critical quality challenge,17 and in response,ICAP at Columbia University (ICAP) partnered with NASCOP, province and county health management teams, and the Centers for Health Solutions (CHS) to design and implement a Quality Improvement Collaborative (QIC).
Measurement
NASCOP and ICAP supported project stakeholders, described below, to develop an aim for the QIC based on familiarity with the context, expertise in HIV service delivery for adolescents and young people and analysis of 12 months’ worth of baseline data at project health facilities which revealed that the median completion rate for three EAC sessions and a repeat VL test among AYPLWH was 16% between March 2018 and February 2019. The QIC aim was as follows:
From March 2019 to August 2020, 22 health facilities in Machakos, Makueni and Kitui Counties will increase the proportion of AYPLWH on ART with UVL who receive three EAC sessions and a repeat VL test (within 4 months) from 16%* to 95%.
QIC stakeholders also agreed to track the following secondary aims. These QIC shared indicators were identified through process mapping of critical steps of VL monitoring among AYPLWH on ART:
Proportion of non-pregnant AYPLWH on ART with UVL who received three EAC sessions within 4 months of the VL results being recorded in the register.
Proportion of non-pregnant AYPLWH on ART with UVL who received three EAC sessions and a repeat VL within 4 months of the results being recorded in the register.
Proportion of non-pregnant AYPLWH on ART who are virally suppressed at repeat VL test.
Proportion of non-pregnant AYPLWH on first-line ART regimen whose ART regimens are switched within 2 months of the results being recorded in the register.
Finally, the team brainstormed about possible unintended consequences of improvements in these aims, and identified a key balancing indicator—stockout of second-line ART medications.
During both baseline and implementation data collection, health facility level and aggregate level monthly data were abstracted from national Kenyan MOH registers (ie, ART, VL and UVL registers) by health facility staff using a standardised paper-based tool. ICAP Kenya staff entered the aggregate anonymised data into an ICAP DHIS2 database and conducted descriptive analyses using basic summary statistics and time series analysis on run charts. Health facility QI teams also plotted data on run charts to track monthly performance and link progress to targets with specific change interventions. ICAP staff monitored the balancing indicator by asking about ART stockouts at every supportive supervision visit and cross-referencing pharmacy supply records when available.
We used a quasi-experimental interrupted time series analysis of these quantitative data to gauge the success of the QIC without using control or comparison sites. Project design involved measurement of QIC indicators before, during and after the intervention at the 22 participating facilities, with the assumption that differences in performance ‘after’ compared with ‘before’ were likely due to the intervention.
We assessed performance by calculating the mean, median and range for each QIC indicator across the 22 health facilities over time. We also analysed run charts from all health facilities to explore the magnitude, speed and sustainability of change in project indicators with relationship to implementation of change ideas. Data quality assurance verifications were built into the database and systematically reviewed; any errors identified were immediately addressed with health facility QI teams.
Design
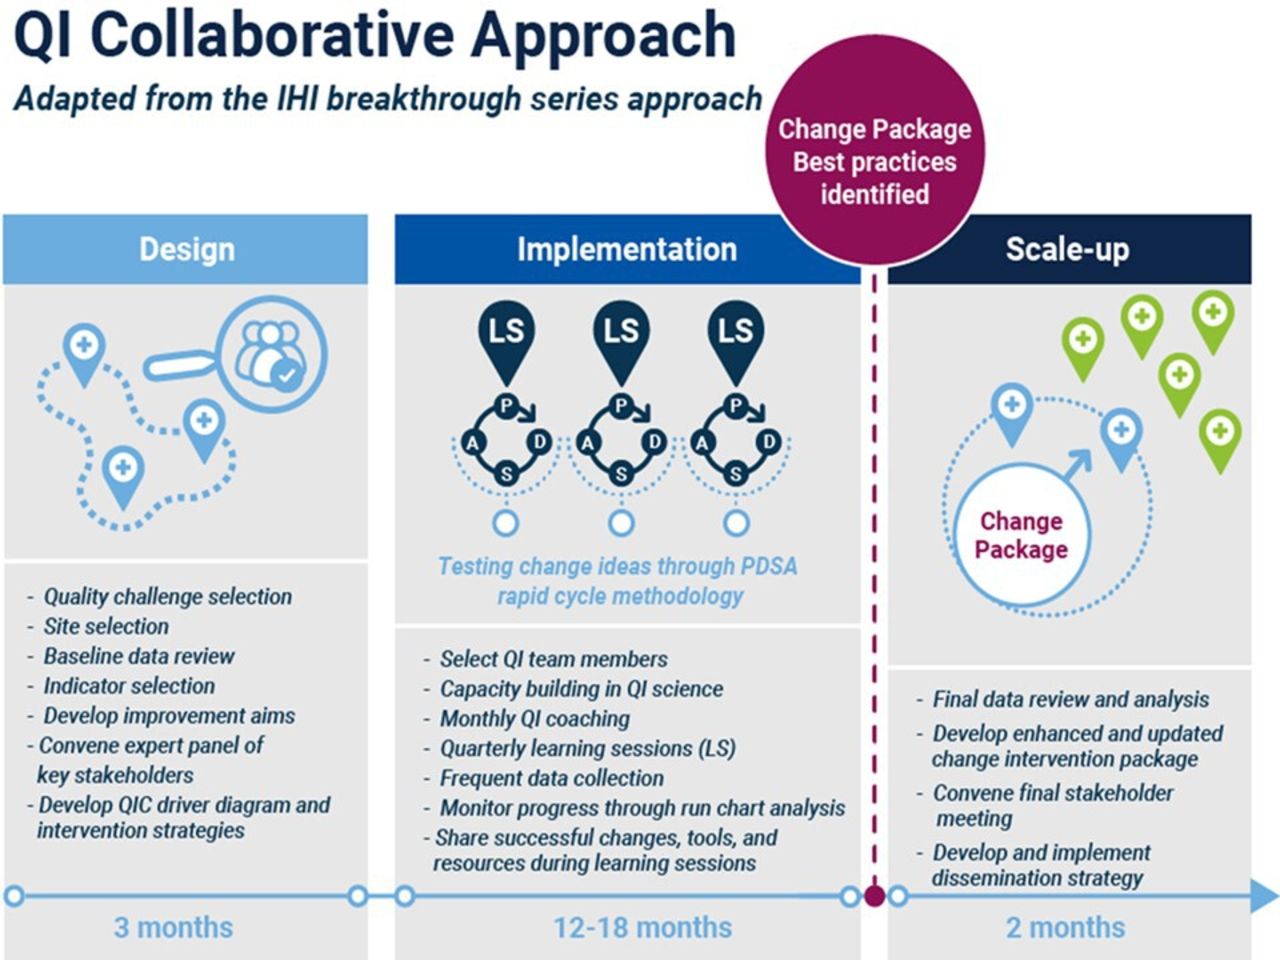
ICAP and NASCOP chose to use the QIC methodology to address the challenge of suboptimal treatment outcomes among AYPLWH, given its power to address complex health system challenges.18 Although the evidence base is evolving, QI has been shown to empower healthcare worker teams to select a quality challenge, systematically identify root causes, understand their own processes, design locally appropriate interventions, and conduct rapid, iterative tests of change that ultimately lead to sustained system improvements.19 20 The QIC approach has been implemented widely in both high-resource settings and low-income and middle-income countries (LMIC) and can produce significant improvements in outcomes.21 22 Originally developed by the Institute for Healthcare Improvement, and also known as the ‘breakthrough series’ approach, QICs establish a network of health facilities which simultaneously focus efforts on a shared quality problem while each individual health facility QI team uses QI tools and methods to generate contextually appropriate improvements for a prescribed period of time (often 12–18 months).23 The QIC design includes a collective improvement aim, a communal set of indicators, measurement plan and quarterly forums for data review and peer-to-peer learning.24 25 Grounded in the Model for Improvement and its plan, do, study, act (PDSA) cycles, health facility QI teams select change interventions based on evidence-based practices and implement using the PDSA rapid cycle methodology while monitoring progress on run charts. During three to six quarterly learning sessions, facility QIC teams present their data and progress towards the shared targets, as well as exactly how they adapted and implemented successful change ideas.23
Between March 2019 and September 2020, ICAP and NASCOP partnered with three county health teams (Machakos, Makueni and Kitui Counties) in the Eastern Province of Kenya, the US Centers for Disease Control (CDC) in Kenya, the US Health Resources & Services Administration (HRSA) and CHS to implement a QIC to improve VL testing and utilisation of results for VL suppression for AYPLWH with UVL. The design phase activities started in March 2019, and included site selection, development of indicators, baseline data collection and analysis. Site selection criteria included health facilities with the largest client populations of AYPLWH, sites with AYP services available and sites where previous trainings in QI and adolescent HIV had been completed recently. Twenty-two facilities in three Eastern Province counties were selected. In Machakos County, the nine facilities included the regional referral hospital, six level 4 hospitals and two health centres. The seven health facilities in Makueni County included six subcountry hospitals and one health centre. In Kitui County, there were five subcounty hospitals and one health centre. Health facility-based QI teams typically included health facility administrators, HIV programme nurses, clinical officers, laboratory staff and pharmacy staff. Due to the nature of the project activities, most QI activities were led and managed by facility nurses. It was not appropriate or possible to involve patients or the public in the design, or conduct, or reporting or dissemination plans of our study at the time of project implementation.
Strategy
Figure 1 describes the overall QIC strategy and the three phases implemented over the 17 months of the project.

The Quality Improvement Collaborative (QIC) strategy for improvement. PDSA, plan, do, study, act.
Improvement cycle one
The implementation phase started in April 2019, when ICAP and NASCOP convened the first learning session for 79 QI team members from the 22 participating facilities. This 4-day QI capacity building workshop provided participants with training on modern QI science tools, including the model for improvement and PDSA cycle methodology, and used a QI curriculum based on national guidelines and practice-based QI training methods.26 27 Participants reviewed the aims and indicators described above, performed root cause analyses using fishbone diagrams and process maps, and generated change ideas based on system weaknesses, bottlenecks and barriers to optimal VL utilisation among AYPLWH. Additionally, health facility QIC teams ranked potential change ideas using a prioritisation matrix tool and practiced tracking progress with run charts, consolidating their knowledge of both QI methods and adolescent VL management. Each team left the first learning session with a well-constructed QI strategy and plans to implement and test their first change ideas immediately on returning to their facilities.
Sixty-one participants completed both the pretest on day 1 and the post-test on day 4. Pretest scores increased from an average of 54% (median 50%; range 25% to 92%) to an average of 75% (median 75%; range 42% to 100%) on the post-test. A structured survey following the learning session found that 100% of participants agreed that its learning objectives were relevant to their work, 96% agreed that they achieved the learning objectives, and all participants agreed that they were the right person from their health facility to be in the training, and 98% were confident about starting relevant QIC activities in their health facility.
Improvement cycles two through five
After the first quarter of implementation, ICAP and NASCOP convened four quarterly learning sessions to enable health facility QI teams to compared progress towards the shared aims and experiences. The initial meetings were in person, in September 2019 and February 2020; due to the COVID-19 pandemic, the learning sessions in April 2020 and August 2020 were held virtually using the Zoom online platform. These 2-day learning sessions provided a forum for health facility QI teams to present progress towards achieving the shared aim, exchange best practices and lessons learnt, review aggregate data, discuss implementation challenges and collectively develop solutions.
From March 2019 to July 2020, following the first learning session, monthly supportive supervision visits were made to each facility by ICAP staff in collaboration with NASCOP, provincial and DHMT officers, and ICAP. ICAP performed 722 site support visits, including 498 in-person health facility visits and 224 virtual telehealth-based visits; the latter were required in 2020 due to the COVID-19 pandemic. During supportive supervision visits, ICAP QI coordinators and M&E staff provided coaching and mentorship to strengthen QI skills and build capacity among the health facility staff and worked with each facility team to review key QI concepts and progress towards achieving the QIC aim.
Health facility QI teams used time series analysis using run charts for prospective and real-time analysis of their progress to the aim. Feedback from the ICAP staff making supportive supervision visits indicated that this use of run charts was a powerful tool that increased facility staff capacity to analyse data variations over time and their confidence in understanding how their change ideas affected the data. Between learning sessions and site support visits, facility QI teams prioritised their change interventions, and performed swift, iterative, and ongoing tests of change to implement and assess the best practice using PDSA cycle methodology. This PDSA cycle approach allowed facility staff to continuously build their own capacity for QI and VL system improvement during their daily practical experiences.28
Development of change intervention package for dissemination
On completion of the QIC in September 2020, aggregate results and a compilation of the most successful change interventions (box 1) were shared at a virtual stakeholder meeting convened with NASCOP, Provincial and County Health Team officers, CDC Kenya, HRSA, PEPFAR Kenya agency representatives and IPs. After compiling, categorising and documenting successful change ideas in detail, a draft ‘change idea package’ was presented to stakeholder meeting participants, who divided into groups to actively review the draft document. Participants interrogated the draft change idea package, and helped in editing, categorising and summarising findings using language easily understood by peers. Criteria for a change intervention to be considered successful and to be included in the change package involved: (1) the health facility QI team determined that the change idea directly led to improvement towards achieving the project’s aim based on PDSA cycle methods and analysis, (2) the same intervention was implemented in more than 50% of health facilities, (3) the intervention was implemented and sustained for more than 6 weeks, (4) the intervention was presented during the learning sessions for peer-to-peer sharing and review, and (5) the intervention was presented as a ‘best practice’ and peer reviewed during a change intervention review meeting held in September 2020. During the change intervention review meeting, key leadership stakeholders came together to apply these criteria to each change intervention implemented at the site level.
QIC successful change interventions
Improved documentation and viral load results management
Routinely update client contact information in both the electronic medical record and client file using a Locator Information Tracking tool
Create a separate filing area for AYPLWH with UVL files to improve file access and retrieval
Conduct weekly review of the laboratory tracking log, HIV VL register, client file and EMR to confirm all AYPLWH with UVL are receiving all recommended interventions
Indicate the specific dates VL result are received from the lab and documented in registers
Appoint VL focal persons to oversee results tracking and documentation
Encourage remote sample logging and onsite access of the NASCOP VL website
Develop VL results management standard operating procedures
Schedule 30-day follow-up appointments for all clients following VL sample collection before providing ART
Clinic flow process improvements
Generate phone calls and mobile phone text reminders for AYPLWH with UVL a day before their scheduled appointment
Synchronise clinic appointment dates between clinicians, adherence counsellors and case managers to curb missed opportunities
Offer increased number of AYP focused clinic days during school holidays and mid-term breaks
Restructure clinic booking for routine AYP into different age bands (10–14, 15–19 and 20–24 years)
Provide clinic days for dispensing multi-month ART during school holidays and breaks
Form AYPLWH with UVL clinic days and include support groups for that day
Affix colour-coded stickers on appointment cards of UVL clients to ensure that each client receives all their required interventions on the same day
Clinical care management
Ensure that all AYPLWH with UVL have been assigned a case manager who is responsible for coordinating care and ensuring ongoing clinical care follow-up
Conduct weekly multidisciplinary team meetings for case management of each individual AYPLWH with UVL to discuss progress and methods to address challenges
Use AYPLWH peer mentors to lead support group and adherence
Pair AYPLWH with UVL with peer champions who demonstrate ART adherence and viral suppression
Plan transition and graduation between different age bands from childhood into adulthood
Conduct and document pill counts during all clinic consultations
Conduct home visits and support for all AYPLWH who have adherence barriers and other individual challenges
Involve available psychologists in EAC sessions and support groups, as possible
Client and community education
Provide sexual and reproductive health education, sexuality, prevention of mother to child transmission, and safe sexual practices for AYPLWH
Conduct school mapping and provide support to the school staff assisting each AYPLWH taking ART in school
Conduct disclosure assessments using expressive therapy tools to empower AYPLWH to disclose their status as needed
Procure wrist watches for AYPLWH with UVL and set reminder alarm for taking medication daily. Provide client with other options for setting self reminders to improve medication adherence
Conduct community-based stigma assessments and provide counselling for all AYPLWH in the community setting
Community engagement and caregiver support
Link AYPLWH to additional stakeholders (ie, county children’s department, county social work department, children’s homes and other implementing partners dealing with children) to ensure all AYPLWH have access to the appropriate services
Involve caregivers during AYPLWH EACs sessions
Form caregiver support groups during AYPLWH clinic days
Offer assisted disclosure sessions to caregivers of AYPLWH
Pair caregivers of AYPLWH with UVL for peer-to-peer caregiver support
Empower AYPLWH with unsupportive caregivers on positive living and identifying an alternative supportive guardian, as possible
Results
All 22 health facilities participated in the QIC for the full 17-month intervention period. Learning sessions were well attended, with a range of 60–70 participants per session, representing 75%–88% of the approximately 80 people participating on QIC teams. The QIC teams tested interventions throughout the 17 months, including locally adapted interventions designed to improve on system drivers related to clinic AYP-based services, clinical care, client and caregiver education, community engagement, and VL results management, and data quality (box 1).
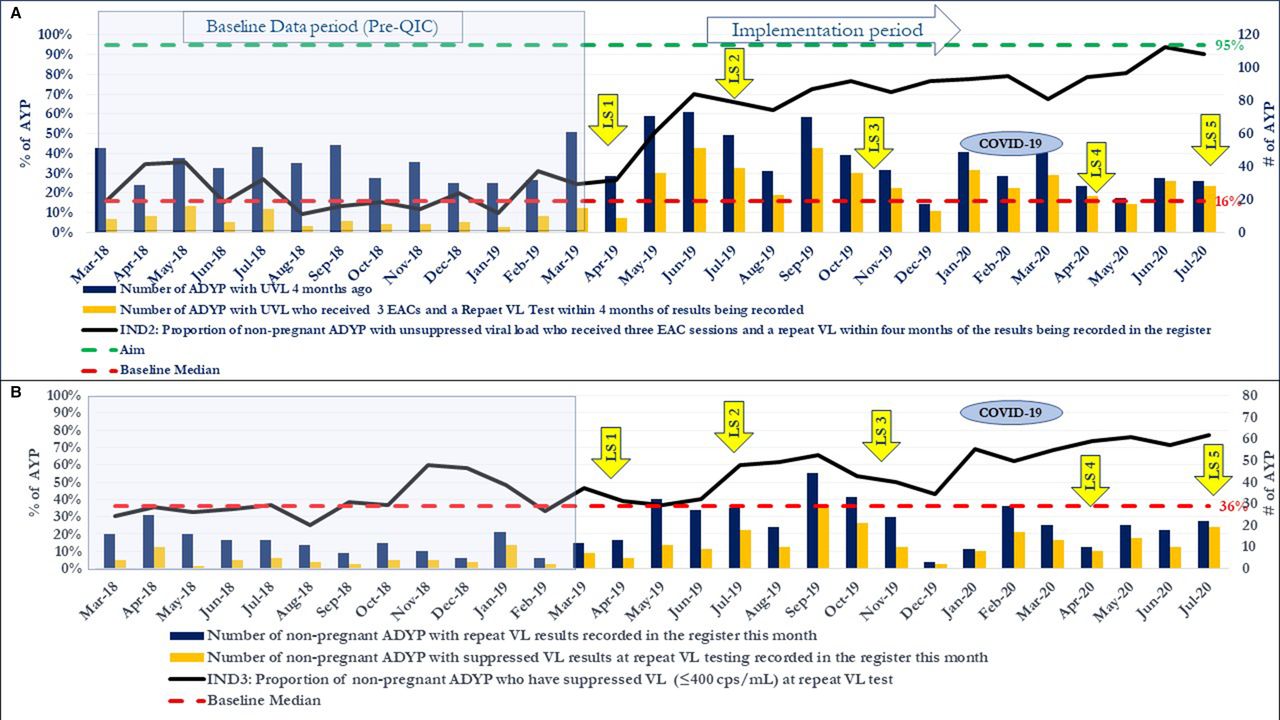
As planned, the QIC tracked change over time using run charts at each facility. These data were combined into cross-cutting run charts depicting aggregate performance of the 22 health facilities over time along with 12 months of pre-intervention baseline data. Figure 2A illustrates the change in the QIC primary indicator: proportion of AYPLWH who had three EAC sessions and repeat VL testing within 4 months of documented UVL. Figure 2B illustrates the proportion of AYPLWH who were virally suppressed at retesting over time.

(A) Completion of three EAC sessions and repeat VL test within 4 months and (B) proportion of AYP on art with UVL who had VL suppression at repeat VL testing. AYP, adolescents and young people; EAC, enhanced adherence counselling; LS, learning session; UVL, unsuppressed viral load; VL, viral load.
In addition to describing improvement as a continuous variable using run charts, we compared aggregate performance prior to the QIC to aggregate performance during the QIC intervention period, using median scores for March 2018 to February 2019 as the baseline and median scores during the 17-month implementation period (from March 2019 to July 2020) as the comparison. Using these dichotomous variables, we found that provision of three EAC sessions within the required 4-month period improved from 64% (n=479) at baseline to 94% (n=755) during implementation. Provision of the three EAC sessions and repeat VL testing within the 4-month period improved from 16% (n=479) at baseline to 73% (n=755) during implementation. VL resuppression on repeat testing improved from 34% (n=273) at baseline to 62% (n=710) during implementation. The proportion of non-pregnant AYPLWH on first-line ART regimen whose ART regimens were switched within 2 months of the results being recorded in the register improved from 58% (n=48) at baseline to 94% (n=128) during implementation.
We explored the statistical significance of the change in the primary aim using Wilcoxon signed-rank testing, which demonstrated that at the 95% confidence level there was sufficient evidence to conclude that the observed difference between baseline and implementation periods for the median percentage of AYPLWH on ART with UVL who received three EAC sessions and a repeat VL test within 4 months was statistically significant (T=7; Tcrit=58 ; p<0.05, two-tailed). The Wilcoxon signed-rank statistical test is suitable for these datasets, as paired median values were being compared and there is a normality assumption for each of the datasets.29 Causation cannot be demonstrated in this study due to the nature of the project; however, the Wilcoxon signed-rank statistical test results add to the confidence in interpreting the project results. Available evidence suggests that the observed increase was correlated to the interventions implemented during the QIC.
We assessed the time it took each health facility to reach the primary aim of 95% of AYPLWH on ART with UVL receiving three EAC sessions and a repeat VL test within 4 months. We analysed that it took an average of 1.9 months for QIC sites to reach the primary aim (median 1 month, range 0–7 months). On average, QIC sites achieved the aim for 10.7 out of 17 months of implementation, 63% of the time (median 11 months, range 5–16 months). The longest average consecutive number of months where QIC sites maintained the aim was 5.5 months (median 4.5, range 1–14). Nine QIC sites had 60% and more of AYPLWH achieving suppression at repeat VL testing for at least 7 out of the 17 months of implementation.
On review of the balancing indicator, minimal stockouts were noted during implementation, and no other unintended consequences were identified at supportive supervision visits, quarterly learning sessions or the summative change package discussions.
As noted above, quality assurance verifications were built into the database and systematically reviewed; any errors identified were immediately addressed with health facility QI teams. Site level data were also verified for accuracy by the ICAP Kenya team during every facility monthly supportive supervision visit. Register data were triangulated between the ART register, the UVL register, the national VL database and the QIC summary form. At several sites, missing data and data inconsistencies were observed when comparisons were made between the ART register, the UVL register and the VL national database. Routine and repeat VL test results not being returned from the national lab was the most frequently observed data quality issue. Missing data can be seen in the ongoing lower numerator data in figure 2B throughout both the baseline and implementation periods. In response, multiple facility teams designed change interventions to address documentation issues which are described in box 1. NASCOP and county health leaders were engaged with the national lab leadership regarding findings and missing VL test results.
Lessons and limitations
Robust and sustained improvements followed the first learning session and progressively increased after each subsequent learning session. Figure 2A demonstrates the immediate and rapid increase in the proportion of AYPLWH who had three EAC sessions and repeat VL testing within 4 months of documented UVL, especially after the first learning session. The baseline data (from March 2018 to February 2019) shared for comparison purposes demonstrate consistent suboptimal performance over a full 12-month period. While there was a decrease in the progress to the target with the onset of the COVID-19 pandemic, after April 2020 the aggregate data demonstrate continued improvement towards achieving the target in June 2020. Figure 2B illustrates slightly slower progress in achieving success with VL suppression after retesting.
We conclude that the QIC approach itself, rather than any one change idea led to performance improvement, and that the combination of baseline training, quarterly QIC learning sessions, supportive supervision visits, and the facility QI team’s use of QI methods to adapt, test and scale interventions using PDSA cycles contributed to institutionalisation of QI methods and improved capacity to improve health service delivery processes.30 In more granular analysis, we found that the QIC success can also be attributed to the quality challenge selection and the QIC aim selection. Our findings are supported by other studies which found that project design is essential for the effectiveness of the QIC approach.21 30 31 A systematic review demonstrated that QICs have a higher rate of success when they identified a quality challenge related to a relatively distinct service delivery system and a clear know-do gap between accepted standards of care and poor performance at the patient level.32 Additionally, we surmise that the face-to-face and virtual learning sessions contributed significantly to the success of the QIC which is apparent in figure 2A,B, as improvement is noted immediately after the first learning session and improves overall throughout implementation with some decrease in performance noted after the third learning session which is resolved with ongoing improvement between the fourth and fifth learning session. At the health facility level, local adaptation and ownership of change interventions was critical for success. We found that the power of the group learning sessions lies in critical peer-to-peer connections, shared experiences and friendly competition which provides social incentives and extrinsic motivation for teams to improve performance and for diffusion of innovation.32 While individual change ideas may be the proximal cause of improvement, we conclude that the QIC method itself is the underlying engine of sustainable change.
Studying QI projects and communicating their results can be challenging, because QI methods are applied in a wide variety of real-life settings in all their diverse complexity and are not primarily directed towards producing generalisable knowledge. We found that some facility teams had difficulty clearly and succinctly describing their ongoing change intervention adaptations and PDSA cycles during site visits and learning sessions. While teams became proficient at quickly identifying challenges and designing interventions that led to real-time improvements, precise documentation of PDSA cycle actions and decision points remained a challenge. For example, an example of iterative change ideas disseminated among the 22 health facilities included efforts to ensure that EAC sessions were well attended, despite multiple individual, biological, social and contextual barriers beyond the control of health services. Teams designed diverse innovations such as engaging with school programmes, ensuring caregiver support during EACs, and designing peer-based programmes (box 1), tailoring these change interventions for their specific operational needs using PDSA cycle methodology and documenting their work on PDSA worksheets. However, several QIC teams had trouble consistently and efficiently using the right amount of detail to describe how they specifically tailored and implemented interventions. Peer-to-peer sharing during the learning sessions allowed for ongoing clarifications and discussions, but these informal exchanges were occasionally difficult to document and track.
Institutionalising QI methods into daily routine operations at the health facility and leadership levels is a critical element of sustaining improvements.19–21 A few of the health facilities did not achieve the aim consistently and demonstrated less improvement than other higher performing health facilities throughout the QIC. On analysis, we found that these facilities served more complex and mobile populations, had poorer performance during the baseline period, and typically had health workforce challenges such as suboptimal staffing levels, high staff turnover on the QIC teams and frequent changes in leadership.
The advent of the COVID-19 pandemic during the QIC brought sudden and significant health system obstacles, interruptions in care and gaps in service delivery, presenting new challenges for HIV services both globally and in Kenya.33 In addition to the direct impact of the pandemic on health worker and patient health, the necessary responses and infection prevention and control measures included reorganisation of clinic procedures, shifting of staff roles and responsibilities, clinic closures, reduced service availability, physical distancing, bans on in-person workshops and other measures put in place to combat transmission.34 Motivated to sustain progress and leverage the ongoing progress, ICAP, NASCOP and CHS rapidly pivoted to virtual support for activities. The final learning session and two stakeholder meetings were convened virtually, and Kenya’s prior investment in internet connectivity and remote learning infrastructure enabled ICAP to provide weekly virtual supportive supervision sessions with each facility QI team via the online Zoom platform. The data team performed monthly virtual report validation and verification exercises were performed as data were collected and uploaded to DHIS2. We found the QI teams responded well to the transition to the virtual model and the QIC activities transitioned nearly seamlessly. Progress towards the aim remained high and was sustained for the rest of the QIC.
Data quality issues related to receiving and recording repeat VL results in the appropriate ART and UVL registers remained a challenge throughout the QIC. Health facilities were able to generate site level change interventions to ensure a timely follow-up with the national lab for VL results; however, the QIC teams had little influence over process and system breakdowns after the VL sample left their facility. Despite this challenge, ICAP staff did find that recording the VL results and attempts to access VL results did improve throughout implementation. Improved data quality could also have contributed to the improvement demonstrated on the run charts in figure 2.
When attributing improvements to the QIC, this project shares several key limitations with most QI initiatives, including multiple other QICs that ICAP has supported in LMIC.35–40 First, the fact that site-level activities and interventions were deliberately flexible, adaptable and changed over time in response to real-time data makes analysis of ‘fidelity’ unhelpful. Second, the absence of control or comparison sites means that external factors may have confounded our analysis.41 Nonetheless, we believe the results and implementation experience we present are important and useful to share with the wider international community.
Conclusions
We describe the design, implementation, evaluation and results of a QIC designed to improve VL test result utilisation and viral suppression among AYPLWH who have UVL at 22 health facilities in Eastern Kenya. We assessed QIC impact using an interrupted time series analysis, studied the practical application of the QIC approach in a real-world setting and report on our findings for the wider global audience. The intervention was correlated with significant, rapid and sustained improvement in VL test result utilisation and achievement of project aims during a period that included the challenges of the COVID-19 pandemic in Kenya. Despite the attribution challenges typical of QI projects, these results are consistent with the published literature, which shows that well-designed QICs are often successful in enabling facility-level QI teams to design, test and scale contextually appropriate interventions that improve the quality of health services.22 24 25
Data availability statement
Data are available upon reasonable request.
Ethics statements
Patient consent for publication
Ethics approval
Not applicable.
Acknowledgments
We would like to acknowledge the leadership and technical expertise provided by Michael Kamenju, Nicholas Muhindi, and Peter Mutuku of County Health Management Teams in Eastern Province, Kenya. We would like to acknowledge the Kenyan Ministry of Health and National AIDS/STI Control Programme, County and sub-County Health Management teams, the US Centres for Disease Control and Prevention (CDC) in Kenya, the US Health Resources and Services Administration (HRSA), the Centre for Health Solutions (CHS) and the project staff for their tireless and dedicated efforts and for which this project would not be possible, and to pay tribute to the courage and resilience of adolescents and young people living with HIV.
References
Footnotes
Contributors All authors discussed and collaboratively agreed upon the design, results, analysis and planning of the manuscript. GD wrote the manuscript in collaboration with all authors, and led the project, conceptual framework and overall analysis of data. SA led the project data collection in Kenya and led the analysis while significantly contributing to writing the results and discussion sections and reviewing the manuscript. MH designed the concept of the project in Kenya, provided critical revisions, and final approval of the version to be published. IL led the project data collection in Kenya and significantly contributed to the analysis with interpretation for writing and reviewing the manuscript. RM led the project concept development in Kenya, QI activities within the collaborating sites, final change intervention analysis and significantly contributed to the writing and reviewing of the manuscript. CN designed the concept of the project from the Kenya Ministry of Health, provided critical revision, and final approval of the version to be published. DN led the project concept development in Kenya, QI activities with the collaborating sites, final change intervention analysis and contributed significantly to writing and reviewing the manuscript. FT designed the concept of the project in New York, provided critical revision, and final approval of the version to be published. AW led the project concept development in Kenya, QI activities with the collaborating sites, final change intervention analysis and significantly contributed to the writing and reviewing of the manuscript. LW designed the concept of the project from the headquarter level, provided critical revision, and final approval of the version to be published. MR is the study guarantor and accepts full responsibility for the work and/or the conduct of the study, had access to the data, and controlled the decision to publish. MR also conceived the original project concept and design, overall project leadership and supervision, and provided critical writing development, revisions and final approval of the version to be published.
Funding This project was supported by the President’s Emergency Plan for AIDS Relief (PEPFAR) through the United States Government Health Resources and Services Administration (HRSA) Quality Improvement Capacity for Impact Project (QICIP) Award #U1NHA285550100 (PI: Miriam Rabkin).
Disclaimer All views and contents are the responsibility of ICAP, and do not reflect the official position of the Health Resources and Services Administration.
Competing interests None declared.
Patient and public involvement Patients and/or the public were not involved in the design, or conduct, or reporting or dissemination plans of this research.
Provenance and peer review Not commissioned; externally peer reviewed.