Article Text

Abstract
The Stem Cell Donation and Transplantation Department at NHS Blood and Transplant (NHSBT) facilitates unrelated donor haematopoietic stem cell transplantations for patients with life-threatening haematological malignancies or other blood diseases. Donors must be screened for infectious disease markers (IDMs) prior to donation. The purpose of IDM testing is to assess whether the donor currently has, or previously had, an infectious disease that could be transmitted to the recipient. The turnaround time (TaT) from sample collection to the return of IDM results is important to transplant clinicians and their patients. NHSBT has a target TaT of 80% within seven calendar days. Our initial analysis showed us that we failed to meet this in any week in the previous year, and our service was neither efficient nor consistent, so there was considerable improvement potential.
This quality improvement (QI) project aimed to improve the TaT of the IDM reporting service. We tested three change ideas through four Plan-Do-Study-Act (PDSA) cycles. We collected data on TaTs from our laboratory information management system (LIMS) and updated our statistical process control charts after each PDSA cycle. Over the course of the project, we reduced the mean TaT from 8.9 days to 5.5 days and increased the proportion of samples reported within the 7-day benchmark from 50% to 89%, reaching the key performance indicator (KPI) target.
Conducting this project was a rewarding experience. Although we encountered unanticipated technical issues during PDSA experiments, and we found that some change plans were not as effective in improving the KPIs as we expected, the improvement by the end of the study period was substantial. This QI project enabled us to meet our TaT targets and, ultimately, help ensure that our patients receive timely transplants. It suggests that QI may have wider applications across our part of NHSBT.
- Control charts/Run charts
- Efficiency, Organizational
- Diagnostic Services
- Transplantation
- Process mapping
Data availability statement
Data are available upon reasonable request.
This is an open access article distributed in accordance with the Creative Commons Attribution Non Commercial (CC BY-NC 4.0) license, which permits others to distribute, remix, adapt, build upon this work non-commercially, and license their derivative works on different terms, provided the original work is properly cited, appropriate credit is given, any changes made indicated, and the use is non-commercial. See: http://creativecommons.org/licenses/by-nc/4.0/.
Statistics from Altmetric.com
- Control charts/Run charts
- Efficiency, Organizational
- Diagnostic Services
- Transplantation
- Process mapping
Problem
The Stem Cell Donation and Transplantation Department (‘the Department’) provides haematopoietic stem cells obtained from donors to patients in need at UK and international transplant centres (TCs).1 The Department is licensed by the UK Human Tissue Authority, conforming to its codes of practice and is accredited by the World Marrow Donor Association.
Donors must be screened for infectious disease markers (IDMs) prior to transplant. A positive microbiology status, as defined by the guidelines for blood transfusion services in the UK, may not disqualify a donor from consideration; however, all relevant IDM testing results and donor history must be immediately presented to the TCs for their review and agreement. The Department provides expertise to identify volunteer potential unrelated donors and assess their suitability by IDM testing. Reducing the time taken from diagnosis to transplant has been recognised as one of the most important factors for success in haematopoietic stem cell transplantatio (HSCT).2–5 NHSBT, therefore, has a clinical services key performance indicator (KPI) target that 80% of the IDM screening requests should be reported within 7 days.
Analysis of historical data showed us that our mean performance on this KPI was only 50%, a long way short of this target. We, therefore, embarked on a quality improvement (QI) project with the goal of reaching the target within 6 months (by September 2021), using the Model for Improvement and its Plan-Do-Study-Act (PDSA) cycles.6
Background
HSCT remains an important curative treatment for life-threatening haematological malignant and non-malignant diseases, and the demand for HSCT continues to increase.7 Ensuring the quality of the HSCT product without transmittable risk to the recipient continues to be of paramount importance.8 Regulatory agencies and accreditation bodies, such as the Human Tissue Authority, the World Marrow Donor Association and the Medicines and Healthcare products Regulatory Agency, have facilitated the availability and safe provision of human cells, tissues and cellular-based and tissue-based products, not only to local healthcare providers but also through international exchange.9–11
Similar to blood transfusion, HSCT transplantation has the potential to transmit a wide range of blood-borne diseases, which could have a severe effect on the recipient. Hepatitis B,12 hepatitis C,13 human T-lymphotrophic virus type 1 (HTLV-1) and type 2 (HTLV-2),14 15 Chagas disease,16 17 malaria18 and syphilis19 have all been reported to be transmitted by HSCT. Organisations facilitating HSCT must have available appropriate screening measures or tests to identify the potential donor’s risks of having been exposed to or possible infection with such diseases.
IDMs performed at NHSBT are Hep B surface antigen, antibody to Hep B core antigen, hepatitis B virus (HBV) nucleic acid testing (NAT), syphilis, antibody to Hep C, hepatitis C virus (HCV) NAT, HIV-1 and HIV-2 NAT, combined antibodies to HIV-1 or HIV-2 and P24 antigen, anti-HTLV-1 and −2, cytomegalovirus (CMV) IgG, CMV IgM, toxoplasmosis IgG, toxoplasmosis IgM, Epstein-Barr virus (EBV) IgG, EBV IgM, HEV NAT and SARS-COV-2 PCR.
The Department relies on two NHSBT labs to perform the IDM testing: Manchester Testing Laboratory and the National Transfusion Microbiology Reference Laboratory (in London). Samples that are reactive on the screening tests performed by Manchester will be referred to the National Lab for confirmation of reactivity. The Department’s senior management team oversees the IDM testing processes at the two labs, aiming to provide timely and clinically relevant results to TCs to guide the management of IDMs.
Figure 1 shows a high-level process map of the ‘as-is’ or ‘current condition’ (prechange) IDM service process flow. The IDM reporting process starts with booking in of a sample to our main LIMS, Hematos and the first stage of end-to-end sample reconciliation using a combination of an automated daily Business Objects report and the paper-based worklist kept in the lab.
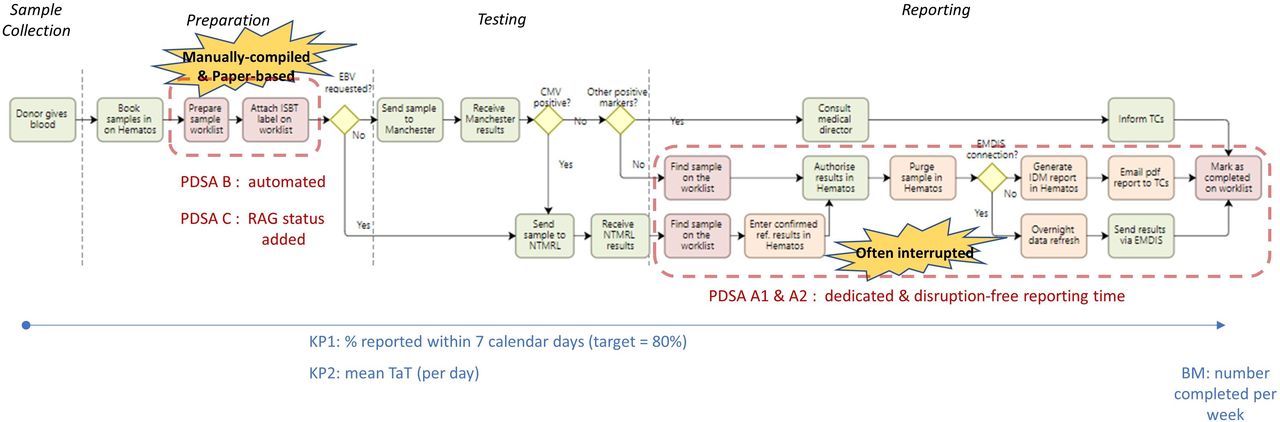
Shows a high-level process map of the ‘as-is’ or ‘current condition’ (pre-change) infectious disease marker (IDM) service process flow. The IDM reporting process starts with booking in of a sample to our main LIMS, Hematos and the first stage of end-to-end sample reconciliation using a combination of an automated daily Business Objects report and the paper-based worklist kept in the lab.
Testing is generally undertaken at the Manchester lab. However, a fairly new issue in HSCT is prevention of diseases associated with EBV.20 The Manchester lab is not yet able to test for EBV infection, so if this testing is requested by the customers, we refer the sample to the National Lab. Samples tested in Manchester with any inconclusive results during the IDM testing process are also referred to the National Lab.
If the CMV test result from the Manchester lab is negative, and all other markers are negative and complete, one of the Department’s clinical scientists authorises the results and purges the sample in Hematos. Another IT system used in the Department is European Marrow Donor Information System (EMDIS), which allows us to exchange information with our national and international customers electronically and securely. Ninety per cent of our customers are connected with us via EMDIS. For EMDIS-connected partners, we have to wait for the overnight data synchronisation between Hematos and EMDIS and then report the IDM results the next day. For non-EMDIS partners, we have to create the IDM report manually in Hematos, save it as a pdf and email this pdf report to our customers. After reporting, we finally mark the IDM reporting process as complete on our paper-based worklist.
If the CMV test result from Manchester is positive, the donor blood sample is referred to the National Lab for confirmation of reactivity, since CMV is an important factor in donor selection during HSCT.21 We add the CMV reference testing examination in Hematos and manually transcribe the results to EMDIS to report the preliminary IDM results to TCs. For non-EMDIS partners, we have to follow the same non-EMDIS process as above to report the preliminary results. Samples in this condition are marked as partially completed on our paper-based worklist; we report the confirmed CMV status once results are received from the National Lab to complete the process.
A non-CMV-positive microbiology status (such as HIV, HBV, HCV, HTLV) must be communicated to the Department’s Medical Director, along with the latest donor screening responses and the donor’s contact details. Once our Medical Director advises us on how to proceed, we immediately notify the TCs of all relevant IDM testing results and donor history for their review and agreement.
Quick turnaround time (TaT) from sample collection to the return of IDM results is important to transplant clinicians who assess the transplant treatment options and make decisions. Recent work shows the potential for QI projects to reduce waste and so reduce TaT in laboratory-based healthcare science in the NHS,22 and the approach is being used effectively in other parts of NHSBT.23 24
Measurement
Our main KPI (KP1), set by NHSBT for our service, is the percentage of IDMs reported within 7 days, with a target performance level of 80%. It is, of course, possible to miss data patterns and impacts of changes within the aggregate nature of percentage-achievement metrics, so it usually useful to also consider actual performance on a real scale.25 So, here we add KP2: the mean throughput time of samples reported on a day. Performance may also be affected by the workload, so we also consider the number of samples reported (per week) as a balancing metric.
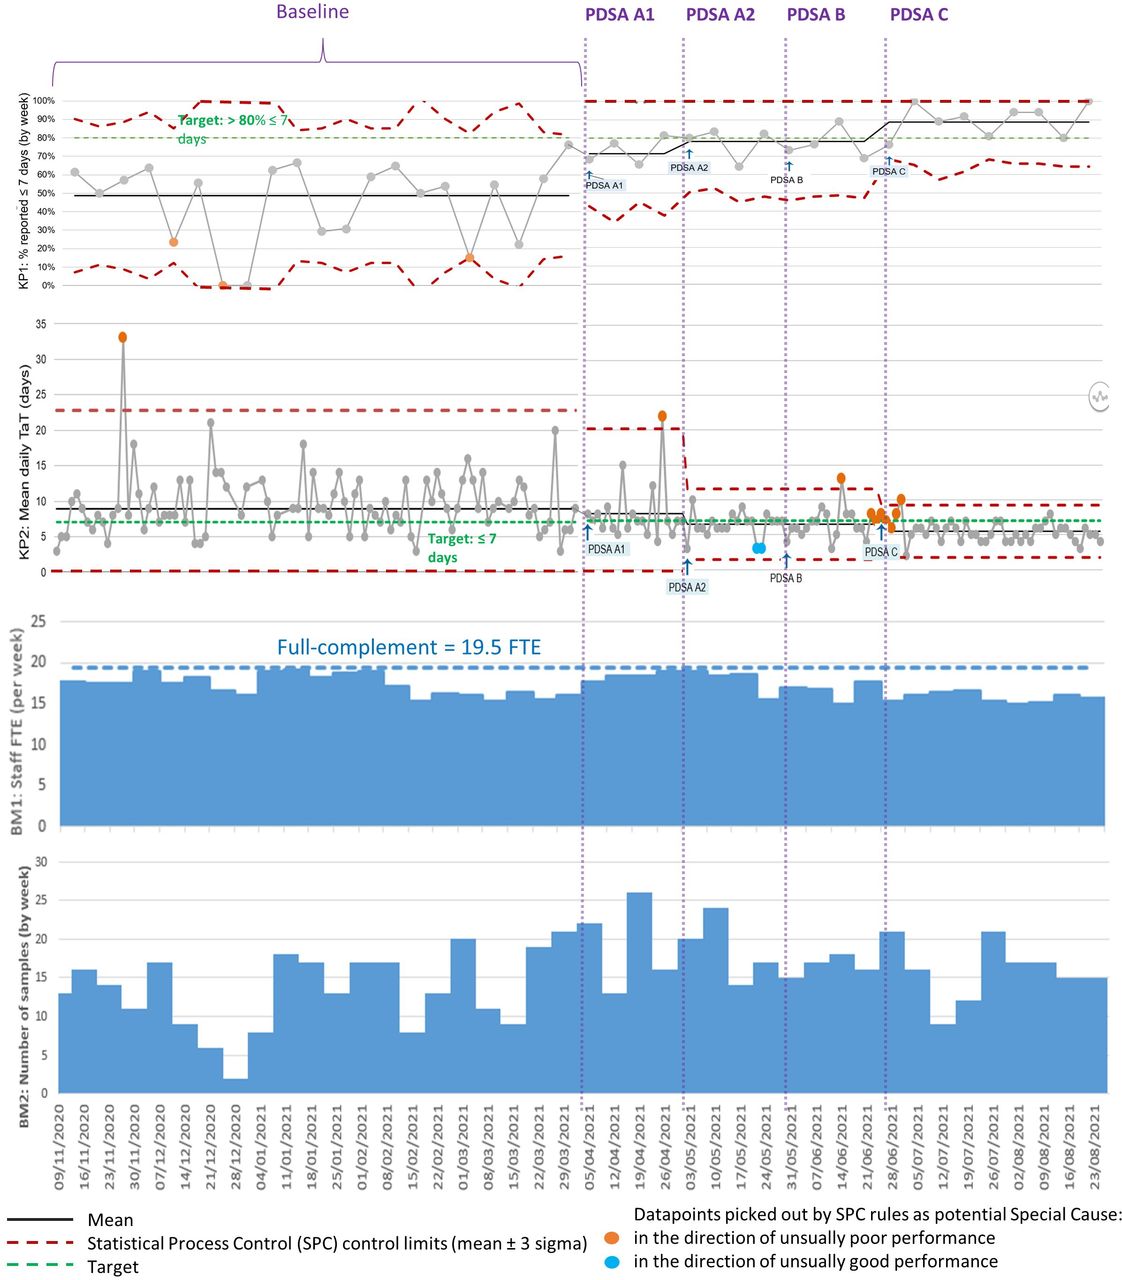
We examined a year of past TaT performance data (1 April 2020 to 31 March 2021) on these metrics. This included 541 test requests. In figure 2, the left-hand side of the statistical process control (SPC) chart25 shows the most recent 21 weeks of these data as a baseline, as representative of the whole year. (We use the NHS SPC tools,26 which have a limit to how many datapoints can be entered; plus the SPC pattern-detection rules become less useful when the number of datapoints is very large since the likelihood increases of apparent patterns arising from randomness (false positives).27)

Main performance metrics and balancing metrics over baseline and four cycles of PDSA. Graphics often do not come out well in the proofing system. This is therefore a pdf version attached as a SUPPLEMENTARY FILE—this is for review purposes only, not publication.
As is seen in figure 2, we failed to meet the KP1 target (80% within 7 days) in any week, and the (weighted) mean performance was 50%, varying widely (from 0% to 72% in a week). On KP2, the mean daily TaT was 8.9 days, again with a very wide set of process limits. Within these daily means, the extreme individual sample TaTs were 2 and 136 days.
Given that, as above, we have a diverse variety of test types and results, we were aware that the poor performance might have been driven by the more complex cases. We divided the large historical sample into ‘straightforward’ versus ‘complex’ cases, classifying 72% as straightforward, where straightforward means that all IDM markers were negative, thus no referral steps were required. Of the cases taking longer than the 7-day target, we found 74% were from the ‘straightforward’ category—so there was no relationship between complexity and breaching the TaT target. A back-of-the-envelope calculation suggested that if these ‘straightforward’ cases had been done in the 7 days, then overall performance would have been 88% (well within the target). Thus, the poor performance is routine rather than dominated by complex cases.
The study took place during the COVID-19 pandemic, so staffing issues could have been a particular confound. Throughout the period, the headcount was 19.5 full-time equivalent staff: 19 full time and one part time. Only two members of staff became infected with COVID-19 during the study period, and this was in the last month of the data shown. The Trust has an accurate HR IT system, since all leave requests and sickness must be signed off by managers. We used these data to plot a balancing metric of actual staff working hours per week (BM1, see figure 2). We can see there is no indication that staffing was a material contributor to improved performance; staffing during the most recent period (of sustained good performance) is as low as it has been at any point in the study period.
The other balancing metric, BM2 (bottom of figure 2) shows the weekly workload and also exhibits little relationship with performance. The worst performance coincides with the low demand over Christmas—New Year when there were two successive weeks of relatively low staff working hours.
Design
The lead author (YL) led this QI project, starting with a socially distanced departmental QI workshop in April 2021 to review the baseline data and to discuss the next steps. Staff were keen to improve our IDM service and suggested ideas for improvement. A smaller team of scientists, an operations and planning manager and a business intelligence support engineer, was established,and met every 4 weeks to evaluate the PDSA results from the current cycle and formulate plans for the next.
Our ‘as-is’ or current state process map (figure 1) also shows our process-flow waste analysis. We highlight waste due to our manually generated and paper-based worklist system (shaded red) and also currently necessary but non-value adding steps28 29 (shaded orange); the latter are IT processes that could potentially be improved, but changes here are not deliverable in the short term.
We used an Ishikawa/fishbone diagram30 to capture potential root causes of the problems. We next generated change ideas, each addressing one or more root cause and rated each on ease of application and expected impact on the KPIs. We ended up with a set of three ideas we judged to be changes which we could trial in the 6-month project window.
The Department is a dynamic and busy environment. In root cause analysis, we identified that when working on IDM reporting, scientists were frequently interrupted by colleagues when other urgent tasks cropped up or to attend to telephone calls from test referrers. A body of research shows such task switching reduces knowledge workers’ productivity through mechanisms such as errors, stress, attention residue and refocusing (c.f. mental ‘setup time’).31 32 Spending too much time in such reactive mode interrupts the flow of regular work. Other, related, productivity drains include attempting to multitask, procrastination and self-distraction (including continual reprioritisation); the core issue has been identified as attention management.33 A suggested counter-strategy is time-blocking.34 Change idea A was to try to apply this to the reporting step: to set aside regular, dedicated time blocks when scientists were to be undisturbed.
Process analysis also revealed that reporting scientists rely heavily on the sample reconciliation worklist. This was created manually and requires the International Society of Blood Transfusion label for each sample to be attached to the worklist for audit trail purposes. Change idea B entailed replacing this manual process with automatic generation of the list from the laboratory information management system (LIMS). We discussed this with members of our quality department, who were happy to replace the paper worklist with an electronic version as all samples and the corresponding results are stored in our LIMS database, which allows for traceability.
Prior to this project, we did not have any prioritisation strategy for IDM samples—we were not reporting KPIs on them and just went through the paper worklist without regard for their TaT. Once we had a worklist generated by the LIMS, we realised that we could use it to help staff prioritise work in order to reduce the chance of a particular sample breaching the target TaT. We could add a Red-Amber-Green (RAG) ‘traffic light’ status column to provide an overview of the performance and actions or interventions needed. RAG status is commonly used throughout NHSBT. This status could be generated by applying simple rules to timestamp data in the LIMS. This became Change Idea C. Ideas B and C have been reported to be valuable in another NHS lab.22
Some further change ideas to remove other manual processes were beyond the time scope of our project time (and aim), for example, removing manual data transcription by modifying Hematos and EMDIS would require formal IT system change requests. These ideas were parked.
Strategy
We tested and refined the three change ideas over four PDSA cycles.
Change idea A: establish quiet IDM reporting hours
The first intervention was to introduce two 1-hour periods (morning and afternoon), tested in cycle A1. Though the results were encouraging, the reporting staff fed back that two quiet periods did not feel efficient: it took them some time to settle in for reporting (eg, logging in to the IT systems and having the sample reconciliation paper-based worklist ready), so two periods meant two setup periods. They suggested a single 2-hour period. This was tested in cycle A2. During A1, some colleagues frequently forgot the quiet hours and interrupted reporters to ask for help. For A2, we also reminded staff about the new policy.
Change idea B: convert the manual paper worklist to an automated electronic version
An NHSBT business intelligence support engineer helped us to design the electronic worklist and created the System Analysis Program (SAP) BusinessObjects query script to run at 12:50 every day to generate an Excel format worklist from the LIMS and email it to our group inbox. We tested this in the next PDSA (cycle B).
Change idea C: add a Red/Amber/Green (RAG) status column to the new electronic worklist
An NHSBT business intelligence support engineer again enabled this through BusinessObjects. The RAG status is calculated using the number of days elapsed between the sample collection date and current time (query run time). A duration of less than 5 days is flagged green, between 5 and 7 days amber and more than 7 days red. Testing this was our fourth and final PDSA (cycle C).
Results
Our four PDSA cycles used data from the LIMS between 6 April 2021 and 29 August 2021: 364 samples in total (after three were excluded having arrived in an unfit state for testing). We used our SPC template tools to analyse these data on the KPIs. Table 1 summarises the PDSA cycles.
Improvement cycles
Change idea A
Data were collected for 4 weeks (see PDSA cycle A1 section of figure 2). In cycle A1 (testing two 1-hour quiet periods), our percentage reported within 7 days (KP1) increased from the baseline performance of 50% to 71%, with mean TaT (KP2) reduced from a daily average of 8.9 days to 8.1 days. The refinement to a single 2-hour quiet period per day (cycle A2, lasting another 4 weeks) improved these to 78% and 6.4 days. We were very impressed that this straightforward change had a considerable effect on our TaTs.
Change idea B
The electronic worklist was then introduced and data collected for the next 4 weeks. Our performance declined a little (77% and 6.7 days), but this was not a significant change. Counter to expectations, change idea B did not appear to impact our metrics. Two technical issues were experienced during this PDSA cycle that may explain this.
First, reporting scientists had previously scanned the International Society of Blood Transfusion sample label on the paper worklist to our LIMS to retrieve the sample results, authorise them and then prepare the report. However, in cycle B, they struggled to scan the barcode on the electronic worklist using the existing scanners—they worked but were very difficult to use. They had to be tilted ~15° against the screen with Excel zoomed to around ~125%. Reporting staff fed back that they found it much easier to type in the sample number; however, this is a 14-character identifier and they often made mistakes. We bought two new scanners, which resolved the issue (but this was expensive at £295 each).
Second, the SAP Business Objects platform was not as reliable as expected. It stopped functioning three times during cycle B, each time taking our IT department 4–8 hours to resolve. Our staff felt frustrated at this disruption to reporting and the long IT resolution times. The Head of Department raised the issue of Business Objects unreliability at the clinical services IT Development Board meeting and received assurance that reliability would be monitored and improved.
Despite the lack of material improvement in the KPIs and the technical issues, the automated worklist eliminated the need for manual administrative steps. Therefore, we agreed to adopt it as a permanent change.
Change idea C
Finally, the RAG column was added to the electronic worksheet, and data were collected for another 4 weeks. After the first week, we consistently achieved the targets (88% within 7 days vs ≥80% and a mean of 5.5 days vs ≤7 days).
A further 5 weeks of data show sustained performance, with an average of 89% within target over the whole 9 weeks. This is a very substantial improvement, but we must note that since the target lines (green) are inside the process (‘or ‘control’) limits (the red-dashed lines on figure 2), the targets could still be breached through random variation—so further improvement is necessary to make the system performance ‘capable’ (robust). To be capable, the means of the KP1 and KP2 would have to be further from the targets and/or their variations reduced.
Our department continued to remain fully operational through the COVID-19 pandemic. The balancing metric on figure 2 shows workload demand continued through the period of our project, with a material drop only over Christmas—New Year.
Lessons and limitations
Three change ideas were tried in this QI project. Not all experiments proved to be as effective in improving the KPIs as we expected. We refined idea A and ran a second PDSA cycle. Idea B revealed the need for new equipment (scanners) and better IT reliability. We could have conducted another cycle here (ie, a cycle B2), but by then, we had decided to also use the new electronic worksheet for RAG prioritisation so moved onto idea C.
This was the lead author (YL)’s first opportunity to lead a QI project, putting newly acquired QI knowledge into practice. The Model for Improvement framework proved a useful structure. In retrospect, we might have made more use of process metrics during baseline and PDSA data collection, such as logging the number and causes of interruptions to reporting.
The project provided us with the opportunity to collaborate with colleagues. Contrary to our initial expectation that the staff would be resistant to change, the team adopted the ideas quickly and contributed beyond expectations to work towards the TaT targets. Issues reported by staff were addressed effectively during the PDSA experiments, captured in meeting minutes. Another factor may have been the increase in familiarity with IT tools and general resilience and adaptability as a result of changes to working practices earlier in the COVID-19 pandemic (prior to this project) such as work from-home.
With idea C, staff members worked proactively and took action before a sample’s TaT breached the target rather than being asked to by a manager. The automated worklist with RAG status is now used as a part of our daily routine activities. It is a useful tool to visualise the performance of our IDM service. The senior management team was very impressed with the achievement and would like to expand this type of application of QI to other day-to-day clinical services.
Further reduction in manual processes which could be automated (so necessary but non-value adding) through changes to the software (via change requests) is a medium-term goal we should pursue. We would expect this to further improve performance.
Conclusion
Persevering through unexpected problems discovered through PDSA, we were able to substantially improve performance, meeting the headline KPI (KP1) and sustaining this performance. We found that the ‘attention management’ time-blocking idea of dedicated, distraction-free reporting time brought substantial performance benefits. We also found we could replicate the ideas to automate the generation of our daily worklists and also use these to warn of any tests at risk of breaching targets, and that these brought further improvements. We can now better-meet our customers’ need for timely transplants. (Though we noted that SPC analysis tells us that we have not quite reached statistically robust performance.)
The process was interesting and encouraging. It suggests that QI may have wider applications within units of NHSBT. Furthermore, we realise that QI is not a one-off effort. New issues may arise in our day-to-day operations, and the tools (such as SPC) are very useful for monitoring system behaviour and prompting further rounds of improvement to maintain and further improve high-quality and effective clinical services in our department.
Data availability statement
Data are available upon reasonable request.
Ethics statements
Patient consent for publication
Ethics approval
Not applicable.
Acknowledgments
The authors would like to thank everyone at NHS Blood and Transplant’s SCDT Department for their contribution and work on this project. YL conducted this work as part of the QI unit of the Higher Specialist Scientist Training Programme (HSST), run by Alliance Manchester Business School of the University of Manchester and the Manchester Academy for Healthcare Scientist Education (MAHSE), on behalf of the National School of Healthcare Science, part of NHS Health Education England.
References
Footnotes
Contributors YL designed the work, performed the collection, analysis and interpretation of data. YL and NP drafted the paper and reviewed successive drafts. YL is the guarantor of the work.
Funding The authors have not declared a specific grant for this research from any funding agency in the public, commercial or not-for-profit sectors.
Competing interests None declared.
Patient and public involvement Patients and/or the public were not involved in the design, or conduct, or reporting, or dissemination plans of this research.
Provenance and peer review Not commissioned; externally peer reviewed.