Article Text

Abstract
Background Infection prevention and control (IPC) is a prioritised task for healthcare workers in emergency department (ED). Here, we examined compliance with admission screening (AS) and additional precautions (AP) measures for patients at risk of infection with multidrug-resistant organisms (MDROs) by using a two-stage, multifaceted educational intervention, also comparing the cost of a developed automated indicator for AS and AP compliance and clinical audits to sustain observed findings.
Methods In the first stage, staff in the ED of the University Hospitals of Geneva, Switzerland, were briefed on IPC measures (AS and AP). A cross-sectional survey was then conducted to assess barriers to IPC measures. In the second stage, healthcare workers underwent training sessions, and an electronic patient record ‘order-set’ including AS and AP compliance indicators was designed. We compared the cost–benefit of the audits and the automated indicators for AS and AP compliance.
Results Compliance significantly improved after training, from 36.2% (95% CI 23.6% to 48.8%) to 78.8% (95% CI 67.1% to 90.3%) for AS (n=100, p=0.0050) and from 50.2% (95% CI 45.3% to 55.1%) to 68.5% (95% CI 60.1% to 76.9%) for AP (n=125, p=0.0092). Healthcare workers recognised MDRO screening as an ED task (70.2%), with greater acknowledgment of risk factors at AS considered an ED duty. The monthly cost was higher for clinical audits than the automated indicator, with a reported yearly cost of US$120 203. The initial cost of developing the automated indicator was US$18 290 and its return on investment US$3.44 per US$1 invested.
Conclusion Training ED staff increased compliance with IPC measures when accompanied by team discussions for optimal effectiveness. An automated indicator of compliance is cheaper and closer to real-time than a clinical audit.
- Quality measurement
- Education
- Infection control
- Cost-effectiveness
- Quality improvement
Data availability statement
Data are available in a public, open access repository. All data relevant to the study are included in the article or uploaded as online supplemental information.
This is an open access article distributed in accordance with the Creative Commons Attribution Non Commercial (CC BY-NC 4.0) license, which permits others to distribute, remix, adapt, build upon this work non-commercially, and license their derivative works on different terms, provided the original work is properly cited, appropriate credit is given, any changes made indicated, and the use is non-commercial. See: http://creativecommons.org/licenses/by-nc/4.0/.
Statistics from Altmetric.com
Problem
Today multidrug-resistant organisms (MDROs) are increasing in prevalence worldwide,1 2 becoming one of the largest threats to global health.3. In many European countries, MDROs remain a leading cause of community and nosocomial bacteraemia, associated with mortality and additional economic burden.4–8 In addition, new resistance mechanisms are emerging and spreading globally,9 threatening the ability of acute care hospitals to guarantee patient safety.
The emergency department (ED) is one of the main entry points of patients and therefore a potential source of MDROs in hospitals. Compliance of healthcare workers with infection prevention and control (IPC) procedures remains low on admission to the ED,10 even in the presence of patients known to be colonised or infected with MDROs. Healthcare workers’ knowledge of the risk factors associated with MDROs and the perception of their role in detecting them seems unclear.
The goal of the study was to improve healthcare workers’ compliance with best practice recommendations for (admission screening, AS) and (additional precautions, AP) for patients admitted to the ED and at risk of MDRO carriage. We had the following three objectives:
Assess the effect of a two-stage, multifaceted intervention on healthcare workers’ compliance with the application of AS and AP for patients at risk of MDRO carriage.
Understand healthcare workers’ perceptions about their role concerning AS and their knowledge of MDRO risk factors.
Develop an automated indicator for AS and AP compliance.
The study was conducted in the ED of the University Hospitals of Geneva, Switzerland, a 1700-bed public acute care teaching hospital. The ED is a 46-bed unit with 66 687 adult admissions in 201611 and 230 healthcare workers. This study and had a three-part design: a two-stage, multifaceted educational intervention; a cross-sectional survey and the development of an automated indicator (see online supplemental appendix).
Supplemental material
Background
Among patients hospitalised in an ED, the mean prevalence of healthcare-associated infection is about 7% in Europe and higher in low-income countries.12–15 Appropriately applied IPC measures, such as AS (a swab test) and AP (eg, isolation room, wearing a mask) limit the spread of MDRO infection.9 16–18 Such IPC measures are applied to all ED patients with a recent trip to a country of high MDRO prevalence or from another hospital. Given the increasing admission of patients to the ED over the recent years in Europe and in Switzerland,19 20 implementing optimal IPC measures in the ED for patients colonised or suspected to be colonised with MDROs is imperative.
Measurement
Adherence to AS was measured by a swab recorded shown in the electronic patient record (EPR), and adherence to AP was measured by direct observations in the patient zone. AP was defined as the application of a complementary specific measure in addition to standard measures (eg, isolation and special disinfection procedure).21
Design
This intervention is non-randomised and non-controlled.
Strategy
Two-stage, multifaceted educational intervention
Patients were eligible if they were admitted to the ED and if an MDRO ‘flag’22 was activated in the EPR. This visual flag is activated for methicillin-resistant Staphylococcus aureus (MRSA) and other MDROs and informs healthcare workers to check whether IPC procedures such as AS and AP are needed. MDROs were defined as bacteria that were resistant to several antimicrobial classes, including MRSA, vancomycin-resistant enterococci, Carbapenem-resistant Enterobacteriaceae, Acinetobacter baumannii and extended-spectrum β-lactamase-producing Gram-negative bacteria, based on laboratory testing.
The observation time of included patients ranged from 20 to 40 min, depending on the ease or difficulty of observing elements of AP application. In total, 162 hours was needed for 225 observations in the patient zone. To decrease the Hawthorne effect, we conducted unannounced observations and measured indirect outcomes focused on only objective results of behaviour. Observations were stopped between the two datapoints; these clinical audits were time-consuming for the IPC nurse in charge of the ED. When it was necessary to work on the perception survey, the analysis and then the delivery of courses, the IPC nurse had to temporarily stop the observations to concentrate on these tasks.
Before the intervention (November 2015), 25 observations were used to assess the correct application of AS and AP. The intervention was divided in two phases. During the first phase (December 2015 to March 2016), healthcare workers received individual coaching by an IPC nurse during the observations. Such briefings revealed variations in the perception of healthcare workers’ role regarding MDRO control, assessing potential barriers to observance of procedures. In total, 100 observations of IPC procedures were conducted in parallel to briefings. In April 2016, we performed a cross-sectional survey of healthcare workers (n=136) to assess barriers to IPC procedures and to optimise the second phase of the intervention. The second phase included a multifaceted intervention23 with two components: 10 groups of 1-hour training sessions for all healthcare workers (September to October 2016) and the implementation of a new computer-based ‘order set’ (November 2016). Training sessions targeted knowledge of emerging MDROs as well as risk factors for carriage. The order set was implemented in the EPR to help healthcare workers more easily prescribe the recommended IPC measures. It was designed to simplify AS and AP prescription for patients at risk of MDRO carriage by simply pressing some buttons that simultaneously trigger the laboratory requirements and AP prescriptions. To become familiar with the order-set, healthcare workers received individual briefings. After the intervention, observations were repeated monthly (n=125) from November 2016 to March 2017 (postintervention phase).
From the observations, we computed the proportion of correct application of AS and AP for each month. We computed the mean of the proportions and its 95% CI during the first phase and the post-intervention phase and used a paired t-test to test for significant changes. Trends in the proportions of the correct application of AS and AP were graphically described by using time-series plots.
Cross-sectional survey
Healthcare workers working in the ED (doctors, nurses, nurse practitioners, physician assistants, nurse assistants) were invited to participate in the survey. A self-administered web-based questionnaire was used to assess perceptions of roles and knowledge of MDRO risk factors. The questions were developed by the principal investigator of the study and reviewed by the people in charge of the ED and by several doctors and nurses of the Quality of Care Service as well as the ED and IPC unit. The list of MDROs and whether the MDROs needed to be screened were based on the list of Federal Office of Public Health and the National Center for Infection Control (SwissNoso) recommendations as reported in Supplementary appendix (online supplemental table S1).
Supplemental material
The questionnaire focused on two topics: perceptions of roles and knowledge of risk factors. For perception of roles, we explored the priority healthcare workers gave to the admission of patients at risk of MRDO carriage. We asked the question to what extent do you agree with the view that AS is the responsibility of ED healthcare professionals? with response options ranging from ‘fully agree’ 1 to ‘fully disagree’ 4. We dichotomised this variable as ‘perceiving MDRO screening as the task of ED’ (fully agree and agree vs disagree and fully disagree). We also asked the question What priority do you give to MDRO screening at patient admission to the ED? with response options ‘low’, ‘moderate’ and ‘high’.
We also explored knowledge of healthcare workers about the prevalence of MDROs and the MDROs to be screened. To test for knowledge of MDRO prevalence, we asked the question ‘In your opinion, what is the rate of patients with multiresistant bacteria during a transfer from abroad, India or Greece, for example?’ with response options ‘<20%’, ‘20%–39%’, ‘40%–59%’, ‘60% and more’ and ‘don’t know’. An appropriate answer was defined as ‘60% and above’ in agreement with the viewpoint of many WHO experts. Although 60% is not a definitive threshold, it has been observed in the literature.24 Other studies also found a lower threshold.25 26 To assess the knowledge of MDROs to be screened at admission in the ED, respondents were asked to state whether 11 micro-organisms were to be screened or not according to the recommendations in our hospital. The list of MDROs and whether MDROs had to be screened is reported in online supplemental table S1. To assess the knowledge of measures to avoid MDRO transmission within the hospital, we asked the question ‘In your opinion, what are the essential measures to avoid transmission of MDROs?’ The response options included the following measures: medical devices, disinfection, hand hygiene, standard precautions, AP, environmental biocleaning, isolation room, more staff and systematic screening at admission. Three measures were correct: medical devices, disinfection and hand hygiene. We created a variable called ‘knowledge of IPC measures to avoid cross-transmission,’ with three categories: 0 correct answer, 1–2 correct answers and 3 correct answers.
The questionnaire also asked a number of questions about healthcare workers’ experiences: the number of years working in their current profession and in the hospital and whether they attended a specialised training in ED, took a course on infection prevention (yes, no) and participated in a working group or a risk management committee (yes, no).
Development of an automated indicator
We first extracted data from operational databases, combining data from the alert system, laboratory results and prescriptions. We compared the data obtained by using the clinical audit from the EPR to the data automatically extracted from the EPR, used for the automated indicator. We had to define some rules used to interpret data and had two rounds of adjustment to the extraction code. The episodes that interested us concerned only the number of patients who were hospitalised in the ED for more than 24 hours. We tried to filter patients present in the ED for only 1 or 2 hours.
The extraction of data from patient files was in the form of Excel files. We performed a verification by comparing the data from December 2017 in each file and data from the computer extraction. We used approximately 250 files for patients who had been admitted to the ED and were eligible for screening and additional measures. The results of the first extractions were not reliable, but after several attempts, the extraction was in agreement with the individual verification of the files: the results were identical. More details are given in online supplemental appendix.
Statistical analyses
Descriptive statistics were used to describe univariable and bivariable distributions. The χ2 test was used to describe differences in bivariable associations.
Results
Two-stage, multifaceted intervention
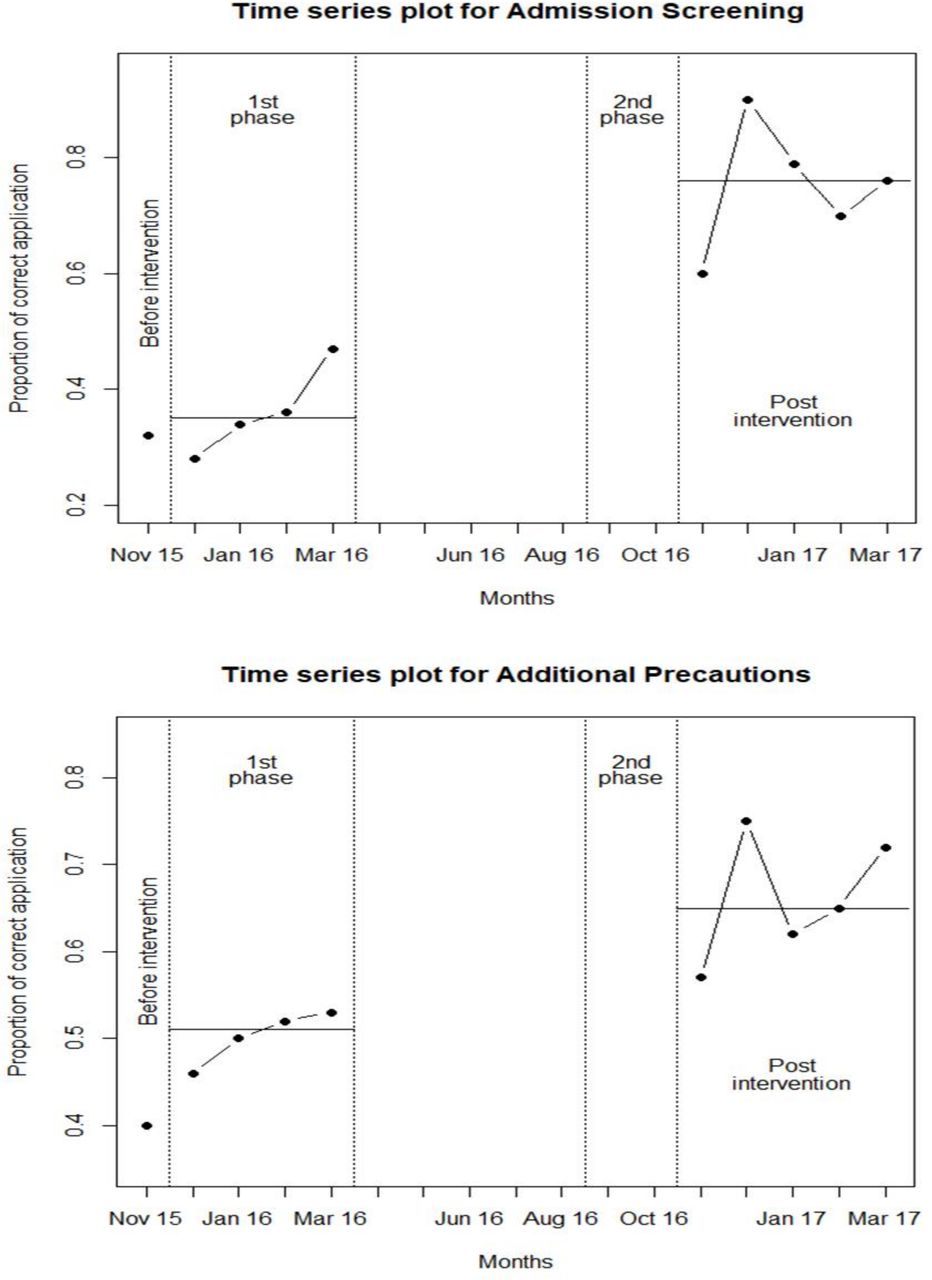
Trends in the correct application of AS and AP are shown in figure 1. Before the intervention (November 2015), the proportions of the correct application of AS and AP were 32% and 40%, respectively (n=25 patient admissions). During the first phase of the intervention (n=100 admissions), the mean proportions of the correct application of AS and AP were 36.2% (95% CI 23.6% to 48.8%) and 50.2% (95% CI 45.3% to 55.1%), respectively. The difference between before the intervention and the first phase was not significant for AS (p=0.77) but was significant for AP (p=0.007). In the second phase (n=125 admissions), the mean proportions of correct application of AS and AP improved to 78.8% (95% CI 67.1 % to 90.3%) and 68.5% (95% CI 60.1% to 76.9%), respectively. The differences between the first and second phase for AS and AP were statistically significant (p=0.005 and p=0.009, respectively). Flow chart showing the stages of the project and differentiating the data collection part from the intervention part (online supplemental figure S1).
Supplemental material

Observations and Trends in application of AS and AP.
Cross-sectional survey of the perceptions and knowledge of MDRO risk factors
In total, 239 healthcare workers were invited to participate in the survey, but only 136 surveys were completed correctly and therefore used in the analysis (participation rate 56.9%). Respondents’ perceptions and experience are in table 1.
Participant characteristics, Geneva university hospitals, Switzerland (n=136)
Perceptions
MDRO screening was perceived as a task of the ED (‘MDRO screening is the responsibility of ED healthcare workers’) by more than 7 in 10 healthcare workers (70.2%); 46.8% ‘mostly agreed’ (23.4% fully agreed) (table 1). About one in two (51.8%) healthcare workers gave ‘moderate’ priority to MDRO screening and 30.7% gave ‘high’ priority and 17.5% ‘low’ priority. Healthcare workers who perceived MDRO screening as their mission (ie, fully or mostly agreed that MDRO screening was the responsibility of ED healthcare workers) were similar in characteristics: level of knowledge about MDRO screening (MDROs to be screened and IPC measures needed to avoid cross-transmission of MDROs) and their experience (number of years in their profession, in their workplace, training in emergency care, course in infection, participation in risk management) (table 2). This result was similar to MDRO screening as a high priority.
Characteristics related to perceptions of MDRO screening
However, we observed two exceptions. First, for the response to ‘MDRO screening as an ED task’, we observed differences according to the knowledge of MDRO prevalence (p=0.001): 45.7% of respondents who answered ‘don’t know the MDRO prevalence ‘endorsed the view that MDRO screening was their mission, whereas 71.4%–93.3% of respondents who stated a prevalence (whatever the range of the prevalence) endorsed MDRO screening as their responsibility. For the response to ‘MDRO screening as a high priority,’ we observed differences according to the number of years in the profession (p=0.024): 40% of respondents with the highest experience (11 years and more) gave high priority to MDRO screening, whereas the least experienced respondents (0–2, 3–5 and 6–10 years) less frequently gave high priority (6.3%–25.0%).
Knowledge
About 1 in 10 healthcare workers (12.1%) had an appropriate knowledge of MDRO prevalence among patients transferred from foreign countries (table 1). About one-third (36.3%) did not know the prevalence. Almost all healthcare workers (92.6%) did not know all MDROs to be screened in their hospital. The proportions of correct answers are in online supplemental table S1. About two-thirds of respondents (66.2%) knew 1–2 IPC measures to avoid cross-transmission, and about one-quarter (26.5%) knew the three correct IPC measures. We observed no differences by respondent’s characteristics: their perception of MDRO screening (MDRO is the responsibility of the ED, priority of MDRO screening) and their levels of experience (online supplemental table 3). However, two differences were observed: first, the more respondents endorsed MDRO screening as the ED responsibility, the more they correctly knew the prevalence of MDRO screening (p<0.001). Second, the proportion of respondents correctly identifying the three IPC measures to avoid cross-transmission decreased (p=0.021) with increasing number of years in the hospital (66.7% for respondents with <1 year in the hospital, 58.3% with 1–2 years, 11.5% for 3–5 years and 25.5% for 6–10 years).
Supplemental material
Cost analysis
We measured the cost of performing the clinical audit versus extracting the data automatically, the automated indicator (online supplemental table 4). In the developmental phase, the clinical audit required up to 200 hours of staff intensive work, including the 18 medical charts. Classes and training accounted for 36 hours of staff time. These together corresponded to US$13 924 of estimated cost. Programming time represented 310 hours for a senior programmer, with a cost estimated at US$18 290. In addition, meetings and organisation accounted for 120 hours of staff time. The overall cost was estimated at US$39 884 (for 676 hours of staff time).
In the continuous monitoring phase, we computed the monthly cost of 200 clinical cases. The clinical audit would require 178 hours of human resources and the automated indicator 8 hours. The cost for team presentations was similar between the two methods. In total, the monthly cost of the audits was US$10 961 as compared with US$944 for the automated indicator. Related to 1 year, the costs were US$131 531 and US$11 328, respectively.
Lessons and limitations
The initial observations showed a low baseline rate of application of AS and AP (32% and 40%, respectively) and the briefings revealed variability among healthcare workers’ perceptions regarding their role and priorities regarding the admission of patients with possible MDRO infection. This observation of variability was confirmed with the survey of healthcare workers (n=136), which suggested low and disparate MDRO knowledge. Although some bacteria, such as MRSA, have been endemic to our hospital for several years and are well known by the healthcare workers (74.3% of correct answers, online supplemental table S1), emerging MDROs are poorly known and need to be screened; these include Carbapenem-resistant Enterobacteriaceae, considering their high resistance to available antibiotics.3 In addition, although knowledge of IPC measures to avoid transmission of MDROs was good (table 2), a slight majority (51.8%) of healthcare workers answered ‘moderate’ priority for AS.
Overall, healthcare workers lacked knowledge and underestimated the risk factors of MDRO infection. Indeed, the link between endorsing the AS mission and knowledge of the prevalence of MDROs for patients at risk (eg, those transferred from abroad) show that knowledge of the MDRO prevalence would mostly affect healthcare workers’ commitment to AS. These factors may help explain why after the coaching session of healthcare workers by the visiting nurse, the compliance rate with the application of AS and AP measures increased only minimally, to 36.2% and 50.2%, respectively.
Training and implementation of the new ‘order-set’ in the ED
To overcome the barriers revealed by the survey, especially the lack of healthcare workers’ knowledge of the risk factors associated with MDRO carriage, we implemented a training session. These sessions were based on the findings from the cross-sectional survey and focused on the risk factors of MDRO carriage, such as transfers from abroad, as well as feedback from experience. To facilitate the ordering of the preventive measures, we designed and implemented a new computer-based order-set in the ED to help healthcare workers prescribe the right AS and AP. The new order-set is implemented by buttons for triggering the prescription panel for AS and AP, thus reducing the time dedicated to this task and the risk of confusion regarding laboratory tests.
Postintervention, we observed a significant improvement in compliance with practices for AS and AP (78.8% and 68.5%, respectively), which suggests that the multifaceted intervention (order-set and training) was effective. Although the training session is likely to have contributed to this increase in compliance, the clinical audit likely contributed as well.27 Indeed, in the process of the manual audit, the barriers were discussed thoroughly by the nurse auditor, as were any other reasons the healthcare workers would have not followed the recommendations. However, no causality link can be inferred because these results are based on one cross-sectional set of measurements and need to be confirmed with repeated longitudinal measurements.
The development of an automated indicator measuring compliance with the application of as and AP measures
Because of the cross-sectional nature of the audit, we developed performance data for constructing a reporting indicator for compliance based on real-time monitoring of the process. Informing in real-time allows managers to react to significant variations in compliance. This automated indicator takes into account all patients coming to the ED with the MDRO ‘flag’ and as such was more reliable than a clinical audit random sampling. The disadvantage is the lack of interaction with the healthcare workers in the ED when obtaining the data and therefore fewer interactions with the teams about this data. The numerators of AS and AP are the same as with the clinical audits, but a computer extraction indicating a prescription does not allow for checking the application in the patient zone. In fact, the computer extraction only includes the prescription rate of AP, whereas the clinical audit also verifies the correct application of these measures. Creating and automating the automated indicator had an initial cost of US$18 290; however, once the indicator was developed and ran automatically, the cost of measuring compliance once a month over 12 months was only US$29 618 (US$18 290 (initial cost)+US$11 328 (running cost)) vs US$131 531 for the clinical audit, thus resulting in a net savings of US$101 913 (US$131 531–US$29 618) and a net return on investment of US$3.44 for US$1 spent (US$101 913/US$29 618). This shows the prohibitive aspect of doing a clinical audit on a longitudinal basis, which is needed to establish the causality of the intervention with the observed results. Therefore, although we needed to develop the automated indicator and report the results to the healthcare workers in real time, this is not enough. To become familiar with, understand and analyse the indicator, teams will need training. This training should insure that the automated indicator is used appropriately by the healthcare workers in a process of continuing improvement. In the future, our goal will be to focus on the automation of monthly extraction of AS and prescription of AP, reporting to the teams, and development for the other ED of our hospital and to all admission units of the hospital.
Strengths and limitations
This study allowed for better understanding healthcare worker behaviours with respect to the correct application of AS and AP appropriate corrective actions related to MDROs. The limitations of this study include the low number of observations, the short observation period in the post-intervention phase, and questions on how to generalise the study findings to other acute care settings. Germany, France and Switzerland created a network to develop consensus documents about MDROs detection and infection control measures.28 29 The network stated that it is necessary to take into account the differences in epidemiology, healthcare systems and sociocultural context. This is especially necessary in Switzerland as it has different linguistic cultures (French, German and Italian speaking regions) across the Swiss cantons. Indeed, in Swiss hospitals, there is heterogeneity in the knowledge of risk factors and the clinical sites to be screened. A national survey in Switzerland has shown a gap in compliance with AS between acute care hospitals and small private healthcare facilities.30 A similar gap has been observed in France in 2012 in a survey assessing compliance with AS.31 This two-stage intervention can be easily implemented in other hospitals with the new order set. However, this two-stage and multimodal intervention strategy targeting system, education and motivational actions (system facilitation with order-set, staff education and poster for display) may be more successful than a single stage/modal approach.32 Another limitation is the cross-sectional nature of the survey design which prevents any considerations about the causality of the associations. The questions on perceptions of roles and knowledge of risk factors were developed for the purposes of the survey and were not scientifically validated. Nevertheless, the satisfactory response to the survey suggests a high degree of confidence in the results. In conclusion, healthcare workers’ compliance with AS was low. A two-stage, multifaceted educational intervention addressing role perceptions and knowledge of risk factors together with the introduction of a new order set was effective in improving ED staff compliance with the correct application of AS and AP for potential MDRO carriers and, ultimately, improving safety and quality of care. Improving knowledge of risk factors among ED staff may increase how they prioritise the screening. Some emerging MDROs as well as the risk factors of carriage were generally little known and often underestimated, which could explain the low compliance with AS.
Conclusions
The maintenance of the benefits of the intervention should be monitored over time to assess its sustainability using a process indicator reported frequently and displayed longitudinally as a time series. A clinical audit of patient charts is not feasible to be repeated over time frequently because the costs would be prohibitive. Although automated reporting with the indicator is both substantially more cost-effective and can be done in almost real time, it must still be accompanied by team discussions and training. By improving screening at ED admission, acute care hospitals can limit the spread of MDROs and maintain appropriate levels of patient safety.
Data availability statement
Data are available in a public, open access repository. All data relevant to the study are included in the article or uploaded as online supplemental information.
Ethics statements
Patient consent for publication
Ethics approval
This study involves human participants (Swissethics ID Req-2017-00618) . On August, I received an email without ID from Swissethics commission confirming that I did not need their authorisation to carry out this study.
Acknowledgments
The authors thank Prof. Didier PITTET for helping us as Director Infection Control Programme and for participating in the review.
References
Supplementary materials
Supplementary Data
This web only file has been produced by the BMJ Publishing Group from an electronic file supplied by the author(s) and has not been edited for content.
Footnotes
Contributors Objectives: all coauthors, design the study : DJ; data collection: DJ and SC; data analysis: LR, SC, PB and DJ; automated indicator development: DJ, AO, PB and DG; manuscript drafting: DJ, PB and SC; manuscript reviewing: all coauthors acceptance of the final version: all coauthors. Responsible for the overall content: DJ
Funding The authors have not declared a specific grant for this research from any funding agency in the public, commercial or not-for-profit sectors.
Competing interests None declared.
Patient and public involvement Patients and/or the public were not involved in the design, or conduct, or reporting, or dissemination plans of this research.
Provenance and peer review Not commissioned; externally peer reviewed.
Supplemental material This content has been supplied by the author(s). It has not been vetted by BMJ Publishing Group Limited (BMJ) and may not have been peer-reviewed. Any opinions or recommendations discussed are solely those of the author(s) and are not endorsed by BMJ. BMJ disclaims all liability and responsibility arising from any reliance placed on the content. Where the content includes any translated material, BMJ does not warrant the accuracy and reliability of the translations (including but not limited to local regulations, clinical guidelines, terminology, drug names and drug dosages), and is not responsible for any error and/or omissions arising from translation and adaptation or otherwise.