Article Text

Abstract
Background Annual albuminuria screening detects the early stages of nephropathy in individuals with diabetes. Because early detection of albuminuria allows for interventions that lower the risk of developing chronic kidney disease, guidelines recommend annual testing for all individuals with type 2 diabetes mellitus and for those with type 1 diabetes for at least 5 years. However, at the Eskind Diabetes Clinic at the Vanderbilt University Medical Center, testing occurred less frequently than desired.
Methods A quality improvement team first analysed the clinic’s processes, identifying the lack of a systematic approach to testing as the likely cause for the low rate. The team then implemented two successive interventions in a pilot of patients seen by nurse practitioners in the clinic. In the first intervention, staff used a dashboard within the electronic health record while triaging each patient, pending an albuminuria order if testing had not been done within the past year. In the second intervention, clinic leadership sent daily reminders to the triage staff. A statistical process control chart tracked monthly testing rates.
Results After 6 months, annual albuminuria testing increased from a baseline of 69% to 82%, with multiple special-cause signals in the control chart.
Conclusions This project demonstrates that a series of simple interventions can significantly impact annual albuminuria testing. This project’s success likely hinged on using an existing workflow to systematically determine if a patient was due for testing and prompting the provider to sign a pended order for an albuminuria test. Other diabetes/endocrinology and primary care clinics can likely implement a similar process and so improve testing rates in other settings. When coupled with appropriate interventions to reduce the development of chronic kidney disease, such interventions would improve patient outcomes, in addition to better adhering to an established quality metric.
- quality improvement
- diabetes mellitus
- quality measurement
Data availability statement
Data are available upon request.
This is an open access article distributed in accordance with the Creative Commons Attribution Non Commercial (CC BY-NC 4.0) license, which permits others to distribute, remix, adapt, build upon this work non-commercially, and license their derivative works on different terms, provided the original work is properly cited, appropriate credit is given, any changes made indicated, and the use is non-commercial. See: http://creativecommons.org/licenses/by-nc/4.0/.
Statistics from Altmetric.com
Introduction
Background
Diabetic kidney disease (DKD), also known as diabetic nephropathy, ranks as the leading cause of end-stage renal disease (ESRD) in the USA and is an independent risk factor for the development of cardiovascular disease.1 2 DKD occurs in 20%–40% of individuals with diabetes, typically developing about 10 years after a diagnosis of type 1 diabetes mellitus (T1DM) and any time after a diagnosis of type 2 diabetes mellitus (T2DM).1 In the USA, diabetes mellitus (DM) affects about 10.5% of the population (~34.2 million people), and DKD affects about 38.6% of those diagnosed (~288 000 people).3 For people with diabetes with chronic kidney disease (CKD) stages 2, 3 or 4, the risk of progression to dialysis over a 5-year period is 1%, 1% and 20%, respectively, with corresponding mortality rates of 20%, 24% and 46%.4 DKD significantly impacts financial spending, with Medicare expenditures for CKD and ESRD exceeding $120 billion in 2017.2
The pathogenesis of DKD is complex and multifactorial. Many modifiable and non-modifiable risk factors lead to the development of DKD.4 Non-modifiable factors include advanced age, age of diabetes onset, genetic factors and family history. Modifiable factors include poor glycaemic control, hypertension, dyslipidaemia, obesity, smoking and socioeconomic disadvantage. Overall, DKD is understood to be a consequence of hyperglycaemia causing microvascular damage to the renal glomerulus milieu.4 5 This pathological process initially manifests as glomerular hyperfiltration, followed by worsening renal function and eventually hypofiltration.6 Albuminuria signals glomerular hyperfiltration in the early stages.
The American Diabetes Association (ADA) recommends annual albuminuria testing for all patients with T2DM and for patients with T1DM for ≥5 years.1 Common testing tools include a spot urine albumin-to-creatinine ratio (UACR) or a 24-hour creatinine collection.7 The UACR is recommended and preferred due to the ease of test timing and a relatively inexpensive cost.
With appropriate intervention, early detection of albuminuria leads to medical interventions that prevent or slow progression of DKD.5 7 Optimising glucose control decreases onset and worsening nephropathy by 33%.8 The addition of an ACE inhibitor (ACE-I), angiotensin-receptor blocker (ARB) or other diuretic helps prevent or slows the development of nephropathy,9 10 as does the addition of a sodium-glucose cotransporter 2 inhibitor11 12 or a glucagon-like peptide-1 agonist.13 Models suggest that annual albuminuria testing of individuals with diabetes is a cost-effective strategy.14 15
Available knowledge
Past quality improvement (QI) projects report a wide range of strategies in DM management to improve the frequency of albuminuria testing. These include implementing a diabetes education programme for providers and patients,16 providing a decision support tool in the form of a paper flow chart17 and creating a programme using patient navigators.18 Some studies in primary care settings used clinical support tools and provider education to improve testing rate disparities related to patient minority status19–21 or uninsured status.22
Several QI studies focused on electronic health record (EHR)-based interventions. These EHR-based reminders and monitoring improved compliance with albuminuria testing in primary care settings.23 24 The development of EHR templates and order sets increased adherence to testing guidelines in a paediatric endocrine clinic25 and in a primary care setting.26
Problem description, rationale and global aim
The Eskind Diabetes Clinic (EDC) at the Vanderbilt University Medical Center (VUMC) employs no systematic process to ensure that albuminuria testing is up to date for patients with DM. While the triage team assists clinicians with addressing other diabetes maintenance testing parameters (haemoglobin A1C, diabetic foot exam and retinopathy testing), no similar workflow addresses albuminuria testing. Testing depends solely on provider recall during patient visits, and some clinicians have developed personalised standard visit checklists to minimise missed screens.
EDC clinicians raised awareness of the lack of a system-based approach and the potential for a negative impact on patients by not consistently following this standard of care.1 They indicated that the rate of annual albuminuria testing was likely to be lower than desired for this reason. We hypothesised that substandard testing likely existed and that introducing a systematic workflow could alleviate the clinician burden of relying on memory and so improve albuminuria testing rates. Thus, we created a project with the global aim to increase the frequency with which patients in the EDC received annual albuminuria testing.
Methods
Setting
VUMC is in Nashville, Tennessee, and manages over 2 million patients yearly from Tennessee and neighbouring states. While located in an urban setting, VUMC serves patients representing a wide range of socioeconomic and cultural backgrounds. VUMC uses a single EHR (Epic Systems, Verona, Wisconsin, USA) integrated across all inpatient and outpatient sites, including laboratory and radiology services, that has been in place since November 2017.
The EDC is a multidisciplinary outpatient endocrinology clinic within VUMC, serving ~9500 individuals with DM annually. Physicians and nurse practitioners (NPs) provide team-based care for these patients, with patients seeing a physician at least annually and NPs at different intervals as needed. During in-person visits, medical assistants (MAs) and licenced practical nurses (LPNs) triage patients, including documenting the date of the most recent diabetic eye and foot exams and performing point-of-care haemoglobin A1C testing when indicated. Triage staff use a dashboard within the EHR (see figure 1 for an example) to determine and document what testing is due for each patient. They manually record dates for the most recent foot and eye exams, and dates of the most recent A1C and albuminuria tests import automatically from the VUMC lab database. The triage process ends with escorting patients to the clinic room for the clinician visit. After visits are complete, patients check-out at the front desk and are directed to the in-house laboratory if the clinician signed lab orders prior to checking out.

Example of a patient dashboard as viewed by triage staff for a patient with diabetes. 2021 Epic Systems Corporation.
Context, design and patient involvement
Rotating teams of three to five senior medical students at the Vanderbilt School of Medicine conducted this QI project during a 1 month diabetes elective offered during the 2020–2021 academic year. A VUMC clinician mentor trained in QI methodology provided longitudinal supervision. Each month’s team completed a unique step in the project’s plan–do–study–act (PDSA) cycles, including baseline analysis, stakeholder/patient engagement, development of aims and metrics, designing interventions, data analysis and dissemination of results. Each team prepared written and video hand-offs to orient the next team. Hand-offs included details on the project overall, the work completed that month and the work to be completed the next month.
The project began in August 2020 with an internal review process of albuminuria testing at the EDC. The team consulted clinicians, clinic and laboratory staff and administrators to understand the baseline processes. The team interviewed several patients after routine visits in the clinic to better understand their perceptions of why testing was being performed and barriers to successfully completing testing, with subsequent interventions designed to account for identified issues. The internal review process focused on in-person visits. The clinic operated with a hybrid model of in-person and telemedicine visits due to the COVID-19 pandemic. VUMC’s telemedicine workflows regularly changed in response to the evolving situation, leading to the decision to exclude telemedicine workflows from the initial analysis and interventions. About 50% of patient visits occurred in-person at the beginning of the project and increased to 70% at the end.
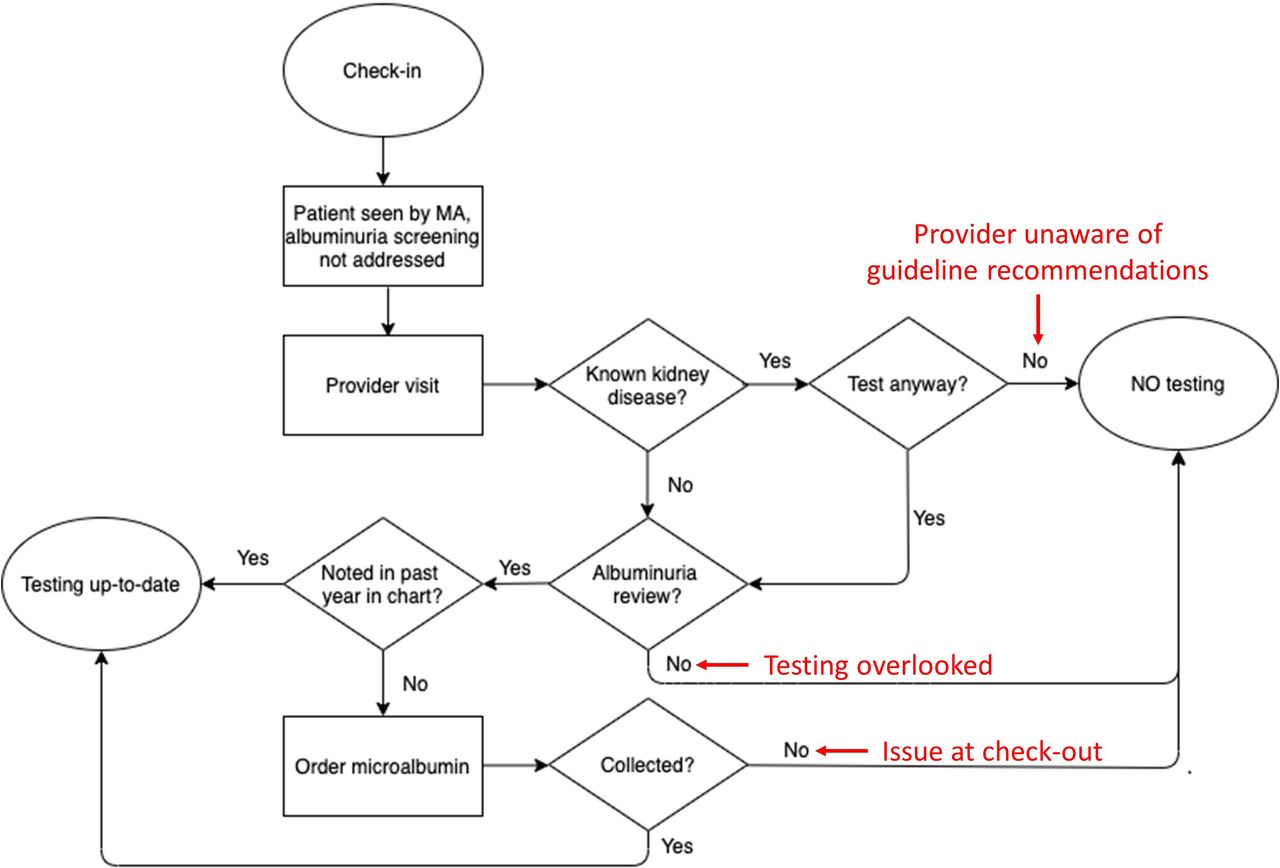
Several consistent themes emerged for causes of lower-than-target albuminuria testing rates. Provider factors included not understanding testing guidelines, omitting an albuminuria screen review or forgetting to place an EHR order. Patient factors included not stopping at check-out to be directed to the laboratory, not having time to submit a urine sample, not being able to submit a urine sample or declining to provide a urine sample because the reason for the test was not explained prior to them checking out. Figure 2 depicts the baseline process as a flow map, with the identified causes for system failure highlighted.

Flow chart of an in-clinic visit for a patient with diabetes, focused on albuminuria testing, with potential causes for system failures highlighted by arrows. MA, medical assistant.
Following the review process, the team proposed several potential intervention ideas. These included: (A) providing patient education on the purpose of annual albuminuria testing; (B) sending an EHR-based previsit notification of an upcoming urine screen; (C) placing annual testing reminders in the clinic waiting room; (D) providing a urine sample cup to every patient at check-in; (E) introducing a review of the patient’s last urine screen date during the triage check-in process; or (F) providing additional clinician education.
We hypothesised that standardised, system-level, EHR-based interventions would be the most effective for increasing albuminuria testing rates. Based on the flow of the clinic and logistics of each proposed intervention, we aimed to focus on the triage process for our initial interventions. The triage workflow already included accessing the patient’s dashboard to determine if A1C testing was due, and reviewing the status of albuminuria testing could be incorporated in the same step. Furthermore, MA/LPNs have the ability to pend orders for clinicians to sign at the conclusion of each patient visit, potentially reminding providers that albuminuria testing was due without providers needing to make this determination themselves. The triage staff indicated that such an additional step was likely to add little additional time and effort to their existing process.
The team piloted this project among the five NPs in the EDC who conducted in-person visits for patients with DM throughout the study period. The team solicited the NPs’ engagement for this pilot study given their high volume of DM patient visits and interest in participating in innovative, system-based approaches to improving care.
Measures
The number and proportion of overdue versus up-to-date albuminuria screens were abstracted from the EHR central database for every calendar month. Each patient visit represented a unique data point, as each visit represents an opportunity for ‘success’ or ‘failure’ of the system to appropriately test patients. Patients with multiple visits during the study period had multiple unique data points recorded in our dataset. Up-to-date albuminuria screens were defined as a spot UACR test completed on the day of or during the 364 days prior to the visit. Only tests completed within the VUMC network were included, as data from outside laboratories are not integrated into the VUMC lab record. All patient visits using an International Classification of Diseases, Tenth Revision (ICD-10) code of E8-13 were included, representing T1DM, T2DM and other specified forms of diabetes, regardless of duration of diabetes. Exclusion criteria included patients with gestational diabetes, ESRD on dialysis or those with a history of kidney transplantation. We did not exclude patients on ACE-I or ARB therapy or with a previous diagnosis of albuminuria, as the ADA recommends annual testing for these patients.1
Specific aims
We aimed to improve the frequency of albuminuria testing by 20% (absolute from the baseline) over a 6-month period. We chose a relatively modest goal due to the time constraints of the project.
Statistical analysis
Data were deidentified and analysed using a p-chart, with standard rules for assessing for a special cause signal and thus statistical significance.
Interventions
PDSA cycle 1
Starting in December 2020, the team asked the triage staff to begin: (1) determining whether patients with DM were due for albuminuria testing based on a review of the EHR dashboard and (2) pending orders for an albuminuria test if one had not been performed at a VUMC facility within the past year.
For clinicians, the pended order became visible immediately when opening the patient’s chart. The clinician could sign, delete or defer the order at their discretion. The EHR requires that pended orders be addressed prior to signing the visit, which typically occurs shortly after the patient leaves the clinic room.
PDSA cycle 2
During the review of PDSA cycle 1, the MAs and LPNs raised concerns regarding having difficulty remembering when to implement the intervention workflow, given the pilot’s focus on only NPs at the EDC and each MA/LPN having different provider assignments daily. Thus, PDSA cycle 2 focused on creating a reminder system to improve rates of intervention implementation.
In January 2021, a reminder statement was added to the provider assignment email that the triage team received each morning. This statement was brief (a single sentence long) and was subsequently standardised for all future emails.
Results
Baseline data
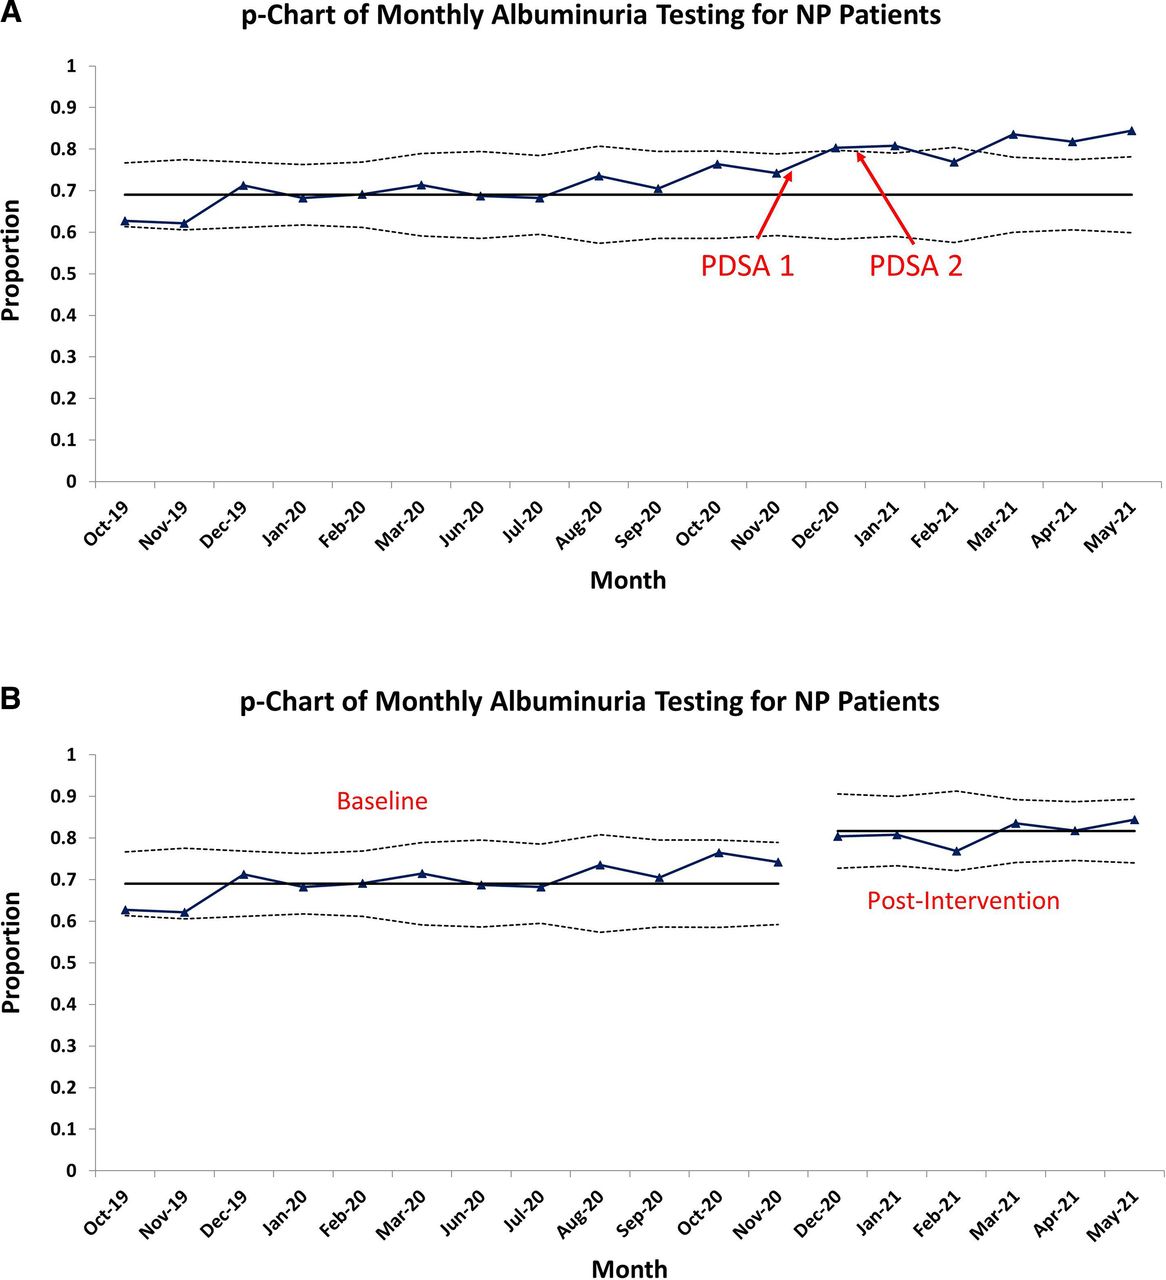
At the EDC, annual albuminuria testing for patients with DM averaged 69.0% of 2860 visits in the 12 months prior to this project, with the analysis indicating a stable process (see figure 3). Two months (April and May 2020) were excluded from the analysis, given the low number of in-person visits because of the COVID-19 pandemic.
Statistical process control charts of the proportion of patients seen by a nurse practitioner (NP) in the clinic, with (A) a fixed mean based on the baseline performance and (B) two separate means based on preintervention and postintervention data.
Postintervention data
The postintervention period encompassed 6 months (December 2020–May 2021) and included 1245 visits. A special cause signal (monthly average above the upper control limit) occurred the first month (see figure 3A). For these 6 months, five monthly averages were above the upper control limit, with all six being well above the baseline average. Splitting the p-chart into separate preintervention and postintervention periods showed a postintervention annual albuminuria testing average of 81.7%, a 12.7% increase above the baseline (see figure 3B). The special cause signals indicated that this improvement met statistical significance, though it failed to meet the prespecified goal of a 20% improvement.
Discussion
Summary
Over the course of 6 months, two simple interventions increased the frequency of annual albuminuria testing from 69% to 82% at the EDC. With the first intervention, triage staff identified patients due for testing and pended an order when needed. With the second intervention, clinic leadership used an existing daily communication to remind triage staff of this process.
Sustainability, Strengths, and Interpretation
This QI project demonstrated how small, scalable, generalisable modifications to our triage process significantly improved albuminuria testing rates. To better understand the potential for negative impacts of these interventions (eg, a lengthier triage process), the team interviewed triage staff, clinic leadership and clinic providers at the conclusion of the project. All stated that the impact of these interventions on their work was negligible, suggesting that this work can be sustained. No one reported concerns for standardised implementation clinic wide.
Our most significant change involved standardised utilisation of our EHR’s dashboard. Our dashboard is designed to be easily visible within each patient’s chart and includes both diabetes parameters and non-diabetes parameters, with the diabetes parameters clustered together to allow simultaneous review. EHR dashboards are increasing in popularity as they have shown to improve patient care.27–31 Most likely, the ease of accessibility of the dashboard used in our EHR contributed to the success in the triage staff using it and would likely need to be a component for a similar intervention elsewhere to be successful.
Our secondary change focused on a reminder system for the triage teams. Based on the EDC’s workflow, a slight modification to the template of the daily assignment email allowed an existing process to be adapted for this intervention. We theorise that such a reminder will not be needed after this intervention becomes routine in our clinic, and it may not have been required at all if the project was not initially piloted on only a subset of the patient encounters.
In comparison with other EHR-based QI interventions described in the literature, our interventions allow individualised review of patient testing status without excess burden on the clinical team. Anabtawi and Mathew created a computer-generated reminder that appeared every time a patient chart is opened within their primary care clinic network.23 The impact of their intervention compares well to ours, increasing test ordering from 56% to 70%.23 While EHR-based reminder systems or clinician decision support tools are thorough, frequent alerts affect clinician focus and lead to alert fatigue.32 33 Deem et al24 added the CPT code for albuminuria testing to a user-friendly short list for their primary care clinic’s EHR, improving testing from 8% to 15%. While similar to our use of a dashboard, this intervention did not assist clinicians with determining appropriateness of an albuminuria test. Choudhary et al25 used EHR templates and order sets developed for their urban community-based paediatric endocrine clinic. While their improvement was of a greater magnitude over a 2-year period (49%–79%), the volume at their site was much lower than ours and so is perhaps not comparable. Finally, Herrin et al26 developed a package tool that included a ‘Diabetes Self-Education’ tab for passive clinical decision support and documentation tool, which was available to an ambulatory medical practice group with 156 primary and specialty care centres. Their study improved testing by 9% relative to a non-intervention group. Our triage team check is a process change most similar to these interventions but is more efficiently customised to each patient: the pended order indicates that the albuminuria testing review already occurred and that testing is due. If placing a standardised order set, the clinician still needs to perform an albuminuria testing review, which may be less efficient.
Overall, our QI interventions can be easily expanded to other diabetes clinics and primary care settings, improving the quality of diabetes care by better conforming care to accepted standards.1 By better identifying the onset and progression of albuminuria, interventions proven to prevent or slow DKD can be started more frequently,1 potentially lowering the frequency of ESRD.
Limitations
This pilot study involved a limited number of our patients, as we focused on visits with certain providers. However, our interventions can be easily expanded to the rest of our patient panel and may in fact be more successful because our triage team would standardise the intervention for all patients instead of remembering which providers were participating in the pilot study. Additionally, due to the structure of the year-long course in which the medical students participated and the need to contain the project within this time, we implemented just two PDSA cycles, with 6 months of postintervention data. While these changes have been implemented into the permanent workflow of the clinic, the effects will need to be monitored to demonstrate sustainability.
Importantly, this project required buy-in from our triage team. Certain MA/LPNs may have adapted to the new workflow more easily, which potentially influenced testing compliance rates. We were unable to track albuminuria testing rates by individual MA/LPN and so are uncertain as to presence of variable individual performance.
Our triage team has both access to the EHR’s dashboard and the ability to initiate orders to be later signed by the provider. Variable policies on accessing the EHR and initiating orders in different healthcare settings could impact the ability to implement such an intervention elsewhere.
For patients who receive care outside of VUMC, some testing was likely duplicative. Outside lab reports are stored as scanned copies and do not automatically populate into the EHR, so they are easily overlooked even when obtained from primary care providers or nephrologists outside of VUMC. Given the importance of obtaining this testing annually, both to ensure good patient care and to document compliance to payers, the decision was made to accept the inevitability of some degree of duplication. Given the nature of the problem, the degree of duplication is unknown. Future efforts to integrate laboratory result systems could alleviate resource overutilisation.34
Conclusions
This report describes an effective QI intervention for increasing albuminuria testing rates that can be easily applied and scaled at other clinics with integrated EHR systems. Our intervention occurs during the patient triage process and results in minimal interruption to current workflows. The implementation capitalises on existing processes and is likely generalisable to other clinics. Improvements in albuminuria testing should have long-standing effects on DKD outcomes in patients with DM.
Data availability statement
Data are available upon request.
Ethics statements
Patient consent for publication
Ethics approval
The study protocol was reviewed and granted exemption by the Vanderbilt Institutional Review Board (IRB #202224).
Acknowledgments
We thank Amanda Carter for her leadership in the implementation of this project and Brannan Cole, Norma Edwards, Regina Hamlet, Tiffanie Marksbury, and Jennifer Prager for their participation in this work.
References
Footnotes
Contributors All listed authors contributed to the improvement work and revision of the manuscript. Additionally, SK prepared the initial drafts of the manuscript, and MJF and CDH supervised the work. All other authors share the role of second author. CDH serves as guarantor, accepting full responsibility for the finished work and the conduct of the study, having had access to the data and controlling the decision to publish.
Funding The authors have not declared a specific grant for this research from any funding agency in the public, commercial or not-for-profit sectors.
Competing interests None declared.
Patient and public involvement Patients and/or the public were involved in the design, or conduct, or reporting, or dissemination plans of this research. Refer to the Methods section for further details.
Provenance and peer review Not commissioned; externally peer reviewed.