Article Text

Abstract
Background Of approximately 10,000 surgical specimens collected during nearly 34,000 surgeries performed at Nationwide Children’s Hospital annually, we averaged 10 errors/1000 specimens collected. This and any level of preventable harm is unacceptable, as it could lead to diagnostic errors, improper treatment selection and treatment delay.
Objectives This quality improvement (QI) effort aimed to decrease errors in surgical specimens from 10 errors per 1,000 surgical specimens to 0.
Methods Using the Institute for Healthcare Improvement (IHI) Model for Improvement QI methodology, we determined the root causes of error (figure 1), identified key drivers (figure 2), and tested change interventions. We implemented changes in surgical specimen labeling, standardized specimen time-out and reconciliation processes, and optimized a method of communication between consultants, surgeons, operating room staff, and laboratory staff with the implementation of a Specimen Request Form within our electronic medical record system.
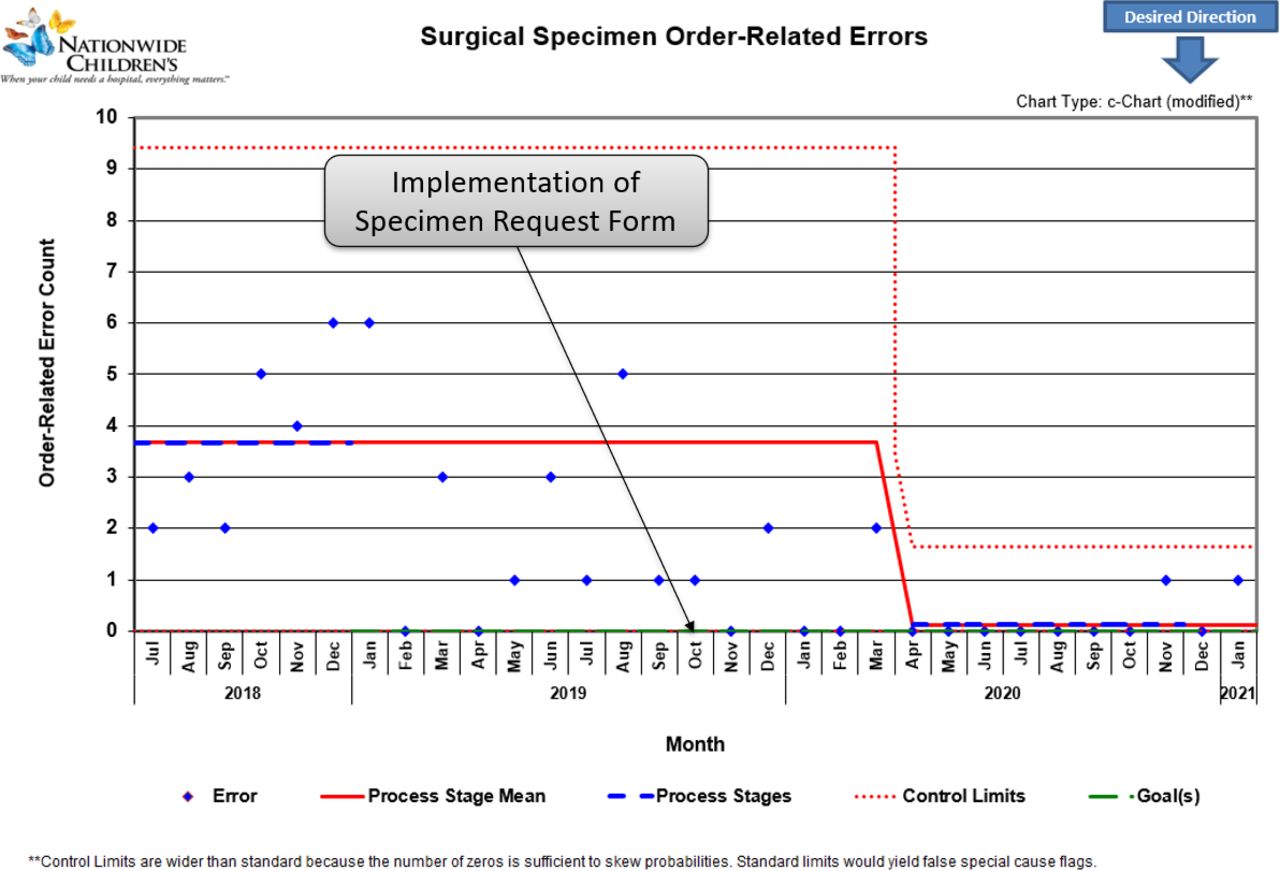
Results We identified 234 specimen errors in 33,962 surgical pathology specimens during the 46 months of data collection. After multiple PDSAs and implementation of interventions, the error rate decreased from 10 to 2.3 (figure 3) errors per 1,000 specimens (p<.05). The mean rate of order errors (figure 4) decreased from 3.7 to 0.1 per month (p<.05), and the mean rate of labeling-related errors (figure 5) decreased from 1.5 to 0.5 per month (p<.05).

The most common reason for specimen errors were determined using a Pareto Chart analysis

A key driver diagram was developed to decrease errors in surgical specimens from 10 errors per 1,000 surgical specimens to 0
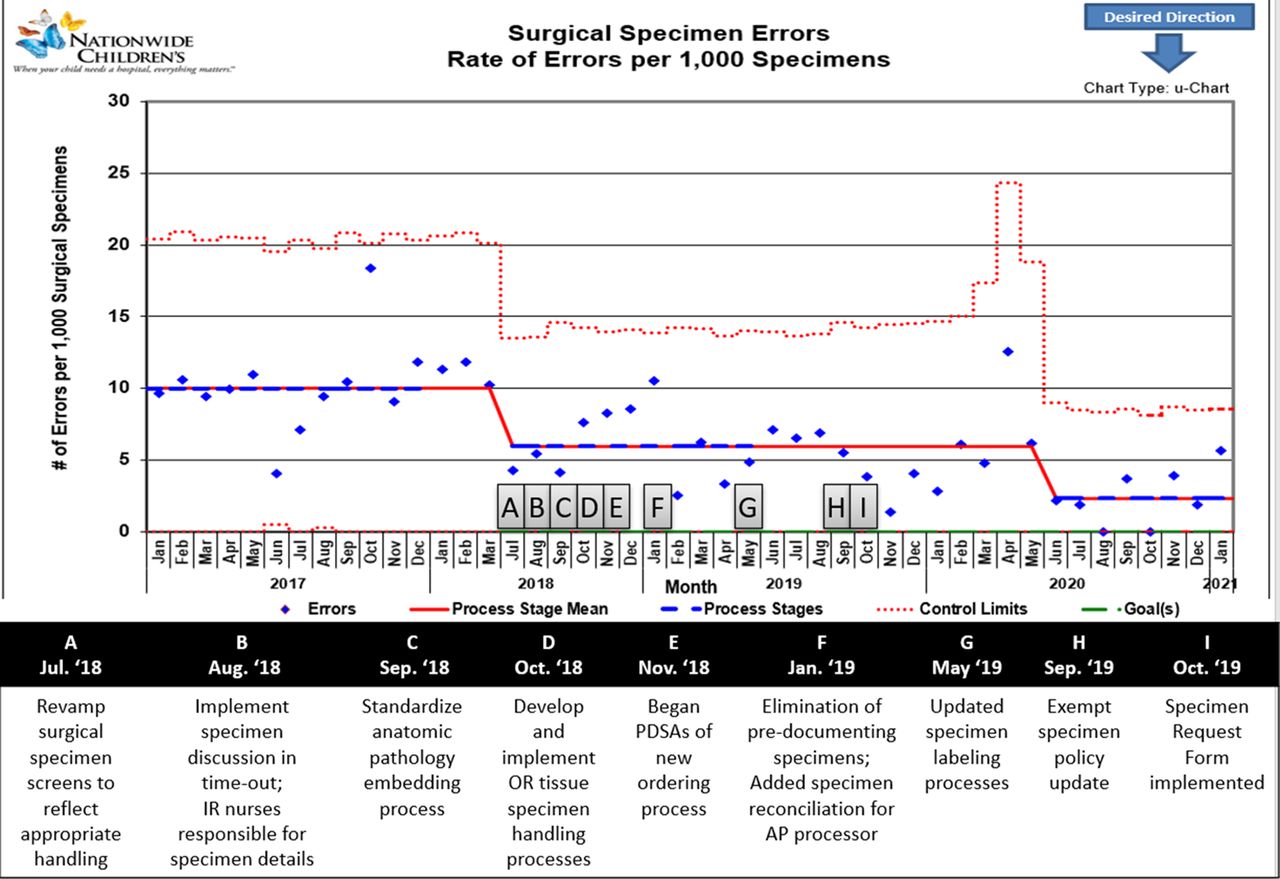
The surgical specimen error outcome measure was tracked using a statistical process control U-Chart

This C Chart shows the count of order-related errors by month

This C-Chart shows the count of errors related to surgical specimen labeling each month
Conclusions A multidisciplinary project team – including representatives from nursing staff, surgical staff, radiology, medical consultation services, laboratory medicine, pathology, information technology, and QI services – implemented changes to specimen test requesting and intraoperative specimen handling with an associated reduction in errors to reduce potential patient harm involving surgical specimen errors. This presentation will demonstrate how applying these methods and interventions can be associated with a reduction in surgical specimen errors.