Article Text

Abstract
Our paediatric rheumatology clinic has experienced inefficient patient flow. Our aim was to reduce mean wait time and minimise variation for patients. Baseline data showed that most waiting occurs after a patient has been roomed, while waiting for the physician. Wait time was not associated with a patient’s age, time of day, day of the week or individual physician. We implemented a checkout sheet and staggered start times. After a series of plan–do–study–act cycles, we observed an initial 26% reduction in the variation of wait time and a final 17% reduction in the mean wait time. There was no impact on patient–physician contact time. Overall, we demonstrate how process improvement methodology and tools were used to reduce patient wait time in our clinic, adding to the body of literature on process improvement in an ambulatory setting.
- ambulatory care
- paediatrics
- quality improvement
Data availability statement
No data are available. Deidentified participant data were used in this study. Data are not in a repository and are not available for reuse.
This is an open access article distributed in accordance with the Creative Commons Attribution Non Commercial (CC BY-NC 4.0) license, which permits others to distribute, remix, adapt, build upon this work non-commercially, and license their derivative works on different terms, provided the original work is properly cited, appropriate credit is given, any changes made indicated, and the use is non-commercial. See: http://creativecommons.org/licenses/by-nc/4.0/.
Statistics from Altmetric.com
Introduction
Providing value in healthcare, that is improving the quality of care while decreasing costs, has emerged not just as an ideal but a necessity we must adopt to survive this era of rising healthcare costs. There is no shortage of literature highlighting healthcare optimisation, with strategies to achieve this being wide and varied.1 2 In order to add value in an ambulatory care setting, meaningful metrics need to be defined, and teams need to use tools which allow for accurate representation of the process without disrupting workflow.3 Tools can include but are not limited to standard work, process mapping,4–6 and time and motion studies with value stream mapping and identification of non-value added time (NVAT),3 6–9 all intended to identify gaps and/or bottlenecks in processes, which ultimately inform helpful interventions.
In ambulatory care, numerous studies highlight that patient flow through clinics is fraught with waste, often defined in terms of patient wait times.5 6 10 11 While these studies do not show a direct relationship between wait times and financial costs, it is reasonable to assume that longer wait times result in a greater expenditure of resources beyond just time, such as staffing and room utilisation, and that these resources raise costs. For example, longer wait times can increase no show rates,5 adding to overall cost. There is also evidence that longer wait times decrease both patient and staff satisfaction.5 6 11
In this article, we demonstrate how process improvement methodology and tools were used to reduce patient wait time in our paediatric rheumatology subspecialty ambulatory clinic. This work adds to the body of literature on process improvement in an ambulatory setting and can serve as an example of how busy clinicians can use data to drive improvement.
Specific aim
We aimed to reduce the mean wait time and minimise wait variation for patients in our clinic.
Methods
Baseline data were acquired over a 2-week period during which 113 patient visits were recorded over the months of February and April 2018 in our paediatric rheumatology clinic. A worksheet was used to record the visit duration, with subdivisions for each step in the process, from patient arrival to visit completion. After implementing changes, additional patient visit time data were recorded to assess for meaningful changes. Worksheets that were incomplete or included data from other departments due to coordinated visits (eg, visit with rheumatology and dermatology) were excluded from analysis. Two patient data points were excluded due to errors in data collection. When graphing time from patient arrival in the clinic to physician arrival in the exam room, patients were listed in order of check in time. Data were recorded by members of the healthcare team, including nurses, physicians and medical assistants. The protocol used for this study was approved as exempt by the Institutional Review Board. Only de-identified aggregate data were used for the final analyses. The Standards for Quality Improvement Reporting Excellence guidelines were used in development and writing of our manuscript.12
Clinic structure
Our paediatric rheumatology clinic is a quaternary care centre clinic, with physicians seeing both new and established patients. Diagnoses and needs of patients are highly variable. Staff included in the process for this project included six paediatric rheumatologists, one paediatric rheumatology fellow trainee, two nurse coordinators, rooming staff (medical assistants or licensed practical nurse; typically 1–3 assigned per half day), research coordinators and a child family life specialist. There are also frequent learners in the clinic, including resident physicians and medical students. Clinic time slots are divided into four hour blocks for both the morning and afternoon, with a differing number of physicians present during these blocks (range 1–4).
Patient and public involvement
Patients were not directly involved in the development or design of this study.
Process mapping and creation of standard work
To help frame our project and identify areas of waste, the planning phase of our project included creation of a process map (online supplemental figure 1). This captured our baseline process and facilitated discussion of a more ideal future state. This was used in creating standard work—agreed on delineation of roles and steps in the process, from patient arrival to visit end. While not studied as a specific improvement cycle in our project, creation of standard work provided the necessary infrastructure to make more specific interventions successful.
Supplemental material
Time analysis
To understand where patients spent the most time waiting and therefore determine key areas to intervene, we assessed NVAT. NVAT was determined by first adding the individual periods of time in which the patient was not interacting with the healthcare team, and then dividing it by the total visit duration. Using this metric, we were able to compare both new and established patient visits despite the varying contact times between the patient and the physician, that is, a new visit is expected to include 60 min with the physician, whereas an established patient visit is expected to last 30 min with the physician. With NVAT informing our areas of opportunity, we then more specifically assessed absolute time from patient arrival to the clinic to other steps in the process. We hypothesised that the following factors might increase patient wait times: patient age, physician, time of day and late arrivals.
Plan–do–study–act (PDSA) cycle 1: checkout sheet
Based on preliminary data, we first targeted the time patients were waiting in the exam room for the physician by implementing a checkout sheet (online supplemental figure 2). The purpose of the checkout sheet was to improve communication between the physician and rooming staff and to standardise the checkout process after completion of the visit with the physician. While focusing on the latter part of the process to improve wait time up front may seem paradoxical, we theorised that improving this step in the process would have an impact on wait times by allowing the physician to move on more efficiently to care for the next patient. Two weeks after the implementation of the checkout sheet, data were recorded—as described before—during the last week of June and first week of July 2018. We also assessed sustainment of changes from the first PDSA cycle during the last week of November and first week of December 2018. Data from a minimum of five clinic days (10 half day blocks) were collected in each instance.
Supplemental material
PDSA cycle 2: staggered visit start times
The second PDSA cycle employed staggered visit start times. Prior to this cycle, the first appointment for the day started at 08:00, with up to four physicians starting at this time, yet only one or two staff available at this time to room patients. For this cycle, start times were staggered by 15 min, with no more than two physicians starting at the same time. Staggered start times were implemented the second week of January 2019, and post-intervention data were recorded, as described previously, during the fourth week of June 2019.
Statistical analyses
Statistical analyses were performed with GraphPad Prism (V.8.3.0) for student t-tests, one-way and two-way analysis of variance (ANOVA), normalisation test, linear and non-linear regression. R (R foundation for Statistical Computing, 2018) was used to confirm control limits used in control charts using the R-package ‘qicharts2’.13 Post hoc tests were conducted with the Dunnett’s T3 test for multiple comparisons to control for a family-wise error rate at α=0.05. Error bars represent SEM, and null hypotheses were rejected at or below a p value of 0.05.
We used Shewhart process control charts (I-MR charts) to examine time from patient arrival at the clinic to the physician entering the exam room and time spent waiting in the lobby (Minitab 17 statistical software), including assessment of differences between phases of the project. Phases were defined as baseline, post-PDSA1, sustainment and post-PDSA2.
Results
Patient characteristics
From the start of our study in February 2018 through June 2019, 297 patient visits were recorded (table 1). Of the total, 38% of these visits occurred during the baseline period, 20% after the implementation of the first PDSA cycle, 19% in between the implementation of the first and second PDSA cycle and the remaining 23% after the implementation of the second PDSA cycle. Table 1 displays the breakdown of patients by age according to each phase.
Patient characteristics
Assessment of non-value added time during the clinic visit
After completion of our process map (online supplemental figure 1) and initial assessment of NVAT, we identified bottlenecks where our patients experienced increased waiting periods. The largest proportion of NVAT occurred either waiting in the lobby (50% of NVAT), when the patient was checked in but waiting to be called back to the exam room, or inside the exam room (46% of NVAT), after the initial rooming process but prior to the physician entering. At baseline, we did not find a relationship between NVAT and age (R2≈0, p=0.9979), time of day (two-tailed student t-test, p=0.3451), day of the week (Welch one-way ANOVA with Dunnett’s T3 correction for multiple comparisons, p=0.1307) or individual physician (Welch one-way ANOVA with Dunnett’s T3 correction for multiple comparisons, p=0.0707) (figure 1A–D).
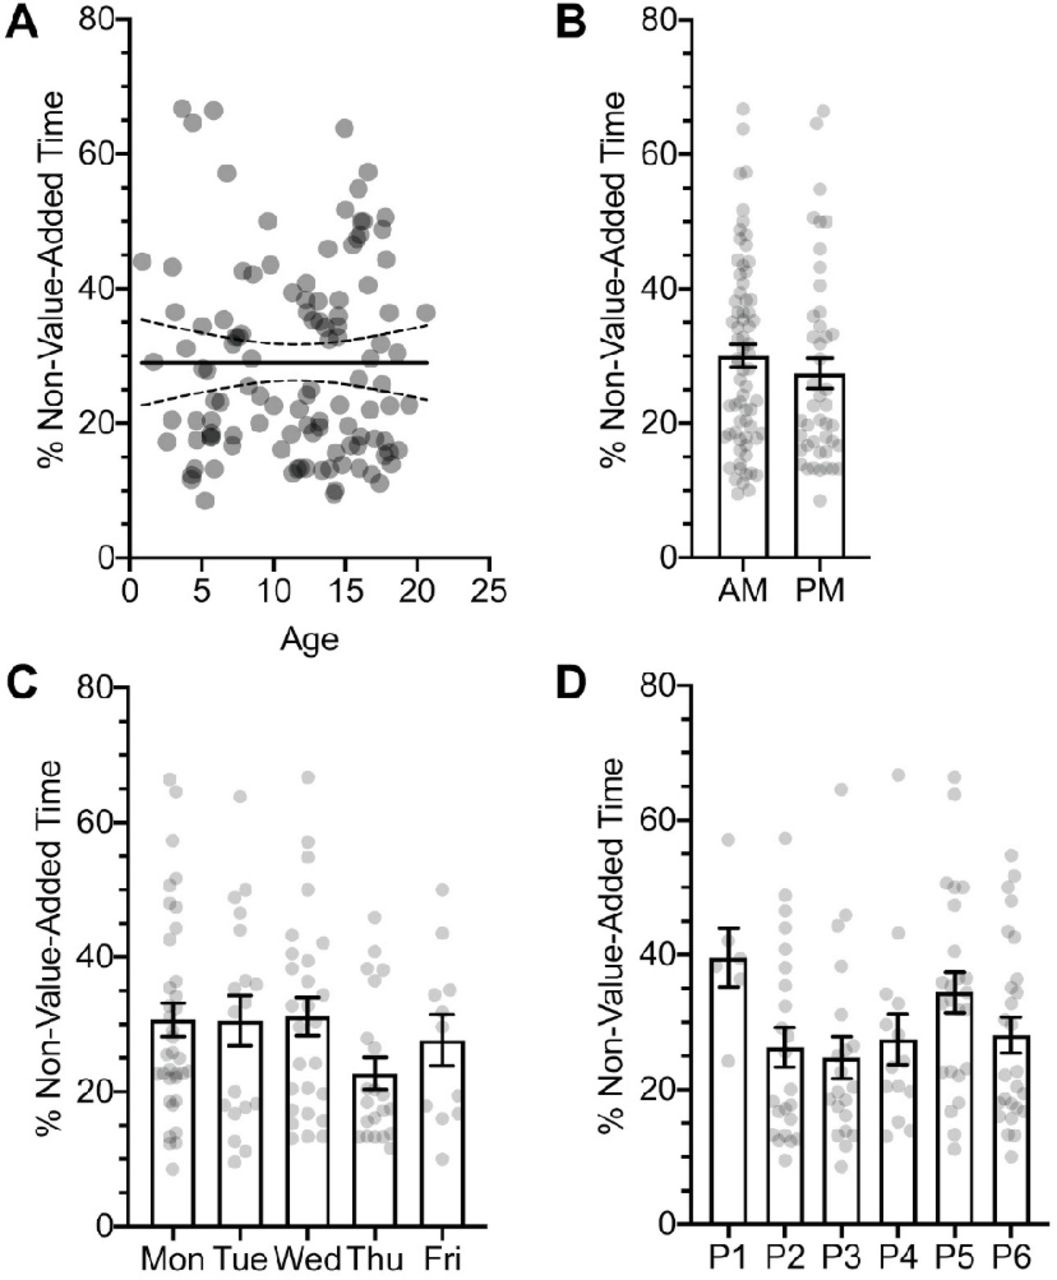
Baseline non-value added time (NVAT) does not correlate with patient age, time of day, day of the week or physician. (A) Linear regression model of NVAT against patient’s age (solid line represents the best-fit line and dotted lines represent the 95% CI, p=0.9979). (B) Morning (AM) versus afternoon (PM) clinic visits do not differ in their %NVAT (two-tailed t-test, p=0.3451). (C) The day of the week (Welch one-way ANOVA, p=0.1307). (D) Physician (P1–P6; Welch one-way ANOVA, p=0.0707). n=113 patient visits. ANOVA, analysis of variance.
Checkout sheet: impact on arrival to physician time
We hypothesised that implementation of our first PDSA cycle, use of a checkout sheet, would reduce mean wait time and/or reduced wait time variation in the time from patient arrival to the physician entering the exam room. We used a combination of a process control chart and a violin plot to examine mean time and variation from patient arrival at the clinic to the physician entering the room (figure 2). We did not initially observe a significant reduction in the mean wait time soon after the implementation of the first PDSA cycle (two-tailed unpaired t-test with Welch’s correction, p=0.7283); however, the wait time variance was significantly reduced (F-test for variance, p=0.0013, figure 2). By the sustainment period, the mean wait time was significantly reduced by 17%, from 30.45±1.62 min to 25.19±1.95 min (two-tailed unpaired t-test with Welch’s correction, p=0.0398), but the variation was not significantly different (figure 2). Similarly, comparison of fits for each cumulative frequency distribution via non-linear regression models showed that there was a significant difference between the groups (p<0.0001). In both the baseline and sustainment phase, the majority of points outside the upper control limits (four out of five) were patients who arrived very early for their appointments (figure 2A).
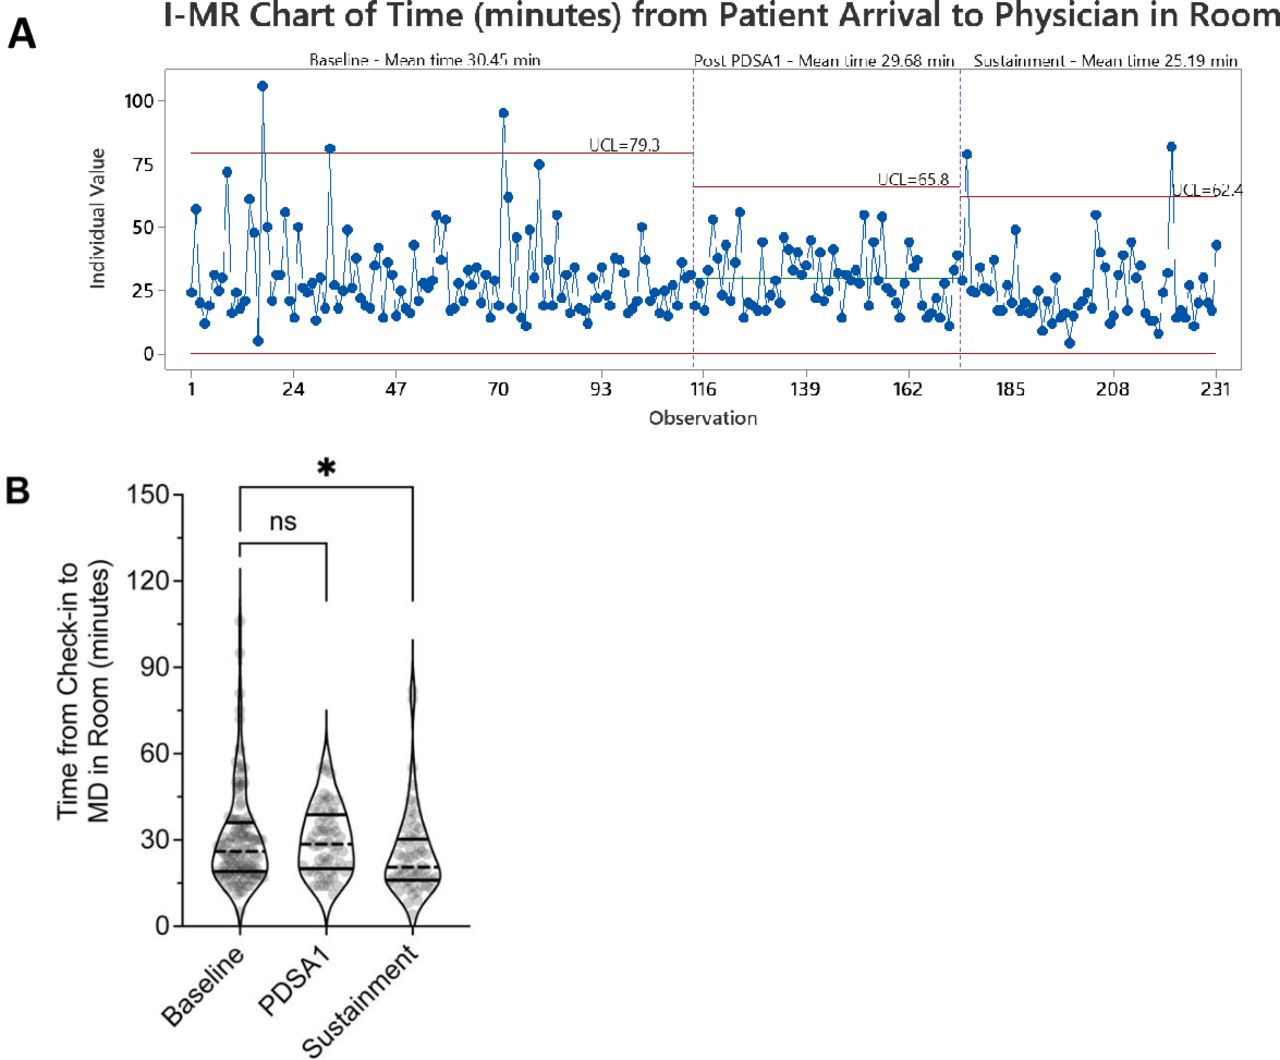
Reduction in wait time variation immediately after implementation of checkout sheet and reduction in mean wait time during sustainment. (A) I-MR charts of time (min) from patient arrival to physician in the exam room showing mean and control limits for each phase, including points beyond control limits. (B) Violin plot showing reduction in variance between baseline and PDSA1 (F-test, p=0.0013), and reduced waiting time between baseline and sustainment period (two-tailed unpaired t-test with Welch’s correction, 30.5 min vs 25.2; *p=0.0398); black solid line=interquartile, mean=dashed black line. PDSA, plan–do–study–act; UCL, upper control limit.
Balancing measure: process change impact on physician–patient contact time
After changing our processes, we wanted to ensure that the physician visit time was not reduced. Thus, we examined the mean time physicians spent with patients during new and established patient visits across the PDSA cycles. We found that none of the interventions had a negative effect on the physician–patient time (ordinary two-way ANOVA, p=0.7115) with the interaction between periods (baseline vs PDSA cycles) accounting for 0.25% of total variance.
Staggered start times: impact on time spent waiting in the lobby
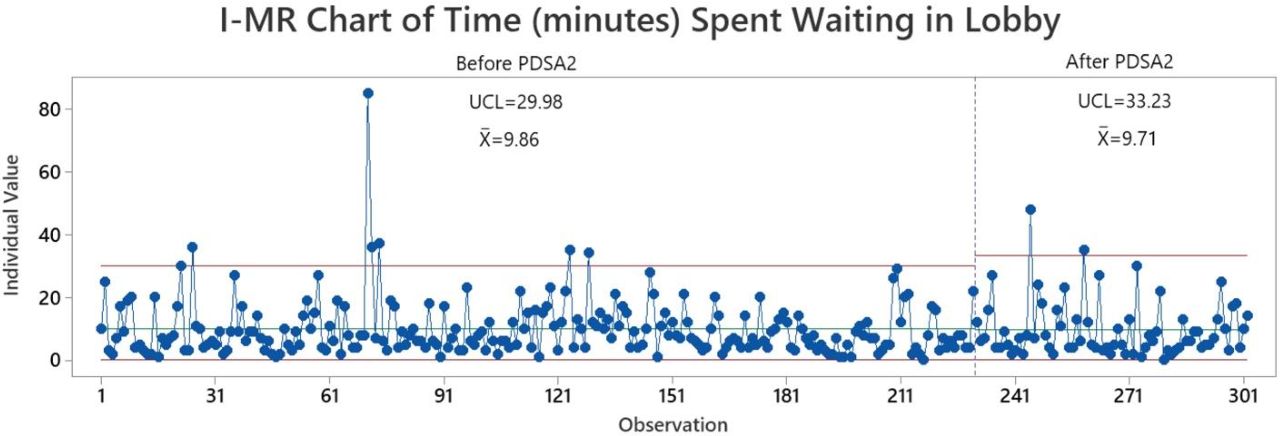
For our second PDSA cycle, we hypothesised that staggering physician start times would impact the time patients wait in the lobby. When comparing pre and post data (figure 3), we did not observe any reduction in the mean (9.86 vs 9.71 min; p=0.8995) or SD (8.97 vs 8.91; p=0.4948) for time spent waiting in the lobby.
I-MR chart of time (min) spent waiting in lobby demonstrates no change following staggered start times. Time spent waiting in the lobby before and following PDSA2, staggered start times, demonstrates no difference in mean or SD (9.86 vs 9.71; p=0.8995 and 8.97 vs 8.91; p=0.4948, respectively). Both before and after, many points are outside the control limits, consistent with an unstable process. PDSA, plan–do–study–act; UCL, upper control limit.
Late arrivals: impact on wait time for subsequent patients
We hypothesised that there may be a ‘domino effect’ that resulted whenever patients arrived late to their appointment, with a late arrival negatively impacting the subsequent patients’ overall wait time. To assess this, we examined the impact of arrival order on wait time, hypothesising that those patients with a later arrival order would wait longer. Using linear regression models to assess the relationship between arrival order and time from check in to physician in the exam room, we found a weak, non-significant, negative correlation during the baseline period (online supplemental figure 3B,F), slope of best-fit line=–0.6598, p=0.0979), suggesting that patients arriving later (eg, the fourth patient of the morning as compared with the first) were actually waiting less. This negative correlation in the slope of the best-fit line was reversed during the subsequent PDSA cycles, but it was not statistically different compared with the baseline (Brown-Forsythe ANOVA test, p=0.7068). The per cent of patients who arrived later than their scheduled appointment time ranged across phases of the project, from 14% to 36%. We found that, at baseline, most of the late-arriving patients waited less than the early-arriving patients (online supplemental figure 3B, two-tailed, unpaired t-test with Welch’s correction, p=0.0025). This phenomenon was corrected for after the implementation of PDSA-1 (during the sustainment period, and after PDSA-2 (online supplemental figure 3C–E).
Supplemental material
Discussion
Our work demonstrates practical application of quality improvement methodology and tools to reduce patient wait times, an issue that frustrates patients and physicians alike. Rather than relying on assumptions or inappropriately grounded observations, we leveraged proven tools to help us understand our baseline process, to understand where best to intervene and to study the impact of our changes. Using these methodologies and tools, we observed an initial 26% reduction in the variation of wait time and a final 17% reduction in the mean wait time.
Several factors which we hypothesised might affect wait times did not have a statistical impact, including patient age, time of day and physician. For example, we hypothesised that younger patients may take longer to room due to cooperation, but this was not the case. Rather than cater decision making and processes to these subgroups, then, we were able to focus on broader efforts affecting all groups. Mapping our process and examining NVAT identified bottlenecks which informed our redesigns—implementation of a checkout sheet and staggering physician start times.
We used process control charts to examine the impact of our changes. Immediately following our first PDSA cycle, there was less variation in wait times. When new processes are implemented, reduced variation is often seen before there is a change in a mean, a Lean Six Sigma concept. In our case, while this reduced variation did not remain significant in the sustainment phase, there was improvement in mean wait time during the sustainment phase. Our work also demonstrates use of a balancing measure, which is important to include since improvement in one area can shift focus and potentially lead to deficiencies in other areas.5 While our goal was to reduce overall wait time as well as variation in wait time, we did not want to do this at the expense of time spent with the physician. We were able to demonstrate that our changes did not have an impact on time spent with the physician. We also explored how a process might have downstream impacts, by examining the relationship between arrival order and wait time. We were not able to appreciate the suspected ‘domino effect’ that we hypothesised.
Limitations
As is often the case in improvement work, our initial project aim differed from our final aim. At the start of our project, we planned to assess changes in the overall NVAT for patients. While this remains an important outcome metric, we believe that it will take more time and further improvements to ultimately reduce this value. In order to better assess our progress towards this broader goal, we ultimately chose to narrow our focus to the time from patient arrival to the physician entering the room and also wait time in the lobby. These might be viewed as process metrics which are ultimately a piece of the larger NVAT outcome metric. We anticipated that these smaller parts of the process were ones that we had a greater ability to impact in the short term. Because we made this change while in the midst of our project, our specific aim for this work is stated more broadly, without specification of a baseline, desired amount of improvement, or an exact timeline.
Through the use of process control charts, we determined that our baseline process had several points above the upper control limits, suggestive of special cause variation vs an unstable process. When we examined these points in more detail, most of them were explained by patients who arrived very early for an appointment. This might be considered special cause variation, but the fact that it occurred multiple times would suggest that it is an event that could happen again. We did not implement any specific intervention to address this during the scope of this project, but it is an area of future opportunity. Similarly, both before and after implementation of staggered start times, there were many points above the upper control limits, suggestive of special cause variation versus an unstable process. Many of these points were also explained by patients who arrived early, but there are other points outside the limits that do not have a clear explanation. Taken together, these data suggest an unstable process, making detection of meaningful change difficult.
While a greater number of time observations would have made our work more statistically rigorous, improvement work is also meant to be practical. After confirming that our data were normally distributed and would therefore require fewer data points to assess the impact of our interventions, we decided to collect 1 week’s worth of data after each intervention. We recognise that 1 week may not be sufficient to fully capture the impact of our interventions and are therefore cautious about drawing definitive inferences from these data. For example, we were unable to appreciate the ‘domino effect’ we hypothesised. This could be because we did not have enough data to detect such an effect. Alternatively, it is possible that other factors, such as a patient that does not show up, allows enough catch up that subsequent patients are not significantly impacted. It is also possible that we make up for lost time by rooming some patients more quickly. For example, a patient who arrives late may be rushed through the rooming process, though this would need further exploration.
Another limitation is the assumption of similarity between project phases. For example, it would be impractical to assume that external factors remain unchanged, such as the weather, traffic and other sociocultural events that might impact a patient’s ability to arrive on time. There was also internal variation in our clinic, with differing numbers of staff and learners, and we did not directly consider the impact that these variations might have on our processes and therefore data. Failure to see improvement but also perceived improvement after a new process cannot definitively be attributed to that new process alone. For example, we cannot quantify the exact impact that our intervention had as other unmeasured factors may also have contributed to the observed changes.
Understanding which specific time parameters measured are most pertinent to the overall experience of patient wait time is also not something addressed by our study. For example, we chose to examine time from patient arrival to the physician entering the room. An alternative option would be to look at the elapsed time from the patient’s appointment time to the physician entering the room. Each of these has strengths and weaknesses, including the ability to detect a change but also the potential to draw inaccurate conclusions. These pitfalls are not unique to our work and highlight the need for further research and standardisation around how best to capture workflow processes.
Conclusion
We used process improvement methodologies to reduce patient wait times in our paediatric rheumatology clinic. While other ambulatory clinics may have differing patient demographics and/or processes from ours, our work provides insights into metrics which might be important to examine and how to assess the impact of various other factors. Even more importantly, our work serves as a model for applying quality improvement methodology and tools to a setting not as commonly discussed in the quality literature.
Data availability statement
No data are available. Deidentified participant data were used in this study. Data are not in a repository and are not available for reuse.
Ethics statements
Patient consent for publication
Ethics approval
The protocol used for this study was approved as exempt by the Institutional Review Board at the University of Minnesota.
Acknowledgments
We thank all the members of the University of Minnesota Quality Improvement Collaborative for their comments and support. We would like to extend our special thanks to Ken Madden for his technical knowledge and comments throughout this process. Finally, we would like to thank the members of the University of Minnesota Paediatric Rheumatology Clinic for their participation.
Supplementary materials
Supplementary Data
This web only file has been produced by the BMJ Publishing Group from an electronic file supplied by the author(s) and has not been edited for content.
Footnotes
Contributors BG and DRB were responsible for study design and oversight, data collection, data analysis and drafting the manuscript. DRB is the guarantor and accepts responsibility for the work, had access to the data, and controlled the decision to publish. All other authors (DE, BAB, CKC, NF, PMH, AH, SM, MMR, SK, SX, RKV) were involved in study procedures and implementation of changes in our clinic and have reviewed/edited and approved the final manuscript.
Funding BG is supported by NIH Medical Scientist Training Programme T32 grant (NIGMS 2T32GM008244-33). This work was funded by the University of Minnesota Health (MHealth) Quality Improvement Collaborative, a collaboration between University of Minnesota Physicians and University of Minnesota Medical Centre (no award/grant number).
Competing interests None declared.
Provenance and peer review Not commissioned; externally peer reviewed.
Supplemental material This content has been supplied by the author(s). It has not been vetted by BMJ Publishing Group Limited (BMJ) and may not have been peer-reviewed. Any opinions or recommendations discussed are solely those of the author(s) and are not endorsed by BMJ. BMJ disclaims all liability and responsibility arising from any reliance placed on the content. Where the content includes any translated material, BMJ does not warrant the accuracy and reliability of the translations (including but not limited to local regulations, clinical guidelines, terminology, drug names and drug dosages), and is not responsible for any error and/or omissions arising from translation and adaptation or otherwise.