Article Text

Abstract
The aim of this study was to investigate the effectiveness of customised safety interventions in improving the safety cultures of both clinical and non-clinical hospital staff. This was assessed using the Safety Attitude Questionnaire-Chinese at baseline, 2 years and 4 years after the implementation of safety interventions with a high response rate ranging from 80.5% to 87.2% and excellent internal consistency (Cronbach’s alpha=0.93). The baseline survey revealed a relatively low positive attitude response in the Safety Climate (SC) domain. Both SC and Working Conditions (WC) domains were shown to have increased positive attitude responses in the second survey, while only the Management Perception domain had gained 3.8% in the last survey. In addition, safety dimensions related to collaboration with doctors and service delays due to communication breakdown were significantly improved after customised intervention was applied. Safety dimensions related to safety training, reporting and safety awareness had a high positive response in the initial survey; however, the effect was difficult to sustain subsequently. Multilevel analysis further illustrated that non-clinical staff were shown to have a more positive attitude than clinical staff, while female staff had a higher positive attitude percentage in job satisfaction than male staff. The results showed some improvements in various safety domains and dimensions, but also revealed inconsistent changes in subsequent surveys. The change in positive safety culture over the years and its sustainability need to be further explored. It is suggested that hospital management should continuously monitor and evaluate their strategies while delivering multifaceted interventions to be more specifically focused and to motivate staff to be enthusiastic in sustaining patient safety culture.
- healthcare quality improvement
- health policy
- patient safety
- safety culture
Data availability statement
All data relevant to the study are included in the article or uploaded as online supplemental information.
This is an open access article distributed in accordance with the Creative Commons Attribution Non Commercial (CC BY-NC 4.0) license, which permits others to distribute, remix, adapt, build upon this work non-commercially, and license their derivative works on different terms, provided the original work is properly cited, appropriate credit is given, any changes made indicated, and the use is non-commercial. See: http://creativecommons.org/licenses/by-nc/4.0/.
Statistics from Altmetric.com
Introduction
Safety culture1,2 is the product of individual and group values, attitudes, competencies and patterns of behaviour that determine commitment to organisations’ health and safety programmes and practices.3 4 ‘Safety climate’ refers more specifically employees’ perceptions of practices, policies and routines related to organisational safety culture.5 6 Poor hospital safety culture leads to negative impacts on clinician behaviours and safety processes,6–8 reduced patient safety,9 increased medical errors10 and under-reporting of errors,11 thereby increasing mortality rate.1 12 13 Improved patient safety culture is significantly associated with decreased adverse event rates, reduced mortality rates and increased family and patient satisfaction.7
Studies have elaborated contributing factors for consolidation of safety culture in the hospital environment.14 15 A participatory management approach, and commitment from all workers are critical.14 Teamwork with interaction and transparency, professional appreciation, management support, protocol implementation, job satisfaction and working conditions also help in building a positive safety culture.14 Multilateral approaches to enabling a safety culture are needed.15–19 Additionally, hospital management should determine needs, initiatives and programmes to minimise clinical risks, conduct continuous assessment of safety culture, and make consistent use of surveys to identify problems.20 Moreover, a lasting safety culture requires continuous work that engages board members, develops leaders throughout the organisation, ensures a just culture and builds trust, respect and inclusion, allowing staff and patients to feel comfortable to voice their safety concerns.21
Views of safety culture vary among health professional groups.22 Health managers reported more positively on patient safety culture compared to nurses and allied health professionals, who in turn were more positive in their views than doctors. All groups reported a more positive view of individual ward safety culture than of overall hospital safety culture. Therefore, it is challenging to identify proven strategies and tactics to pursue safety culture, as views vary among hospital settings, patient types and infrastructure.23 Organisations should integrate learning activities that refine and reinforce processes such as continuous monitoring, reflection and feedback on safety outcomes.24–26
Safety cultural assessments provide valuable insight into leadership and staff perceptions and allow the identification of strengths and weaknesses of an organisation’s safety culture1 4 that require interventions.27–29 Combining cultural assessment questionnaire and cultural safety interventions can improve incident reporting and raises safety awareness.30 Available tools31 such as the Patient Safety Climate in Healthcare Organisations survey (PSCHO)32 emphasise leadership assessment, while others, such as the Safety Attitude Questionnaire (SAQ),24 focus on individual staff characteristics and perceptions; these tools vary in psychometric and methodological strength.1 31–39. Most previous studies focused on senior clinical and administrative leaders40 and other specific staff groups22 41 42 This study assessed the impact of interventions on four staff-related themes: (1) leadership commitment; (2) promotion of a culture of trust, reporting and learning; (3) teamwork and communication establishment and (4) creation of a supportive organisational environment for safety culture for all working staff. It was hypothesised that customised multifaceted interventions and safety surveys would enhance and consolidate safety culture.
Methods
Setting
This 4-year longitudinal prospective study used review and audits to evaluate changes in safety culture after implementing safety interventions from 2014 to 2018 in a regional rehabilitation hospital with approximately 230 staff members and 300 beds. The hospital provides infirmary care for severely disabled patients and physical rehabilitation to help patients reintegrate into the community. Medical doctors, nurses, allied health professionals and supporting and administrative staff compose multidisciplinary teams to serve patients (table 1) under the Hospital Authority in Hong Kong. Interventions were implemented in response to frontline feedback, annual auditing and the consultancy report for hospital accreditation in 2016.
Patient Public Involvement
Feedback from patients, caregivers, and volunteer self help groups were collected for service improvement through scheduled meeting with the clinical team every half year. No patients were involved or recruited in the surveys.
Four strategies were applied and quality improvement exercises were designed to encourage active participation, knowledge and caring skills (see online supplemental appendix 1). This study received ethics approval from the Joint Chinese University of Hong Kong-New Territories East Cluster Clinical Research Ethics Committees.
Supplemental material
Demographic characteristics of respondents
Interventional strategies: themes
Four strategies were established. Dimensions and times of interventions are in online supplemental appendices 1 and 2.
Theme 1: leadership commitment at all levels
Patient safety culture was driven by vision and commitment to organisational management.43 Participatory management was implemented, with multidisciplinary leadership walk rounds to encourage involvement of all stakeholders, strengthen direct communication with front-line colleagues and identify potential hazards or defects through analysis of problems. This helped develop strategies to tackle identified clinical/non-clinical risks, which was followed up and monitored by unit in charge. Hospital leaders also provided evidence of financial support of safety-related projects such as equipment modernisation, pressure injury relief and fall prevention. This began at individual ward level and spread to other wards once the expected results were achieved. Measurable outcomes, such as pressure injury incidents or patient fall rate, were shared in unit meetings to determine if changes resulted in desired effects.
Theme 2: promote culture of trust, reporting and learning
Positive safety culture is founded on mutual trust, shared perceptions of importance of safety and confidence in efficacy of preventive measures, and enables safe and reliable healthcare consistently over time.44 Hospital management fostered learning and participation in patient safety through staff forums and event-sharing sessions, promoting an open culture, fostering reflection on safety issues and ensuring understanding of behaviour expectations and the ways in which violations were managed. Staff were also encouraged to participate in workshops on the Model for Improvement, Lean or Six Sigma, to facilitate staff interaction, communication and respect for the diversity of knowledge among disciplines. Educational materials and game booths incorporated with safety training components illustrated harm events and suggested actions towards the identified risks. To foster staff trust and appreciation, staff efforts in risk reduction and quality improvement were highly praised by management.
Theme 3: commit to and communicate priority of patient and workforce safety through improvement of teamwork
Interprofessional teamwork is critical for high-quality care, staff morale and patient safety.45 46 Hospital management supported front-line staff to present their ideas and accept diversity. They strengthened effective teamwork within and across units through staff empowerment workshops and team-building coaching exercises. Staff were equipped to manage conflict resolution and problem-solving skills that go beyond individual goals in favour of improvements to consolidate patient safety. Hospital management also encouraged reporting of errors and near misses through internal sharing sessions and open communication with non-punitive responses to errors. Clinical service gaps such as inadequate handover and interdepartment communication breakdown that led to potential clinical risks were identified through regular reviews and surveys. Promulgation of electronic documentation and implementation of a structured communication tools, namely SBAR (Situation, Background, Assessment, Recommendation)47 48 facilitated rapid communication and understanding of facts based on which team members or staff can make decision. These workflows were closely monitored and reviewed by the quality and safety team as well as regularly audited by individual units.
Theme 4: create supportive working conditions to enable staff and provide a quality care environment
Hospital management support and staff adequacy were considered the strongest predictors of staff perceived patient safety.49–51 As staff shortages have been critical in recent years, retention strategies, including financial support and enhanced transportation services, were addressed. Inadequate physical space for care activities may also cause discontentment and psychological distress in staff, leaving them vulnerable to work-related accidents and compromising the work process.52 An environmental improvement plan was, therefore, implemented to modernise hospital hardware and to study space utilisation in the hospital. Hardware reconstruction such as resurfacing of the main aisle to cater to patient needs, renewal of air conditioning and ventilation in the treatment areas was carried out to provide a better and safer working condition. Technology support was enhanced through the introduction of a locally developed closed-loop system, the in-patient medication order entry system (IPMOE) to improve operational efficiencies and for the standardisation of medication management to minimise medication errors.
Measurement
Staff views on organisational safety culture were assessed using a validated Chinese version of the short-form SAQ (SAQ-C) (online supplemental appendix 3).42 53 54 This self-administered survey was distributed to all staff anonymously. The SAQ was directly associated with hospital staff55 and patient outcomes (eg, number of adverse events).35 56 57 It is an excellent psychometric tool with good internal consistency, structural validity and reliability54 58 applied in studies with large sample sizes59 and in many languages.53 59–61 The SAQ-C comprised demographic information and 42 core items related to five safety domains and nine safety dimensions. The five safety domains included (1) teamwork climate (TW), (2) safety climate (SC), (3) job satisfaction (JS), (4) management perception (MP) and (5) working conditions (WC). The stress recognition (SR) domain in the complete SAQ was omitted in this study because it did not fit into the overall safety climate construct of the SAQ.62 The remaining nine safety dimensions assessed staff attitudes toward their collaboration with other disciplines, their perceptions of hospitals’ encouragement of safety training and reporting, and delays caused by communication breakdowns in clinical areas, which were graded on a 5-point Likert scale. A positive attitude to a given dimension was counted when the final average score was 75 or higher.
Supplemental material
Data collection
During the 4-year period, three rounds of biannual cross-sectional surveys using the SAQ-C were conducted. A 2-week survey period was scheduled for the same month in each survey to minimise seasonal effects. Paper-based SAQ-C was sent to all departments, and all responses remained anonymous to encourage participation and open answers. A collection box was placed to facilitate the questionnaire collection, and reminder emails were sent to all staff near the end of the data collection period.
Statistical analysis
IBM SPSS Statistics for Windows, V.25 (IBM) was used to review the staff’s views on the effectiveness of the safety strategies. Staff were categorised as clinical (doctors, nurses, allied health and supporting) and non-clinical staff (management or administrative). Trend changes in mean score and the positive attitude percentage of each safety domain and dimension over the three survey points were analysed to review the effectiveness of safety interventions and modified strategies accordingly. Since only two medical doctors were stationed in the hospital during the survey period, their returns were excluded. All incomplete or invalid questionnaires were also excluded. A multilevel linear modelling analysis was adopted to determine the changes in a specific average subscale score with potential factors, including demographics and job disciplines.
Results
Demographics
The number of staff who responded to the survey ranged from 186 to 197 over the three survey points. The response rates were 87.2%, 82.1% and 80.5%, respectively. This study had excellent internal consistency of the SAQ-C (Cronbach’s alpha=0.93), and less than 10 invalid or incomplete questionnaires were excluded in each survey. Demographically, nursing staff and supporting staff accounted for the majority of the respondents (average 40.6% and 47.4%), and about 8.1% of the total respondents were from management. Most of the staff were female (79%), and the age group above 50 comprised more than 40% of the respondents (table 1).
Staff’s view towards hospital safety culture
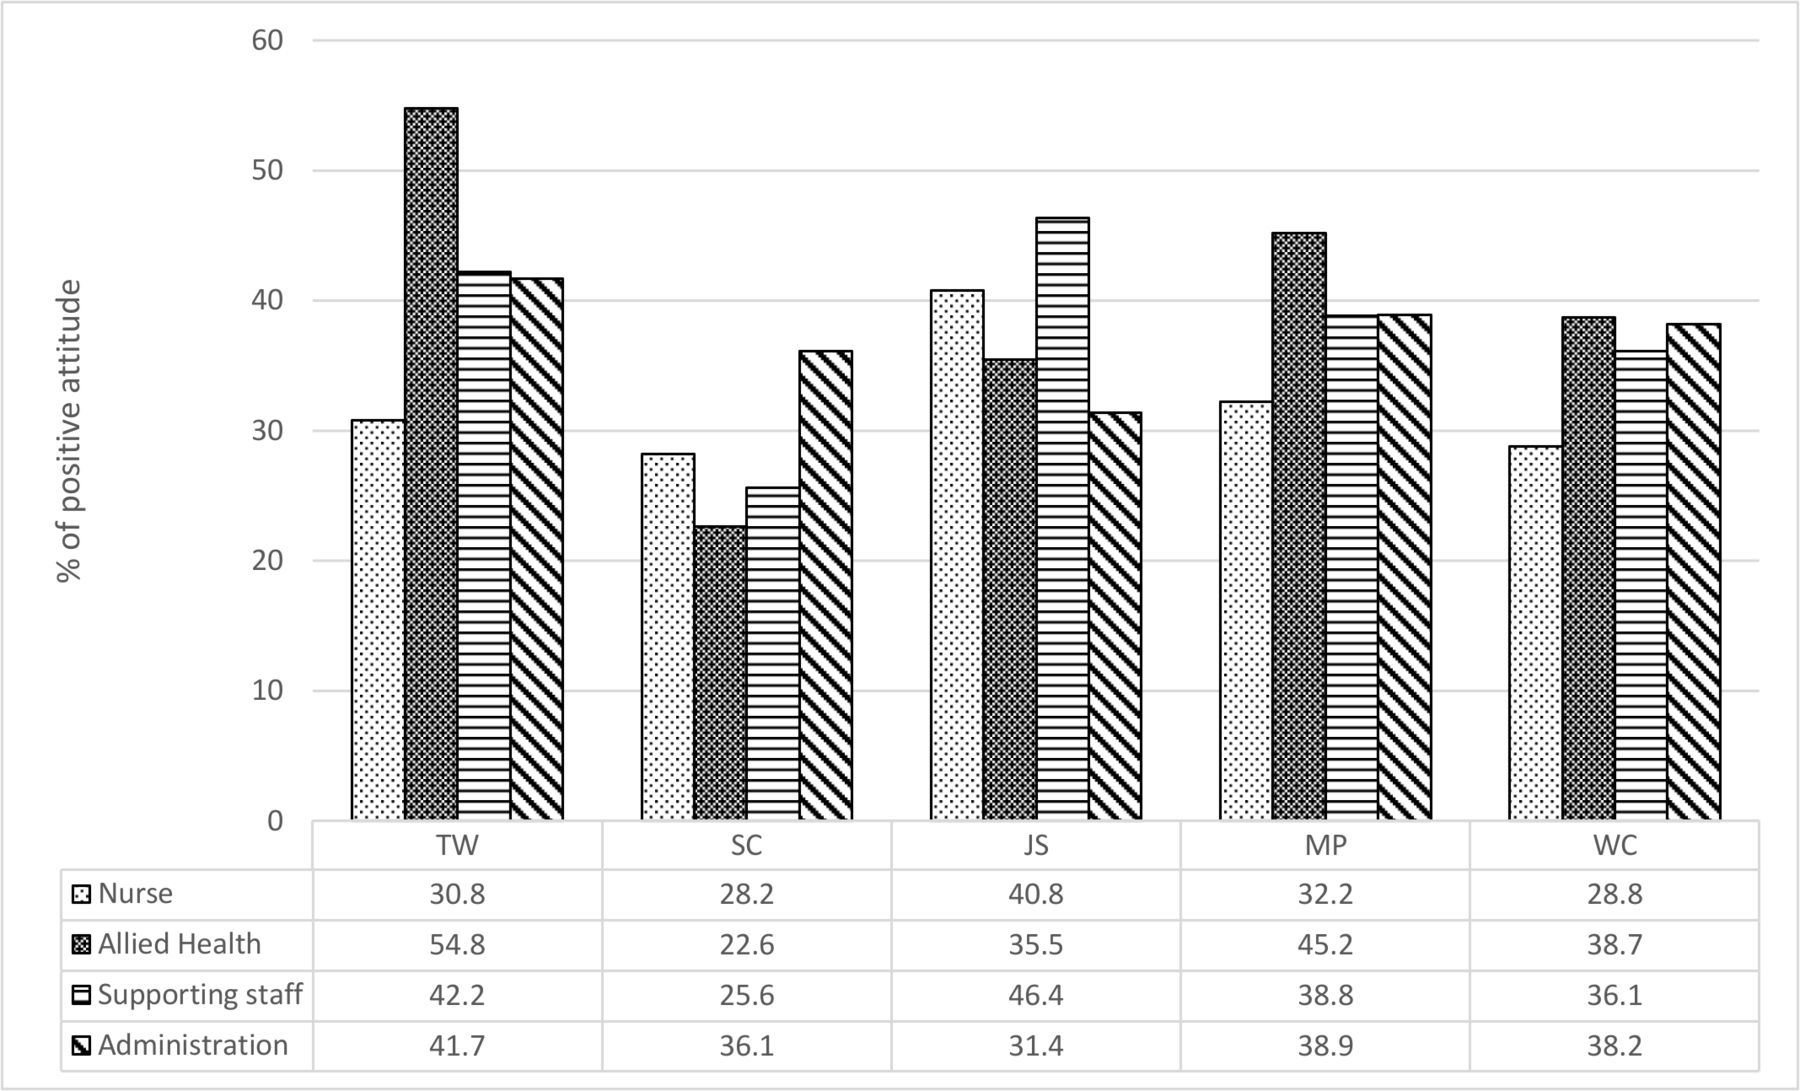
A comparison of the positive attitude trend changes in the five safety domains across the three survey points among disciplines was performed (figure 1). The SC domain held a lower percentage of positive attitudes in most disciplines (nurse, allied health and supporting staff). Variations in positive attitudes toward different safety domains were found among disciplines. Allied health staff were shown to have the highest percentage of positive attitudes in TW (54.8%), MP (45.2%) and WC (38.7%), while nursing and supporting staff had the highest percentage of positive attitude in JS (40.8% and 46.4% respectively). In contrast, the nursing staff had an average lower positive attitude percentage in TW (30.8%), MP(32.2%) and WC (28.8%) than other disciplines. Multilevel linear modelling analysis further showed that nursing staff had less positive attitudes than administrative staff in the teamwork domain.

Average positive attitude percentage among different healthcare disciplines in five safety domains during the survey period. Data are shown as the average percentage (%) of positive attitudes held by different healthcare disciplines in five safety domains within the survey period from 2014 to 2018. The bar chart indicates different healthcare disciplines, and the number in the table indicates the percentage of positive attitude in each safety domain. Allied health staff in general had a higher positive attitude percentage in TW, MP and WC domains, while nurses had a lower positive attitude percentage in TW, MP and WC domains. TW, teamwork climate; SC, safety climate; JS, job satisfaction; MP, management perception; WC, working conditions.
Mean score changes in safety domains and safety dimensions
The summary statistics revealed that the mean scores of different safety domains or dimensions changed during the study period. In general, all safety domains had a mean score above 60, and they increased in the second and third surveys. However, the mean scores in JS and MP were lower in the subsequent surveys than in the baseline survey (table 2). The mean score in all safety dimensions was similar in the second and third surveys, except for safety dimensions related to prioritising safety training, encouraging safety reporting and safety awareness. The mean scores significantly decreased in subsequent surveys (table 3).
Positive attitude percentage trend changes in safety domains across three surveys
Positive attitude percentage trend changes in safety dimension across three surveys
Positive attitude percentage trend changes in safety domains and safety dimensions
Regarding the positive attitude percentage trend changes in all safety domains, the SC had the lowest positive attitude percentage (30.6%–19.4%), while the JS (45.8%–41.4%) had the highest percentage across the three surveys. The SC and WC recorded some positive gains in the second survey, while only the MP domain showed a 3.8% positive change in the last survey when compared with the baseline result (table 2, figure 2).

Positive attitude percentage change of safety domains across three surveys. The bar chart indicates the positive attitude percentage (%) changes in each safety domain across the three surveys, and the number in the table indicates the percentage of positive attitude in each safety domain. JS had an average higher positive attitude percentage, and SC had a lower positive attitude percentage throughout the survey period. There was a significant decrease in staff holding a positive attitude percentage in the SC domain in the last survey. TW, teamwork climate; SC,safety climate; JS, job satisfaction; MP, management perception; WC, working conditions.
The nine safety behaviour dimensions showed a higher percentage of positive attitudes and mean scores than the five safety domains (table 3, figure 3). The safety dimension related to service delay by communication breakdown (B6) had a definitely low positive attitude percentage (27.4%) and mean score (50.7, SE=25.6) than others. However, there was a significant improvement in the percentage of positive attitudes gained in the subsequent surveys (38.3% in the second survey and 33.9% in the third survey). Another safety dimension related to collaboration with the doctor (B2) was also found to have a significant positive change. The percentage of staff holding positive attitudes increased from 52.2% to 63.9% in the third survey. On the other hand, those dimensions related to safety training and reporting (B7–B9) were noted to have a high positive attitude percentage (75.1%–63.7%) and mean score (76.6 (SE=23.9) to 71.1 (SE=20.4)) in the initial phase. However, this effect could not be maintained in subsequent surveys.

Positive attitude percentage change of safety dimensions across three surveys. The bar chart indicates the positive attitude percentage (%) changes in each safety dimension across the three surveys, and the number in the table indicates the percentage of positive attitude in each safety dimension. Both B2 and B6 had a lower positive attitude percentage than the other safety dimensions, and improvements were shown in subsequent surveys. B7–B9 showed a decreasing trend in positive attitude percentage across the survey period. B1, good collaboration with nurse; B2, good collaboration with doctor; B3, good collaboration with allied health staff; B4, good collaboration with supporting staff; B5, good collaboration with administrative staff; B6, service delay by communication breakdown (reverse question); B7, Prioritising safety training; B8, Encouraging safety reporting; B9, Increasing safety awareness.
Clinical and non-clinical staff’s view on hospital safety culture
Multilevel linear modelling analysis showed that non-clinical staff (management or administrative) had better gains in a positive mean score (mean score >6; p=0.04) in TW and SC (mean score >5.8, p=0.019) than clinical staff. Non-clinical staff also had a much higher mean score than clinical staff in the MP domain. However, the non-clinical staff showed no significant difference to clinical staff in the JS domain. Gender differences showed some variation in the perception of safety culture. Female staff generally had a higher mean score than male staff in job satisfaction (p=0.015), and they also seemed to have a higher mean score (p=0.061) in perception of management.
Discussion
The response rates
Response rates are often used to gauge the quality of the surveys. The present study a high response rate of up to 87.2% which reflected that the staff was motivated and the survey was well executed at the initial stage. However, this rate dropped in the following surveys (82.1% and 80.5% in the second and third, respectively). Such changes may be influenced by multiple factors including staff loyalty, lack of incentives (such as honorarium monetary payments), respondent’s demographics and motivation. To sustain a high response rate is not easy, hospital leaders may consider offering surveys over multiple channels such as email, embedding them into newsletters, or even sending the surveys via SMS to allow easy access. Nevertheless, our high response rates (over 80%) of the present study demonstrated the representativeness of the study and minimised non-response bias.
Mean score change in safety domains and safety dimensions
Most of the safety domains and dimensions were shown to have increased mean scores in the second and third surveys. The mean score reflected that staff rated higher or more ‘agreeable’ to the score items in the subsequent surveys. These summaries suggest that the safety interventions had a positive effect on staff recognition of hospital safety. People may argue that means are heavily influenced by extreme scores, as they are skewed. Since the data have been examined to exclude extreme values or invalid questionnaires, such improvement in the total mean score can be considered as the outcome indicator of interventional strategies.
The positive attitude response
Previous research suggests that a 5% improvement in staff with positive attitudes toward the safety domains or dimensions over the two survey time points is clinically relevant.1 63 In the present study, the SC and WC domains and six out of nine safety dimensions improved in staff with positive attitudes ranging from 3.6% to 21.8% in the subsequent surveys. In addition, this study had a positive attitude rate ranging from the lowest of 19% to the highest at 75.1%, which was comparable to another study54 with a 30% to 50% positive response rate in a study of approximately 40 000 staff. Thus, our implementation of the SAQ-C as a self-evaluating process for safety culture and the survey result can be considered a benchmark for future service improvement.
Comparison of positive response percentage and trend change in safety domains and dimensions
Hospital management committed substantial effort to provide a better and safer working conditions and to promote safety culture, which was reflected in the higher positive attitude percentage in JS (>40%) and an increased positive attitude percentage in the SC and WC domains in the second survey. Although the mean scores of most of the safety domains remained similar or slightly increased throughout the survey periods, some of the safety domains, such as the SC, showed a decrease in the percentage of staff holding a positive attitude in the last survey. In fact, the overall positive response changes in the safety domains had some diversity with inconsistency over time. This may indicate that the organisation had difficulties in sustaining the interventional effects or staff enthusiasm toward maintaining a safety culture over time. Nevertheless, the MP domain maintained a slightly positive result in the final survey, which probably reflected the staff’s recognition of management’s commitment to promoting safety culture.
The analysis also showed that non-clinical staff (management or administrative staff) had better mean scores than clinical staff in most safety domains (TW, SC and MP). Comprehensibly, the managerial position ensues more responsibilities and stronger identification with organisational goals.64 Managers are the key persons in fostering hospital patient safety culture; thus, they need to have a stronger vision of safety culture.
In contrast to safety domains, most of the safety dimensions significantly increased in staff holding positive attitudes in the surveys. The significant improvement in the safety dimension B2 ‘good collaboration with doctors’ recognised the effort of management in reforming the medical support system. In response to the low positive attitude percentage in the baseline survey and staff feedback, a new doctor rotation and medical support system was implemented. It addressed the clinical gaps raised by frontline feedbacks, which created a psychologically safe environment and established strong clinical support for frontline staff during non-clinical hours. Another safety dimension (B6—service delay by communication breakdown), which had a very low positive attitude response (27.4%) in the baseline survey, was also considered as a focus on improvement by hospital management. Customised intervention strategies were implemented to reform clinical handover practice in individual departments. Clinical audits with continuous monitoring and evaluation of service gaps minimised the risk of communication breakdown. Technology support such as the execution of electronic documentation of patient records and IPMOE standardised intrahospital and interhospital communication channels and reduced human error. These interventions facilitated and accomplished significant improvement and staff recognition in this safety dimension (B6).
Staff engagement is an essential element for a successful safety culture. Those dimensions related to prioritisation of safety training and encouragement of safety reporting and safety awareness (B7, B8 and B9) were shown to have a high positive attitude proportion and mean score at the initial phase. However, the situation regressed afterward. These changes may reflect the lack of staff motivation to take on roles in the advancement of patient safety, assimilation and taking responsibility for change over time. Moreover, most safety interventions were implemented in a top down manner. Staff participation and engagement in these interventions were too passive, possibly lowering enthusiasm over time and affecting the response rate in the subsequent surveys as well. Since nursing and supporting staff comprise the majority, hospital leaders should further explore and address their concerns and feedback on these safety strategies to refine training and methods so as to facilitate staff participation at a more focused and unit base level.65
Fear of potential litigation or punishment may result in under-reporting of error, which has been shown to significantly decrease staff perception of being encouraged in safety reporting (B8). To lay the groundwork for psychological safety and avoid the fear of disciplinary action, organisations should clearly convey the message to all staff and leaders that it is expected that everyone must create and support psychological safety as a part of their job. Leaders should act as role models, applying learning judiciously and criticism sparingly and admitting to their own failures and mistakes.66 67
Safety climate has been commonly referred to as ‘surface features of the safety culture from attitudes and perceptions of individuals at a given point in time’.35 68 Healthcare provider’s perceptions of safety culture and patient culture can also differ by professional discipline, work area and age group.18 Nurse and supporting staff, being the largest proportion of professionals, had a strong influence on the quality and safety of care and the percentage of staff holding positive results.69 It is imperative for hospital management to revise and customise safety training strategies for these groups of staff in the future.
Similar to previous studies,41 front-line staff consistently reported lower perceived safety compare to the management. The gender difference in JS was consistent with other similar studies.54 70 Female staff had a higher positive mean score and more positive attitude rate in job satisfaction than male staff. In addition, over 40% of staff were aged above 50. Further study is suggested to explore any age-related perceptions of workplace safety which may benefit management’s decision regarding implementation of policies and interventions.
Strengths and limitations of the study
The present study had a long follow-up period with a 4-year cycle. The overall response rates (>80%) were high, as the hospital management team supported the formulation and implementation of safety intervention programmes with policy coordination re-assured and motivated staff to enrol in the survey collection. Potential errors caused by the study design, such as sampling bias are possible. Certain errors due to created information, recall and social desirability bias71 cannot be negated, which are commonly seen in survey studies despite the adoption of anonymous self-administration of surveys, which was shown to reduce social desirability bias.72 Moreover, the Hawthorne effect73 among staff cannot be avoided, as some improvement in safety dimension score may be attributed to their awareness of being observed. However, this impact was reduced by the large sample size of the present study, which included the majority of the staff and minimised the effect of sampling error.
The design of longitudinal data is particularly well suited for stationary populations; however, staff movement due to retirement and rotation is unavoidable. This study did not use personal identifiers to monitor individual changes across time and used them for subgroup analysis according to the organisational role and status of employment. There is a risk of inaccurate conclusions about the true population, which may have changed due to influx/outflux of respondents/staff with different behavioural characteristics than the indigenous population. The personal effect due to professional background, educational level, seniority, job nature and job stress62 74 in front-line staff may also influence findings. It is worth further exploring the influences of these individual and organisational factors on safety culture. Doctors and other healthcare personnel were under-sampled compared to the nurse and supporting staff population, which might also influence the final results. Overall, it may reduce the ability to attribute causality for the improvement observed in the safety domains or dimensions in this study. In addition, the survey results have not been linked to clinical safety parameters. Further studies are recommended to study the correlation between safety indicators and safety culture. Although this study identified some deficits in certain areas (e.g. SC, WC, TW, collaboration with doctors and communication breakdown), lack of a systematic approach to enable teams to redesign processes and achieve outcomes, such as the Plan-Do-Study-Act-Cycle (PDSA), may have caused insignificant changes in the present results. It is recommended that a structural approach be considered to enable staff and to assess the effectiveness or test changes to modify interventions that may lead to improvements75 76 and consolidate safety culture in an organisation.
Conclusion
Organisational culture is an important determinant of patient safety in a healthcare organisation that influences safety outcomes and management systems. Improving safety culture is challenging and time consuming, and the period from implementation to follow-up may have been too short for staff to experience any effect on patient safety. The implementation of a regular review of safety procedures and policies in the present study ensured that staff appreciated management efforts in enhancing safety culture and improved communication and collaboration among staff. While it is posited that the present study applied different interventional strategies and initiatives to promote safety culture, future research should also assess any potential impacts, such as the structure and extent of our hospital safety improvement programmes and the available resources or technology that we did not measure.13 A systematic approach is suggested to examine the process measures and to improve outcomes. Conclusively, the sustainability of a safety culture relies on the collaboration of all staff to create and promote a culture of safety with continuous monitoring by all stakeholders. Staff perception in safety culture and their engagement from all levels remain a puzzle to be solved by hospital management.
Data availability statement
All data relevant to the study are included in the article or uploaded as online supplemental information.
Ethics statements
Patient consent for publication
Ethics approval
The study involves human participants and was approved by the Joint Chinese University of Hong Kong-New Territories East Cluster Clinical Research Ethics Committee (The Joint CUHK-NTEC CREC) CREC Ref. No.: 2014.234.
Acknowledgments
The authors wish to thank Dr LEE Wui-Chiang, MD, PhD, for his permission to use the Chinese version of the Safety Attitude Questionnaire, and all staff in Cheshire Home Shatin (Hong Kong) for their participation in the surveys and the patient and volunteer representatives for their feedbacks. Special thanks to Professor Eliza, WONG Lai Yi, from Chinese University Hong Kong for her advice regarding in methodology; Ms Kitty MAK Yuen Man, Mr David WONG and Mr Lloyd LY CHAN for their technical support and assistance in the project. We would like to thank Editage (www.editage.com) for English language editing.
References
Supplementary materials
Supplementary Data
This web only file has been produced by the BMJ Publishing Group from an electronic file supplied by the author(s) and has not been edited for content.
Footnotes
Collaborators Dr LEE Wui-Chiang, MD, PhD, Professor Eliza, WONG Lai Yi, CUHK, Ms Kitty, MAK Yuen Man, Mr David, WONG, Mr Lloyd, LY CHAN. All staff in Cheshire Home Shatin (Hong Kong) and the patient and volunteer self help groups.
Contributors SYW: conceived the study, collected data, analysed and interpreted data and drafted the manuscript. AF: designed the study and critical review. JH and JL: conducted critical reviews. MCL: helped conceive the work and critical reviews.
Funding The authors have not declared a specific grant for this research from any funding agency in the public, commercial or not-for-profit sectors.
Competing interests None declared.
Patient and public involvement statement Feedback from patients, caregivers, and volunteer self-help groups were collected for service improvement through scheduled meeting with the clinical team every half year. No patients were involved or recruited in the surveys.
Provenance and peer review Not commissioned; externally peer reviewed.
Supplemental material This content has been supplied by the author(s). It has not been vetted by BMJ Publishing Group Limited (BMJ) and may not have been peer-reviewed. Any opinions or recommendations discussed are solely those of the author(s) and are not endorsed by BMJ. BMJ disclaims all liability and responsibility arising from any reliance placed on the content. Where the content includes any translated material, BMJ does not warrant the accuracy and reliability of the translations (including but not limited to local regulations, clinical guidelines, terminology, drug names and drug dosages), and is not responsible for any error and/or omissions arising from translation and adaptation or otherwise.