Article Text

Abstract
Background Healthcare organisations require systems to consistently meet the needs of their patients while providing excellent quality of care. The value improvement (VI) approach was developed by the Institute for healthcare improvement and successfully piloted at Raigmore Hospital, Scotland. It showed positive results in improving outcomes and reducing costs. Our multidisciplinary team from a tertiary care cardiac hospital in Doha, Qatar wanted to see if we could improve value in a clinically and geographically distinct context. We sought to understand the effectiveness of this approach as an integrative management philosophy that aims for continuous improvement in the quality of services by increasing efficiency and reducing waste.
Methods This study evaluates the outcomes achieved from applying the VI methodology. The method is rooted in a framework that emphasises standardisation, continuous process improvement and rightsizing capacity to demand. The main tools include a data box score, a visual management board and weekly communication huddles.
Results As a result of the VI methodology, our team achieved improvements across performance, staff capacity and cost domains. Compared with the 4–8 weeks baseline data collection period, these improvements included an increase in discharges before 13:00 hour by 61%, a reduction in the number of blood samples per patient per day by 20%, an increase in nursing time spent in direct patient care by 18%, and an increase in staff satisfaction to 40%.
Conclusions We found that the VI approach offered a systematic method for continuously improving the quality of care by focusing attention each week on safety, efficiency and patient experience. The team improved numerous processes and outcomes resulting in a positive impact on patients and families and increased the engagement of staff in continuous improvement. In this way, we improved our capacity to undertake and complete quality projects.
- quality improvement
- communication
- evidence-based practice
- teamwork
Data availability statement
All data relevant to the study are included in the article or uploaded as supplementary information.
This is an open access article distributed in accordance with the Creative Commons Attribution Non Commercial (CC BY-NC 4.0) license, which permits others to distribute, remix, adapt, build upon this work non-commercially, and license their derivative works on different terms, provided the original work is properly cited, appropriate credit is given, any changes made indicated, and the use is non-commercial. See: http://creativecommons.org/licenses/by-nc/4.0/.
Statistics from Altmetric.com
Introduction
Resources available to the healthcare industry are limited. Faced with escalating costs and ever-increasing demands on the healthcare system, there is an urgent need to increase efficiency and address gaps in the quality of care being delivered to patients. The only reasonable way forward requires us to create a true value-based healthcare system that controls costs, improves efficiency, eliminates waste and deliverer high-quality outcomes. Changing the way, we deliver healthcare requires process redesigns to improve quality and limit cost thereby increasing value.
Value in healthcare was defined by Porter using the equation ‘value=outcomes/cost’, which equates value with the achievement of the best outcomes at the lowest cost.1 2 In 2008, the Institute for Healthcare Improvement (IHI) created a framework for the delivery of high value care. Dubbed the Triple Aim, it is centred on three goals: improving the individual experience of care; improving the health of population; and reducing the per capita cost of care.3 4
If one considers improving population health and patient experience as two complementary aspects of better quality, then the Triple Aim can be restated so that it forms the equation:
The Triple Aim = (population health +patient experience)/cost per capita.
This leads us back to Porter’s equation as:1 2
(Population health +patient experience)/Cost per capita=value.
To address value, the IHI innovation group developed the value management approach. At another institution (Raigmore Hospital, Inverness, Scotland), this approach was shown to improve outcomes and reduce costs specifically in the context of respiratory care5
To improve value at the unit level, we at Heart Hospital (HH) began working with the IHI and Hamad Healthcare Quality Institute (HHQI) to further develop the value management approach. Emphasising on the improvement aspect, we have rebranded it as value improvement (VI). This approach described elsewhere in detail,5 uses improvement science and three new concepts, a ‘box score’ of measures, a ‘visual management board’ and weekly staff ‘huddles’ to drive rapid cycle improvement.
In this publication, we report on our effort to pilot VI approach. The report is written using the Standards for QUality Improvement Reporting Excellence V.2.0 format.6
Problem description
HH leaders had identified gaps in clinical outcomes as well as in patient and staff satisfaction. We had issues with delayed discharge from patient care units (only 9% of our patients were leaving units before 13:00 hour), skin issues including pressure injuries were on the rise (2–3 per week), venous thromboembolism risk assessment compliance was poor (5%) and many more (table 1). Taken together, these problems were adding a burden to the system in terms of extra cost as well as suboptimal patient outcomes.
Initial measures and improvement Projects*
An earlier collaboration with the IHI addressed several of these opportunities for improvement and demonstrated that by employing the model for improvement (MFI) and engaging multidisciplinary teams, improvement was possible.7 The MFI relies on three key components: setting an explicit aim statement, defining measures, and selecting small changes to test using Plan-Do-Study-Act (PDSA) cycles.8 To build on our previous efforts as a way of learning, the recently developed VI methodology was tried with focus on capacity and cost in addition to performance measures.
Setting
Hamad HH is a 114 in patient and 28 emergency department bedded tertiary cardiac care facility in Doha, Qatar and is the flagship cardiac facility for Hamad Medical Corporation, a multi-hospital health system serving the nation of Qatar.
Choosing the right pilot unit was a vital step in this initiative. VI was piloted in a 20-bed cardiac high-dependency unit B (HDU-B). This unit was selected due to low staff turnover, existing QI capability, known presence of several opportunities for improvement and presence of a leader with strong management practices.
This report examines the first year (2018) that we applied VI in our pilot unit, HDU-B.
Context
The Qatar National Health Strategy embraces the Triple Aim-Better Health, Better Care, Better Value.9 The VI approach appeared to be in perfect alignment with the National Health Strategy as it aims to achieve best care always for our patients at an affordable cost.
Rationale
VI was chosen for this work because it examines three areas of healthcare operations—performance, capacity and cost.
Performance and its associated measures encompass what we traditionally think of as quality processes and outcomes.
Capacity includes measures on how we effectively and efficiently use our resources, thereby meeting the capacity and demand. As the backbone of any effective healthcare system is an engaged and productive workforce.10 Capacity building in front-line teams is key to this approach.
Cost is relatively straightforward. Teams use lean accounting principles, which have been increasingly used in manufacturing.11
Aims
Initial aims chosen by the team to work on are mentioned in table 1.
Methods
The VI approach includes four fundamental elements:
A simplified method to display quality, cost and workforce capacity measures on a weekly basis by making a ‘box score’ and exhibiting it in the unit (figure 1).
A visual management system linking measures on the box score to a set of targeted improvement projects, presented in such a way as to engage the entire team and make each project continuously accessible (figure 2).
A communication method, the weekly huddle, during which the multidisciplinary team reviews the visual management board and updated box score data to share progress, brainstorm improvement ideas and address issues (figure 3).
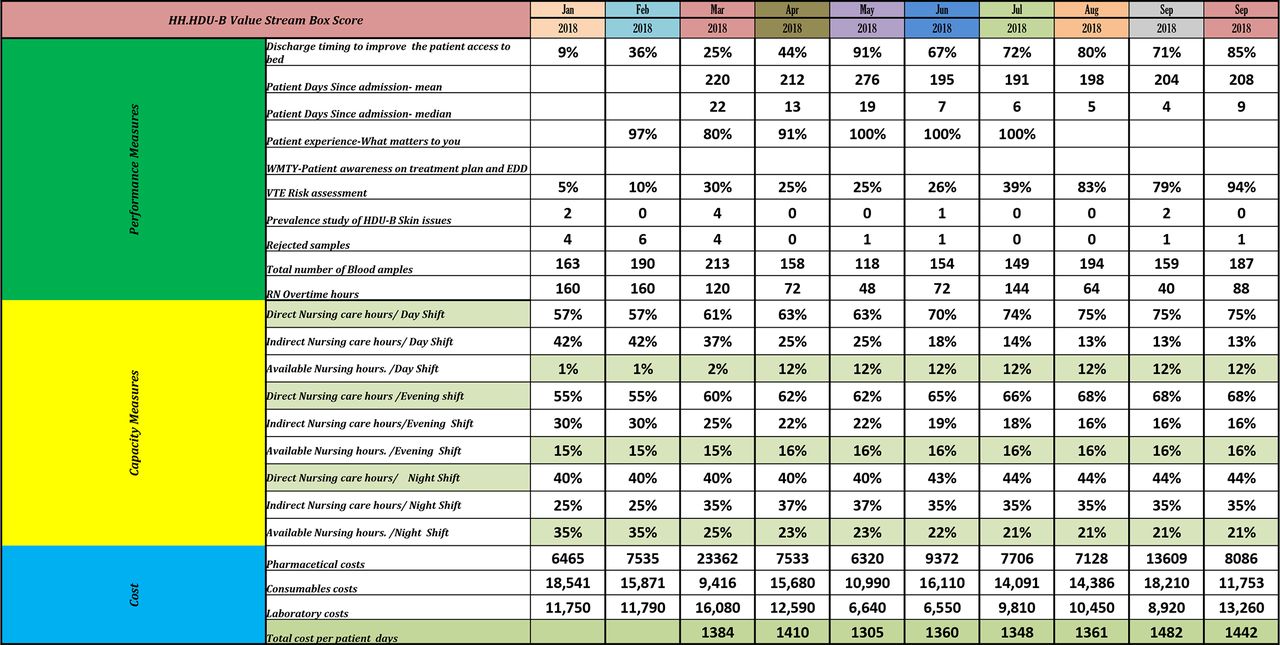
Box score from HDU B. HDU B, high-dependency unit B; VTE, venous thromboembolism: WMTY, what matters to you; EDD, expected date of discharge. * Cost data is representative.
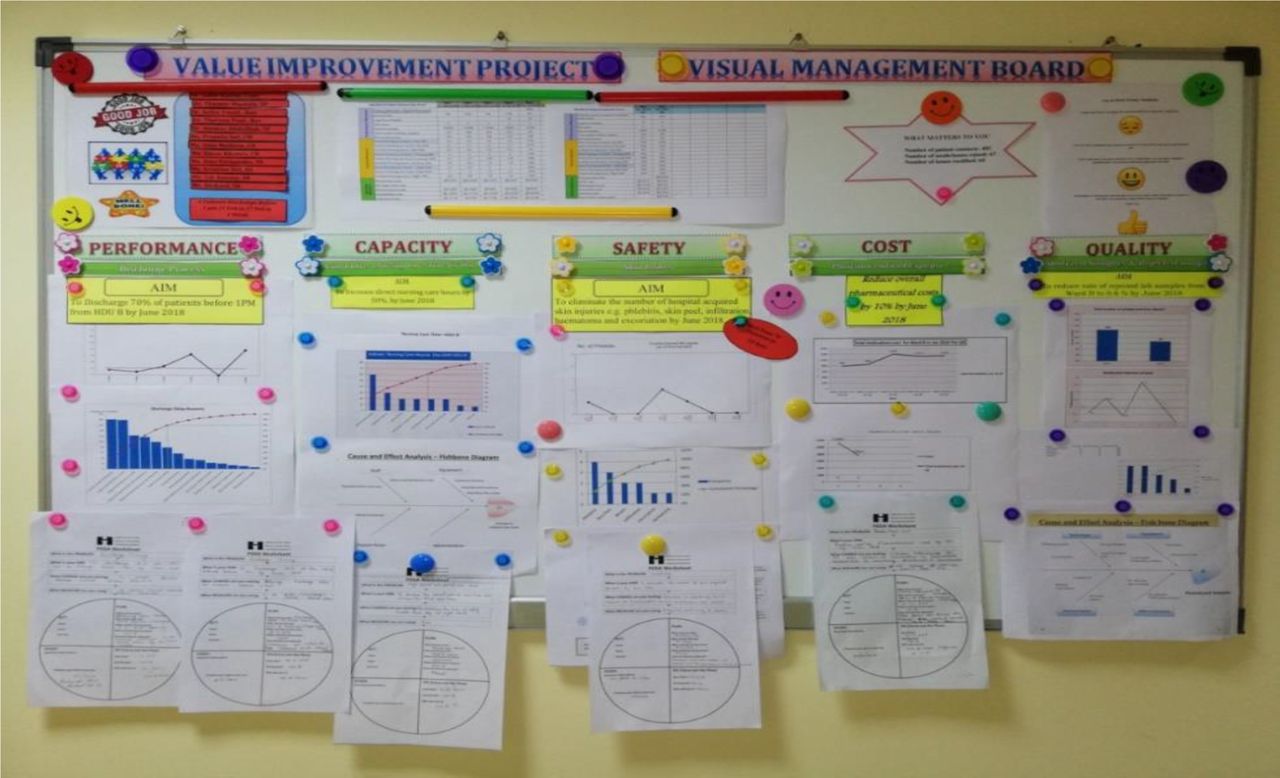
Visual management board HDU B. HDU B, high-dependency unit B.
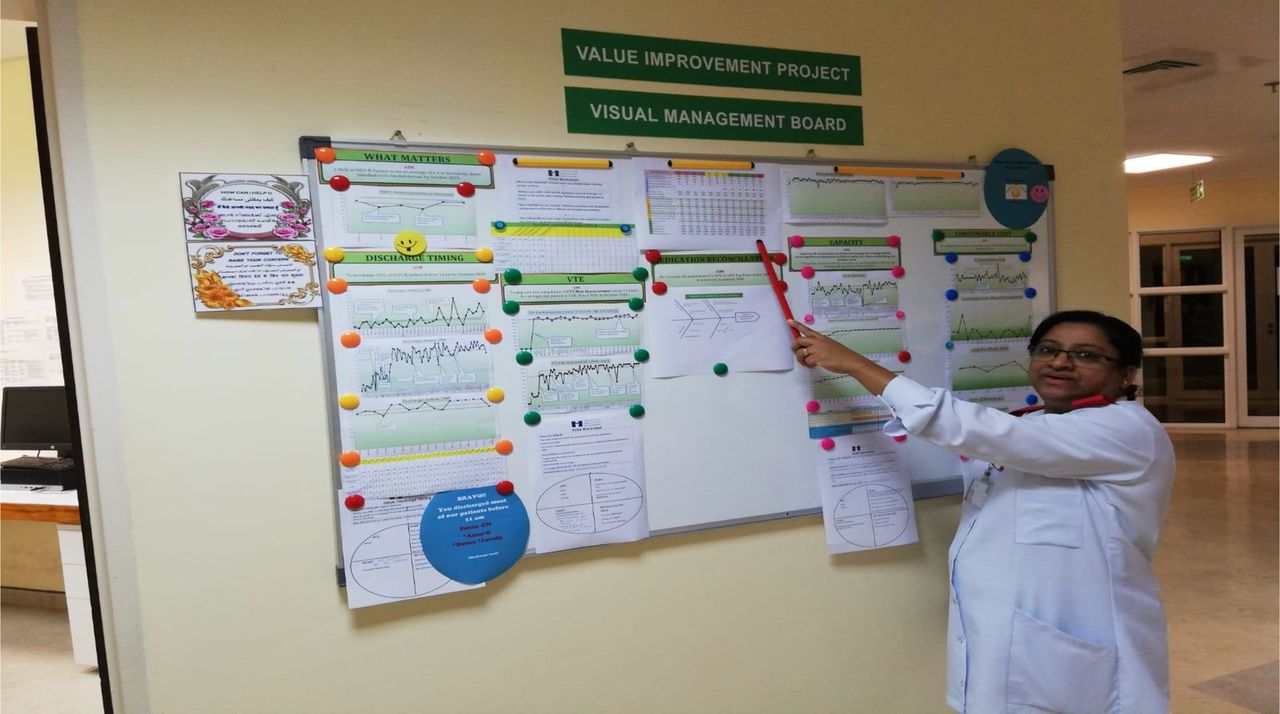
Weekly Huddle at HDU B. HDU B, high-dependency unit B.
An improvement methodology. We use the Associates in Process Improvement’s MFI for our work.8
The box score
As noted, the box score (figure 1) is a table, which is updated on a weekly basis that brings together a complimentary set of performance, capacity, and finance measures on one page. The box score typically features five or six performance measures (which include process, outcome, and balancing measures), at least one capacity measure (which describe effective utilisation of resources, such as at nursing time spent in direct patient care), and several measures of variable costs, such as laboratory costs, consumables, drugs, regular nursing pay and overtime costs. One of the variable cost measures that should be included is total cost per patient-day, so that the team can keep an eye on total expenditure. Teams select measures that link with organisational strategic priorities.
Front-line multidisciplinary teams prioritise and select the measures. They use process mapping to identify the dominant processes in the unit and potential gaps in those processes. The team then prioritises a small set of 5–7 measures for use in the box score. This process was followed for our pilot unit, high-dependency unit B (HDU-B), and resulted in the measures in table 1 being selected for the initial box score. In addition, staff satisfaction was surveyed daily as a balancing measure known as ‘Joy in Work’.
Visual management board
Another key part of this initiative is the visual management board, which is a display board (figure 2) that shows the box score and details about the strategically prioritised performance improvement projects. For each project, quality improvement tools used like cause-and-effect diagram, graphical display of a pareto analysis, documentation of recent PDSA cycles (table 2), and a run chart to display data over time.
Changes tested
Weekly communication approach
Weekly huddles (figure 3) take place in front of the visual management board in the unit. Every week, the VI team lead initiates the huddle by reviewing the box score. Project team leads then explain last week’s activities and next week’s plans for each project. The huddle is an effective means of bringing everyone to the same level of understanding about the work and serves to identify gaps or barriers and solicit support in the removal of those barriers.
Improvement methodology
This work revolves around weekly rapid cycle testing and reporting on what has been learnt, which makes it unique and different from conventional quality improvement methodologies, which usually report data monthly. Multiple tests of change are quickly carried out and adopted, adapted or abandoned.
Initial improvement projects
After the metrics were defined and the data started flowing, initial focus areas were selected for improvement efforts, based on analysis of the data and drivers of variation. To focus energies, we did not start an improvement project for every measure, rather we selected about five ‘most pressing’ areas on which to work.
It is important to note that the initial improvement projects proceeded concurrently. As any individual project met its aims and proved to be stable in the short term, it was replaced with a new project. A sustainability plan was developed for the successful project and it continued to be monitored, but active work requiring the improvement team ceased. For example, once the initial discharge timing goal was met and sustained, a new aim statement was developed to discharge 20% of patients before 11:00 hour.
Interventions
For each project, multiple change ideas were tested using PDSA cycles. Many were adopted, though some were adapted or abandoned. Table 2 summarises the changes tested in the initial projects.
Analysis
The analysis of the results of individual improvement projects was accomplished using Run Charts and Shewhart Statistical Process Control Charts.12 13 The charts were generated using QI macros in excel version 2016. Control charts selection is explained in online supplemental appendix 1.
Supplemental material
We evaluated VI methodology and its impact on our learning by conducting focus group surveys and skill assessments (online supplemental appendix 2). This presurvey and postsurvey was developed as a self-assessment of the level of knowledge about VI skills, methods and tools.
Results
The best way to evaluate the outcomes achieved from applying the VI methodology is to examine the results of the individual QI projects that were launched under its umbrella.
Baseline data periods for each project were variable, but generally data was collected for 4–6 weeks prior to testing interventions designed to achieve improvements. The duration of the period was long enough to ensure that the baseline of the Run Chart was stable. The improvements were typically seen within 1–4 months of the beginning of the project. While comparisons of patient population severity of illness were not formally made, there was no qualitative difference in the patients between the baseline and intervention periods.
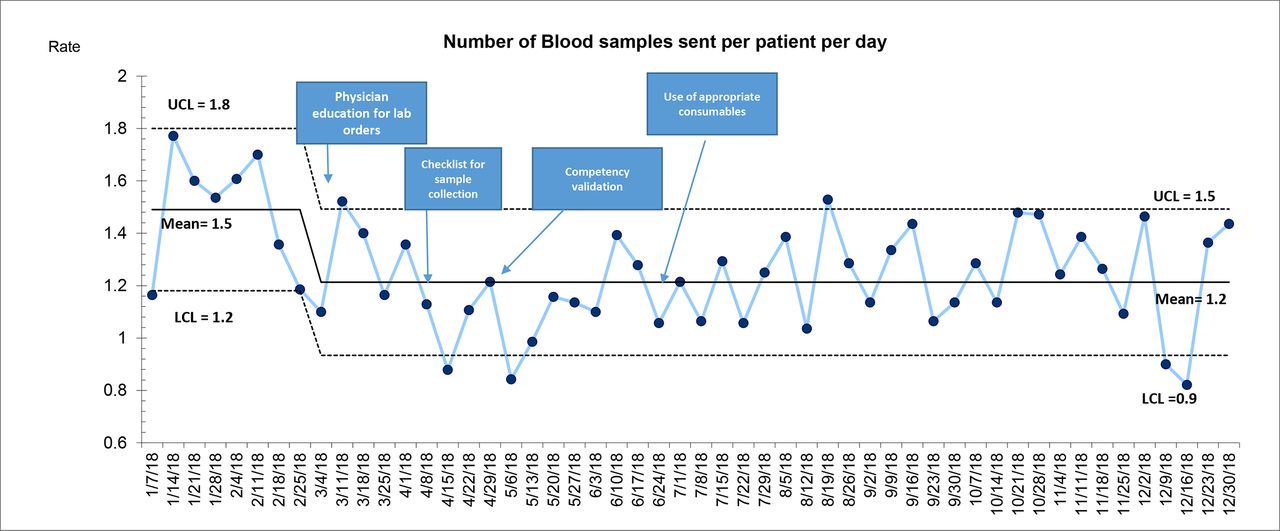
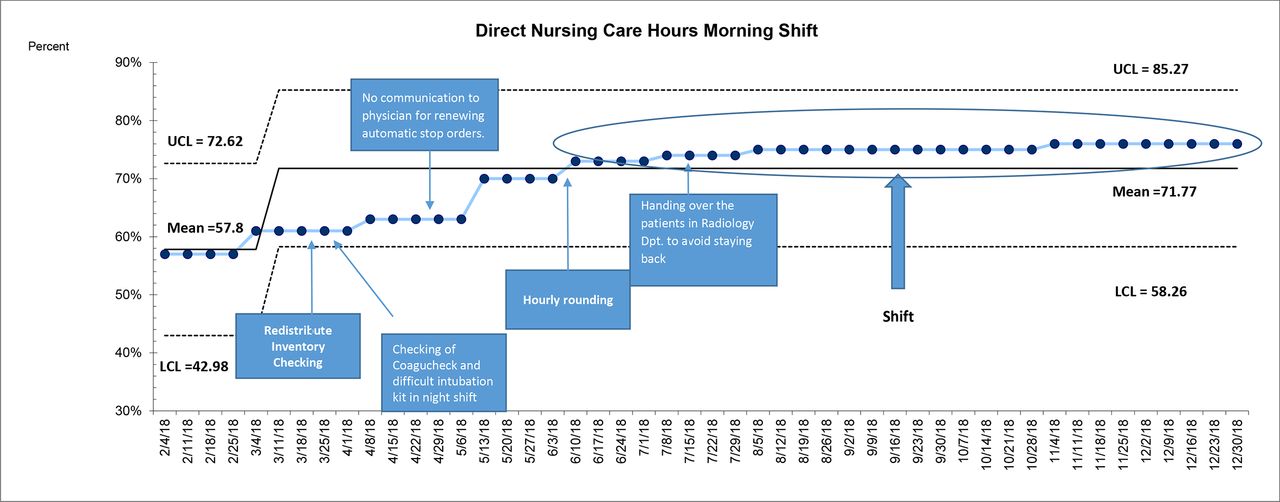
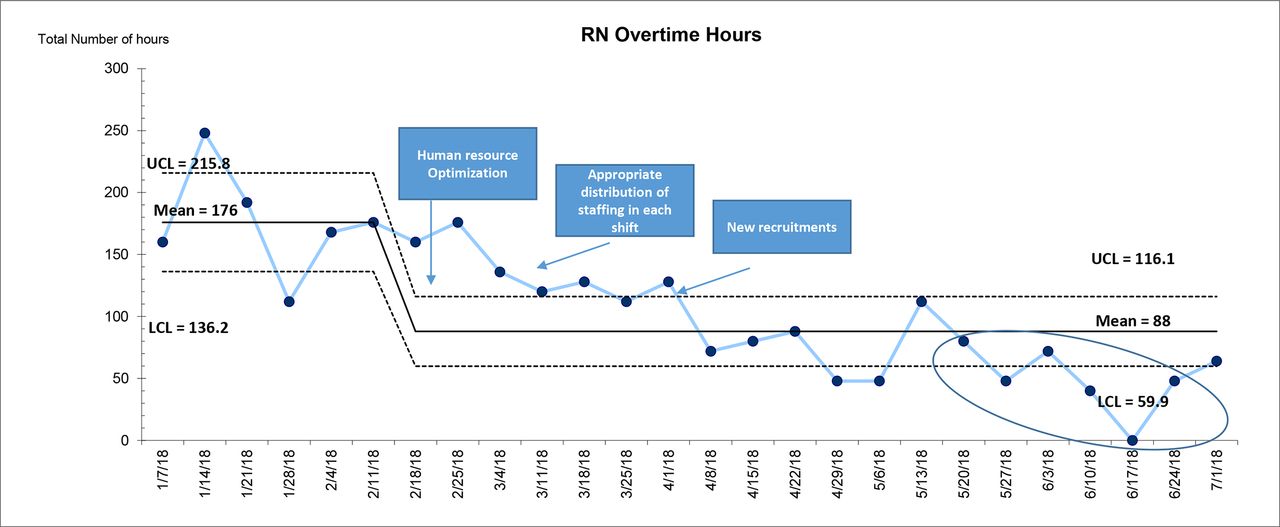
The HDU-B team achieved the aims set for most of the original projects. Discharges before 13:00 hour reached 70% (figure 4), from a baseline of 9%, which was our goal . Skin issues, including pressure injuries, phlebitis, skin peels, and skin tears, (figure 5) were reduced by 68%. Seventeen consecutives weeks free of any skin issues was achieved. There was a 20% reduction in the number of blood samples sent per patient per day from the unit (figure 6). Direct nursing care hours during morning shift increased from 57% to 75% (figure 7). RN overtime hours were reduced by 50% (figure 8). Consumables and pharmaceutical cost only showed small reductions but importantly total cost per patient-day remained steady throughout the year, indicating that the quality improvements that were realised did not come at the price of increased costs.

Run chart showing percentage of patients discharged before 13:00 hour.
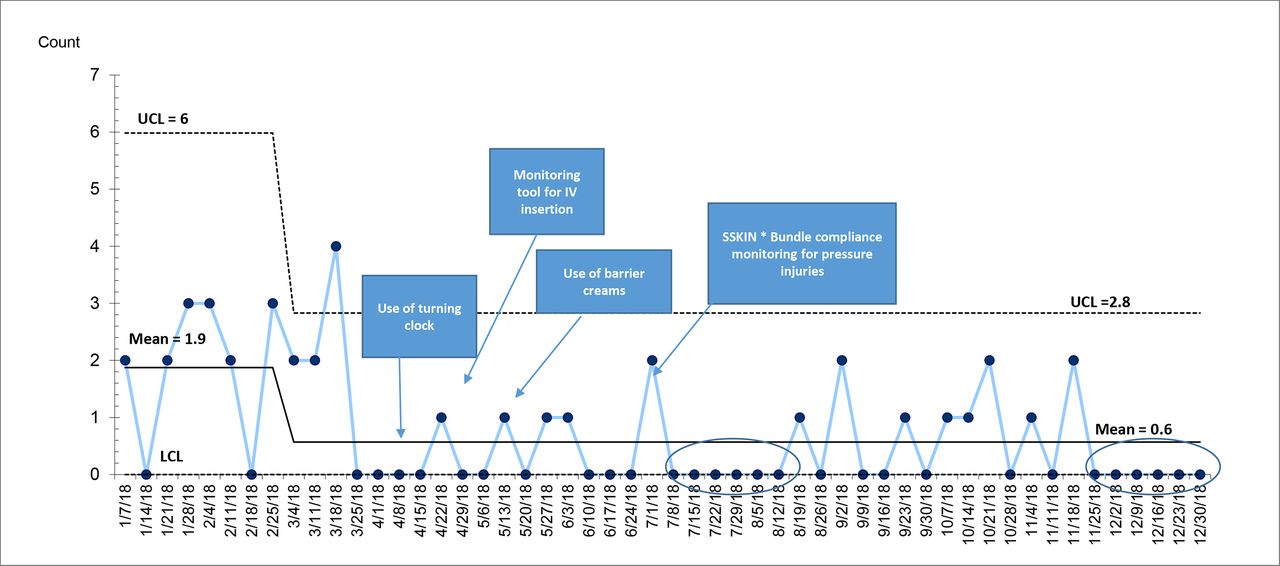
C chart showing number of skin issues. SSKIN, surface, skin inspection, keep moving, incontinence, nutrition. UCL, upper control limit; LCL, lower control limit.

U chart showing number of blood samples per patient per day.UCL, upper control limit; LCL, lower control limit.

P chart showing direct nursing care hours on morning shift.UCL, upper control limit; LCL, lower control limit.

C chart showing RN overtime hours.UCL, upper control limit; LCL, lower control limit.
Our primary balancing measure was an indicator of staff satisfaction, also known as Joy in Work. Every shift the offgoing staffs were asked to place a check mark under ‘good shift’, ‘neutral’ or ‘bad shift’. Baseline results were good with 60% claiming a good shift. Over a fairly short period, the results reached and maintained at 100%.
Discussion
Regarding specific projects undertaken in HDU-B, team achieved their aims within specific time. From our experience during this initiative, we have drawn some conclusions about our barriers, learnings, and successes about programme. The following are the key points that should be considered by other organisations testing and implementing similar methodology to improve value.
Due to rapid pace of work, there is a tendency to rush through the preparatory steps. We found that a deep dive into the specific data (including concrete operational definitions), process mapping, and cause and effect analysis is necessary before testing any changes to achieve maximum results and ensure sustainability with this approach.
Strong leadership who are skilled in QI, open to learning the VI methodology, and willing to empower staff at all levels in the organisation from the unit level to the hospital level is important, but it is also critically important to have a strong leader on your pilot unit.
Having a dedicated team on the pilot unit that has quality improvement experience and an understanding of quality improvement methods and tools are essential. However, there will still be need for much just in time education in QI tools and methods as the projects evolve.
Build will with physicians to get them involved in this work early by aligning to their objectives and specific areas of interest. To facilitate their involvement, carefully consider their availability and provide basic QI training.
There are several lessons learnt from piloting and implementing VI. The first and most important one is that it is possible to achieve the desired result of improving quality while maintaining or reducing costs. We not only achieved these results but sustained the gains and are now in the phase of spreading the approach to other units. Rapid cycle testing and data analysis are of great importance in achieving improvement.
Next, we learnt that empowering front-line staff with quality improvement capabilities and involving them in developing the measures, showing them data that was previously unknown to them (capacity and financial), and allowing them to use the data can bring improvement at a much faster and sustainable pace.
We also learnt that leadership involvement is key to success.14 Middle managers and executives both should be involved in removing barriers for the improvement teams. Leadership support in the form of removing barriers, ensure protected time and providing data helped in facilitating this work. In addition, their visibility at the weekly huddles had an enormous impact on staff engagement. Staff became more vocal about issues related to patient and staff safety. They agreed that they now feel more empowered with respect to their processes and are more able to bring about positive changes in patient experience, because they have ownership of their data and have explicit permission from leadership to act on it.
The use of a visual management board in the unit has had a positive impact on the front-line staff understanding of quality work. They can easily see their data and the quality tools that are used to analyse it (cause and effect diagrams, the box score, PDSA worksheets, Pareto charts and run charts).
In addition, it is vital to have a regular communication plan. Our weekly huddles15 16 served this purpose. It is also a great opportunity for front-line staff to bring their concerns to leadership’s attention and seek their support.
We faced some challenges during this initiative. A major challenge was maintaining the pace of rapid PDSA cycles, data collection, and analysis (weekly). Even though we experienced many early wins, achieving sustainability of the gains is the greatest challenge. We overcame these challenges by several means.
Coaches and leaders expressed appreciation for staff participation and performance via emails, sharing data, and celebrating success, which helped maintain the enthusiasm. Regular education and training activities for team members found to be effective. Tests of change to the processes of care occur frequently, which reduces the interval between successful tests, helping to sustain momentum. Contrary to our prediction that weekly work would make our staff feel overloaded and dissatisfied, it proved to be motivating and helped in engaging physicians.
Since beginning this work, we believe we have witnessed culture change. This is possibly the most important outcome of the work. Nurses, especially at the front-line feel empowered and are far more comfortable to voice concerns. Physicians have embraced the multidisciplinary team concept and senior leaders have become more visible and approachable. The VI approach has not only reduced harm, but it has also empowered teams and developed staff capacity for further improvement work. The preskills and postskills assessment survey rose from a baseline median of 36%–60%.
In a short period of time (3 years), the work has spread across 12 more units. In addition to the unit discussed in this paper, the work has spread to the Cardiac Intensive Care Unit, Noninvasive Cardiology Diagnostic Unit, HDU A, HDU C, HDU D, Cardiothoracic Surgical Intensive Care Unit, Operation Theatre, Heart Failure Unit, Outpatient Department, Cardiac Rehabilitation, Facility Management Services and Health Information Management Department. Over this time, we have initiated more than 50 improvement projects in these units. Results are promising, so we plan to spread VI to all patient care areas of the facility as well as to selected non-patient care areas. Eventually spread is planned to the rest of the Hamad Medical Corporation.
Limitations
Although VI has proved to be a success in our units; there are several limitations. Financial measures can be very tricky, especially to generate weekly. Though they are part of total costs, fixed costs are not being measured, only variable costs. Thus far, capacity measures have involved nursing professionals only, not other disciplines. Improvements directed at uncommon issues do not lend themselves to this method as it is impossible to see improvement over the week-to-week time scale. Similarly, not all types of changes can be tested with this method, even though they may ultimately be very effective. Interventions requiring very long preparation time or those whose results are not discernable over the short term do not fit well with this method.
Conclusions
Launched as a collaboration between IHI, the HHQI and the HH, VI provided front-line teams with a powerful and evidence-based set of tools to identify and improve quality concerns in their unit, manage costs by reducing waste and increasing efficiency, and better use staff capacity. Ongoing quality initiatives are being brought under the umbrella of VI and we are seeing faster improvement. We now have a full scale spread and sustainability programme in place for the Corporation, which demonstrates leadership commitment and front-line engagement in this work and will be presented in upcoming publications.
As evidenced in this paper, VI at HH has been a success. It has evolved from a project in a pilot unit to, quite simply, as one leader put it: ‘the way quality is done here!’
Data availability statement
All data relevant to the study are included in the article or uploaded as supplementary information.
Acknowledgments
We acknowledge Heart Hospital and Hamad Healthcare Quality Institute (HHQI) leadership including Dr. Nidal Asaad (Medical Director), Dr Awad Al Qahtani (Chairman Cardiology), Mr. Nasser Al Naimi (Deputy Chief Quality) and Dr. Salah Arafa (Director Quality Improvement) for their continuous support to this program. We would like to thank Dr. Ron Wyatt, Ms. Minara Chaudhary, and Mr. Nasser Al Naimi (HHQI) for providing us the opportunity to pilot this initiative. Our thanks go to HHQI faculty and Ms. Maryanne Gills (IHI) for their valuable support to this program. Our special thanks to Dr. Robert C. Lloyd, Vice President, Senior Improvement Advisor IHI for his expert guidance on statistical analysis part. Also, we thank Dr. Sabir Husain (Consultant Cardiology), Dr. Ammar Kannan (Consultant Cardiology), Mr. Firoz (Stores), Mr. Mahmoud (Pharmacy), Occupational therapy and physiotherapy team, Ms. Gilrose, and Ms. Nevine (Laboratory) and all the team members of HDU B including the physicians, nurses and allied health professionals for their valuable support to this work.
References
Supplementary materials
Supplementary Data
This web only file has been produced by the BMJ Publishing Group from an electronic file supplied by the author(s) and has not been edited for content.
Footnotes
Contributors All authors contributed significantly to be listed as authors.
Funding The overall quality improvement effort was entirely funded by the HHQI which is a part of Hamad Medical Corporation, our parent organisation.
Disclaimer IRB review was not sought as all the changes being tested were evidence based.
Competing interests None declared.
Provenance and peer review Not commissioned; externally peer reviewed.
Supplemental material This content has been supplied by the author(s). It has not been vetted by BMJ Publishing Group Limited (BMJ) and may not have been peer-reviewed. Any opinions or recommendations discussed are solely those of the author(s) and are not endorsed by BMJ. BMJ disclaims all liability and responsibility arising from any reliance placed on the content. Where the content includes any translated material, BMJ does not warrant the accuracy and reliability of the translations (including but not limited to local regulations, clinical guidelines, terminology, drug names and drug dosages), and is not responsible for any error and/or omissions arising from translation and adaptation or otherwise.