Article Text

Abstract
Background Risk-adjusted rates of hospital readmission are a common indicator of hospital performance. There are concerns that current risk-adjustment methods do not account for the many factors outside the hospital setting that can affect readmission rates. Not accounting for these external factors could result in hospitals being unfairly penalized when they discharge patients to communities that are less able to support care transitions and disease management. While incorporating adjustments for the myriad of social and economic factors outside of the hospital setting could improve the accuracy of readmission rates as a performance measure, doing so has limited feasibility due to the number of potential variables and the paucity of data to measure them. This paper assesses a practical approach to addressing this problem: using mixed-effect regression models to estimate case-mix adjusted risk of readmission by community of patients’ residence (community risk of readmission) as a complementary performance indicator to hospital readmission rates.
Methods Using hospital discharge data and mixed-effect regression models with a random intercept for community, we assess if case-mix adjusted community risk of readmission can be useful as a quality indicator for community-based care. Our outcome of interest was an unplanned repeat hospitalisation. Our primary exposure was community of residence.
Results Community of residence is associated with case-mix adjusted risk of unplanned repeat hospitalisation. Community risk of readmission can be estimated and mapped as indicators of the ability of communities to support both care transitions and long-term disease management.
Conclusion Contextualising readmission rates through a community lens has the potential to help hospitals and policymakers improve discharge planning, reduce penalties to hospitals, and most importantly, provide higher quality care to the people that they serve.
- health services research
- pay for performance
- performance measures
- quality improvement
- health policy
Data availability statement
Data may be obtained from a third party and are not publicly available. The data used in this report were made available by Health Data Nova Scotia (HDNS). Although this research is based on data obtained from the Nova Scotia Department of Health and Wellness, the observations and opinions expressed are those of the authors and do not represent those of either Health Data Nova Scotia or the Department of Health and Wellness. Access to the data may be obtained by researchers working in Nova Scotia through HDNS. The application process can be found here: https://medicine.dal.ca/departments/department-sites/community-health/research/hdns/services/data-access-guidelines.html.
This is an open access article distributed in accordance with the Creative Commons Attribution Non Commercial (CC BY-NC 4.0) license, which permits others to distribute, remix, adapt, build upon this work non-commercially, and license their derivative works on different terms, provided the original work is properly cited, appropriate credit is given, any changes made indicated, and the use is non-commercial. See: http://creativecommons.org/licenses/by-nc/4.0/.
Statistics from Altmetric.com
Background
Around the world, risk-adjusted rates of hospital readmissions are a common indicator of hospital performance and quality of care.1–4 Many governments (eg, Denmark and Canada) routinely monitor hospital readmissions, with the Canadian Institute of Health Information (CIHI) describing them as common, costly and often potentially avoidable.5–7 Other countries like Germany, England and the USA have taken more concrete steps towards reducing hospital readmission rates by introducing readmission reduction programmes that incorporate financial penalties for hospitals that do not meet established thresholds.8
There are concerns that the risk adjustments used in the models informing these readmission reduction programmes do not account for factors outside of the hospital setting which can affect readmission rates.9 10 Researchers have found that factors such as poverty,11 12 social isolation,13 transportation access14 and access to primary care15 are associated with readmission rates, even after adjustment for diagnostic, procedural and demographic factors.16–18 There is also evidence that investing in community-based services and resources can reduce hospital readmissions among local populations.19–22 Readmissions can be affected by a range of interacting elements outside the hospital setting,23 and placing the entire burden of minimising readmissions on hospitals alone may unfairly penalise hospitals discharging patients to communities with less capacity to address these elements.
While adjustment for the myriad of social and economic factors outside of the hospital setting could improve the accuracy of readmission rates as a measure of hospital performance, doing so has limited feasibility. Data on these factors are often not routinely collected, the number of potential variables is large, and the collection and measurement of many important and interacting variables would be complex. Refining risk-adjustment models to include factors outside of the hospital setting is a laudable goal, however, significant gaps will remain, and concerns about fairness and bias will persist.
Rather than trying to capture and adjust for every potential variable and interaction between factors outside the hospital system that could affect hospital readmission rates, a more practical strategy is to produce risk-adjusted performance indicators of readmissions for communities themselves. By employing similar modelling approaches as those used to estimate hospital readmission rates, the risk of readmission associated with being discharged to a particular community (community risk of readmission) could also be estimated. Estimates of community risk of readmission would incorporate many of the downstream factors that may affect the risk of readmission, as well as the complex interactions between them. These estimates could then be used in conjunction with traditional hospital performance measures to identify poorly performing communities. While this would not solve the problem of underadjustment of risk for hospital performance indicators, it would serve as another lens through which a hospital’s readmission rates could be contextualised.
To date, measuring readmission rates for communities as a performance measure has been undertaken in relatively large populations. The National Health Service (NHS) in the UK, for example, reports indirectly standardised rates of emergency readmission for geographically defined Clinical Commissioning Groups (CCGs).24 CCGs cover populations ranging from 96 564 to 1 860 111 individuals, and many encompass multiple cities.25 Thus, reported rates may obscure considerable geographical heterogeneity in risk. Moreover, the methods used to generate the NHS estimates are not appropriate for estimating rates in areas with smaller numbers of people. The use of indirect standardisation limits the number of factors that can be incorporated into case-mix adjustment, and particularly if applied to smaller populations, inadequately differentiates real variation from variation due to chance.26 27 The use of mixed-effect regression models for case-mix adjustment, with empirical Bayes estimation of adjusted rates, addresses these limitations and has thus become the standard for small area estimation and hospital performance measurement.27–29
Furthermore, the NHS reporting focuses specifically on readmission within 30 days. We argue that while the initial transition in care from hospital to community settings is integral to high-quality care,30–32 it is just the first step in longer term management. Once patients leave the hospital, it falls to community-based health and wellness services, informal supports and patient self-management to facilitate care that can impact readmission rates. As a performance indicator, community risk of readmission can extend beyond a 30-day window from discharge, expanding the focus from transition of care efforts to include broader disease management. By understanding the risk of readmissions associated with communities, as well as hospitals, integrated hospital and community quality improvement plans can be developed and implemented where they are most needed.
Objectives
As a first step in developing a measure of community risk of readmission, this study had two objectives. The first was to assess the magnitude of community variation in case-mix adjusted rates of readmission for adults aged 30 years of age and older between 2010 and 2014 in the province of Nova Scotia, Canada. The second was to assess if differences in estimated risk-adjusted readmission rates for specific communities were of sufficient size and precision to be useful as a quality indicator for community-based care after discharge from hospital.
Methods
Study design, data and setting
This was a population-based, descriptive study of community variation in the case-mix adjusted risk of an unplanned readmission to hospital following discharge to a community setting (ie, not to a long-term care or assisted living facility, other non‐acute care institutions or a psychiatric hospital). To account for exposure time and right censoring, the risk of unplanned hospital readmissions was modelled using time-to-event regression models, with risk-adjustment variables as fixed effects and a random-intercept for community of residence. This was followed by empirical Bayes estimation and mapping of case-mix adjusted risk of readmission for specific communities. The study population included all persons in the province of Nova Scotia, Canada aged 30 years and older with an eligible discharge from hospital between 2010 and 2014. We included only the first eligible discharge for each person in the analysis. The average population of Nova Scotia from 2010 to 2014 was approximately 937 000 people, and it is served by a regionally organised network of 43 local, regional and tertiary hospitals of varying size and capacity.
Our data, accessed through Health Data Nova Scotia, was drawn from provincial health registry eligibility files linked with the CIHI Discharge Abstract Database (DAD). The DAD data include all discharges from all acute care institutions that provide care to the study population. The DAD data are coded by certified health records technicians using hospital charts and electronic data entry systems according to validated, standardised protocols established by CIHI.33
Variables
Our outcome of interest was hospital readmission, operationalised as an unplanned repeat hospitalisation (URH) after an index discharge from hospital, and our primary exposure was community of residence. Exposure time was measured as the number of days someone spent in a community between index discharge and URH or censoring. We defined URH as any hospitalisation occurring after a valid index hospitalisation (see online supplemental appendix 1) that was coded as ‘urgent’ or ‘emergent’ in the ‘Admit Type’ field of the data. This excludes planned hospitalisations, such as hip or knee replacements that result from joint deterioration. Index cases were observed until a URH, loss to follow-up due to death or the end of the study period.
Supplemental material
Community was defined as forward sortation area (FSA), identified by the first three letters of Canadian postal codes. In Nova Scotia, FSAs vary greatly in size and population, but generally delineate areas that are suitably small to avoid excessive aggregation, while ensuring sufficient sample size for community-level estimation. FSAs also provide a reasonable approximation to meaningful communities and neighbourhoods without reliance of geocoding postal codes to other geographical entities, such as census geography, which has been shown to result in considerable allocation error.34
To adjust for community variation in patient case-mix, models included fixed effects for age-sex groups, Elixhauser comorbidity index score, percentage of time spent in the community during the last year of life, indicator variables for 25 different individual health conditions (see online supplemental appendix 2) and total number of health conditions. Persons in their last year of life are at increased risk of unplanned hospitalisations,35 and thus proximity to death was accounted for in our model. To do so, we calculated the percentage of each person’s exposure interval which fell within 365 days of their date of death and included that number in the regression model. Age was measured in 5-year age groups with a single group for people aged 30–54 years and another for everyone 85 years old and over. Multimorbidity was measured using both a simple count of health conditions as well as the Elixhauser comorbidity index score. The Elixhauser score has been shown to work well as a predictor of rehospitalisation and mortality for people with chronic conditions,36 37 while a simple disease count has been shown to be among the best comorbidity measures in predicting hospitalisation.38
Supplemental material
Analytical approach
We defined community risk of readmission as the expected time to a URH for a given community. We estimated community variation in the case-mix adjusted time to URH using a mixed-effect accelerated failure time (AFT) regression model with case-mix adjustment variables as fixed effects and a random intercept for community. We chose to use an AFT model, rather than the more commonly used Cox-proportional hazards model for two reasons. First, the AFT model expresses community effects as the relative expected time to a URH, which is more intuitive to policymakers and the public than relative risks. Second, the AFT model estimates effects on the failure distribution rather than the hazard rate, and is more robust to violations of model assumptions, such as proportionality of hazards, than the Cox hazards model.39 In the AFT model, the estimated effects of covariates are termed ‘acceleration factors’.40 An acceleration factor of greater than one means that the expected time to a URH for that community is longer than the provincial average (lower community risk of readmission), while an acceleration factor of less than one means that the expected time to a URH for that community is shorter than the provincial average (higher community risk of readmission).
To identify specific communities that stood out as having higher or lower time to URH, case-mix adjusted intercepts for each community, along with 95% confidence intervals (CIs), were estimated. As is common practice in small area estimation empirical Bayes estimators, estimated best linear unbiased predictors were used.41 We exponentiated the estimated community intercepts and confidence bounds to obtain community-level estimates of the acceleration factors for each community relative to the average community (ie, a community with a random intercept of zero). Community estimates were then mapped using ArcGIS software to reveal spatial patterns.
After the initial modelling was complete, additional analyses were conducted to assess the sensitivity of results to which health conditions were included in the case-mix adjustment and to the length of follow-up. The first sensitivity analysis excluded index hospitalisations that had one of the four conditions with the highest influence on time to a URH in the primary analytical model: cancer, stroke, injury or diabetes. The second sensitivity analysis assessed the impact of length of follow-up by using only the last 3 years of our data.
Patient and public involvement
This project was developed through a working partnership between researchers, managers, patients and policymakers: the Maritime SPOR SUPPORT Unit (http://www.spor-maritime-srap.ca/). The study objectives were motivated by two 1-hour teleconferences with hospital staff from across the province who are directly involved in discharging patients and supporting transitions to home. Three principal topics were discussed: community factors that make repeat hospitalisation more likely, community factors that impact discharge planning and the coordination of care between hospital and community settings, and relevant community factors that vary from one setting to the next. There was broad consensus that discharging patients to some communities was much harder than others because of the interplay of differences in both formal and informal supports, remoteness, and socioeconomic and demographic characteristics.
In order to ensure that the results of this study were accessible to as many stakeholders as possible, we have shared our results with diverse academic and policy audiences. Results have been incorporated by health authorities into community profiles to support primary care planning.
Results
Our study population consisted of 65 803 people and is described in table 1. To place this in context, the average population of Nova Scotia from 2010 to 2014 was approximately 937 000 people.
Characteristics of the study population as captured at the time of discharge from index hospitalisation (N=65803)
Our study population was discharged to 77 different communities which varied widely in size and sociodemographic characteristics. Community populations range from 41 to 40 415 people (mean ≈12 000, 90% over 1200). The smallest community is 0.94 km2 and the largest is 6145 km2. The percentage of people experiencing low income varies from 14% to 47% (mean ≈33%), and the percentage of the population with below a grade 12 education ranges from 4.3% to 61.9% (mean ≈24%).
Community of residence was significantly associated with risk-adjusted time until a URH (p<0.0001). Because of the large size of our sample however, it is also important to examine the magnitude of variation. The estimated risk-adjusted standard deviation (SD) in acceleration factors between communities was 1.16 (95% CI 1.12 to 1.21). This suggests that the expected time until a URH is 16% longer, compared with the average community, for a lower risk community which is one SD from the mean. In both of our sensitivity analyses, the statistical significance and magnitude of effect for community of residence remained consistent.
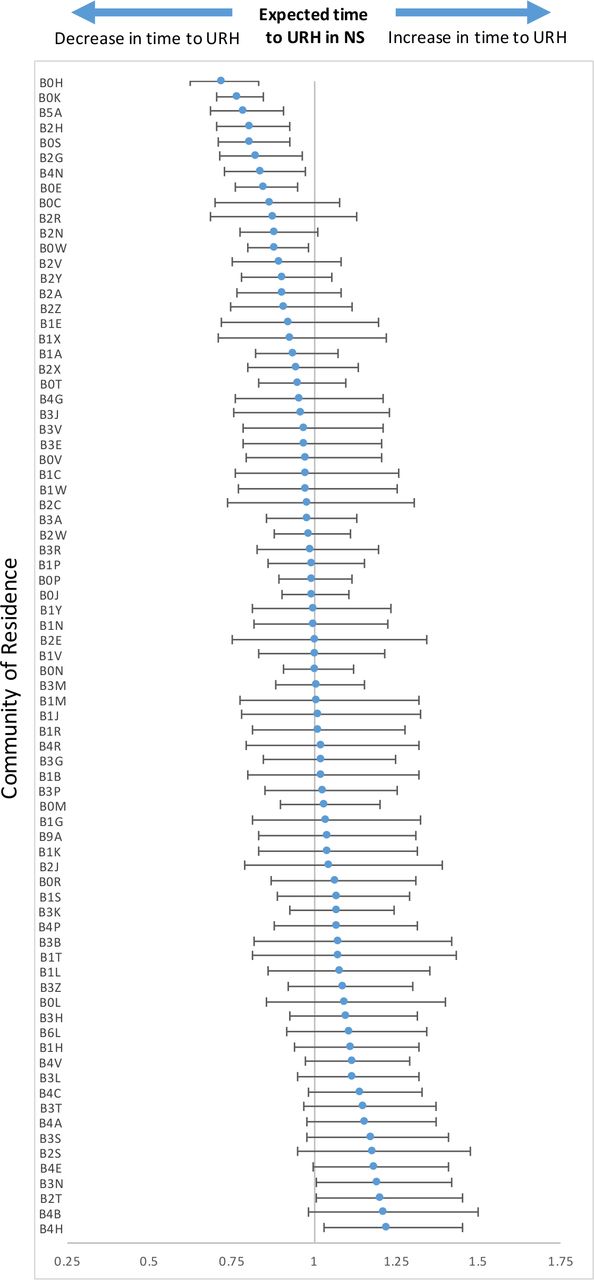
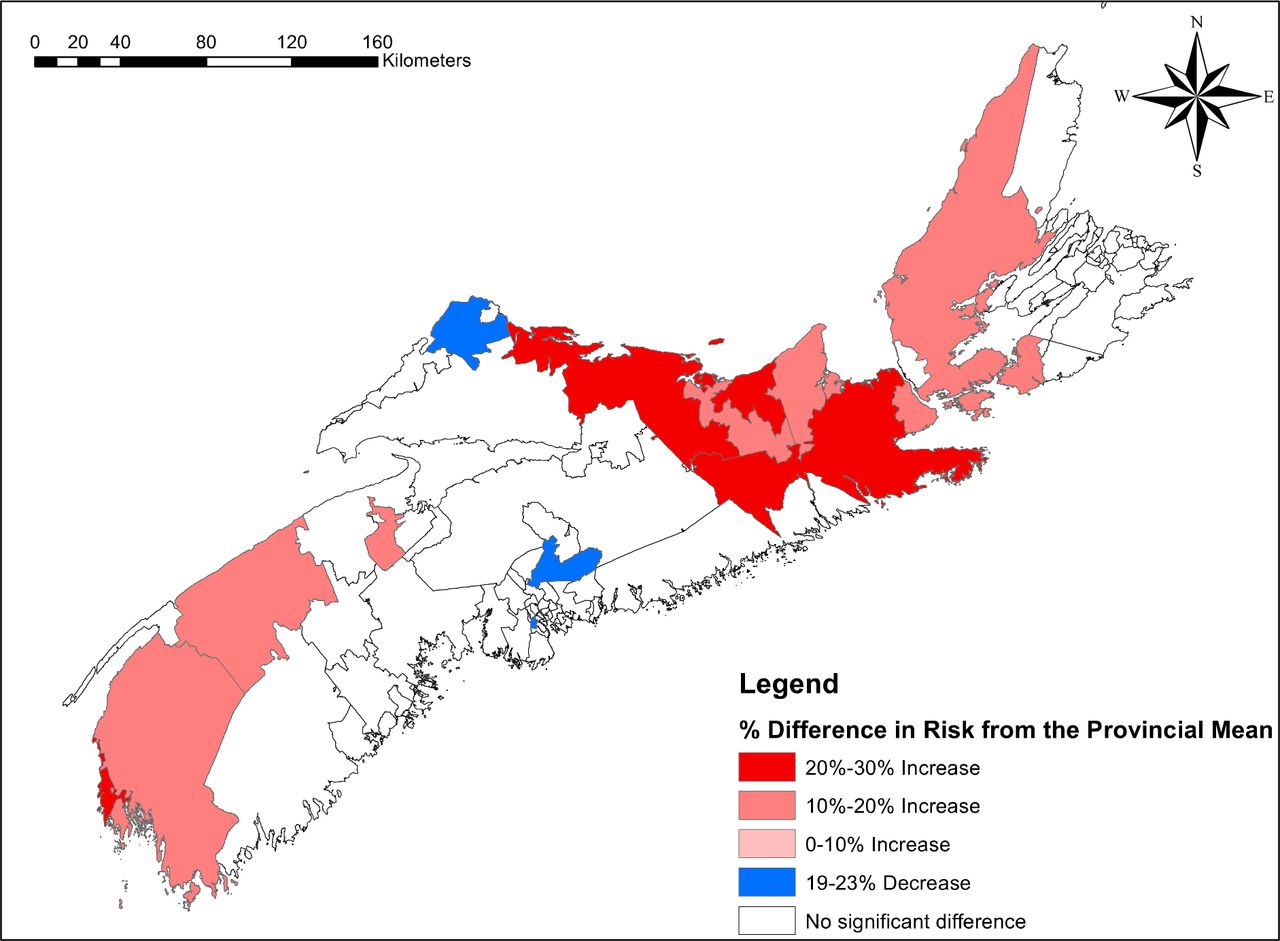
Empirical Bayes estimates of effects for individual communities identified those with significantly higher or lower case-mix adjusted time to a URH, relative to the average community (figure 1). Of the 77 FSAs included in the primary analytical model, 12 were shown to vary significantly from the average. Mapping of the communities (figure 2) shows that communities with acceleration factors significantly different than the average tend to be clustered together in particular regions of the province. Nine communities were associated with a significantly shorter time to a URH (acceleration factor of <1), while three communities were associated with a longer time to a URH (acceleration factor of >1). The community with the highest significant risk of experiencing a URH had an acceleration factor of 0.72 (95% CI 0.63 to 0.83). This means that expected time to a URH in that community is 28% shorter than the average community. The community with the lowest significant risk of experiencing a URH had an acceleration factor of 1.22 (95% CI 1.03 to 1.45), meaning that the expected time to a URH in that community is 22% longer than the average community.

This caterpillar plot shows the relationship of expected time to an unplanned repeat hospitalization in each FSA with 95% confidence intervals as compared to the expected time to unplanned repeat hospitalization of all FSAs in Nova Scotia (centre line).

Geographic distribution of communities with a probability of URH that differs significantly from the mean community time to URH in Nova Scotia, Canada.
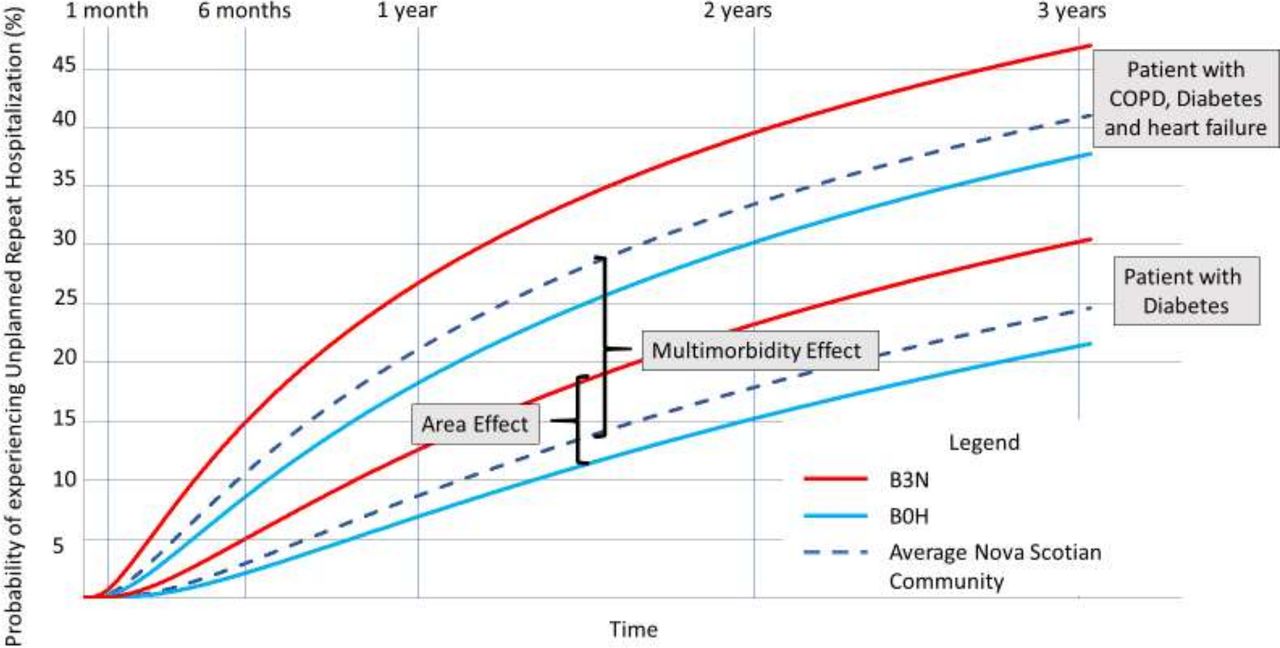
To provide a better sense of the magnitude of the effect of community on the case-mix adjusted risk of readmission, we contrasted the effect of community against the effect of multimorbidity. Figure 3 compares, for a man aged 65-69 years old, the marginal effect on mean time to a URH of living in the highest versus lowest risk community with the marginal effect of having diabetes versus having diabetes, chronic obstructive pulmonary disease and heart failure. While the marginal effect of multimorbidity is clearly larger than that of community, the community effect is nevertheless substantial, and many other combinations of health conditions would have smaller effects on time to a URH.
One patient has diabetes, COPD and heart failure, while the other has diabetes. The clusters of lines represent the variation in time to unplanned repeat hospitalisation due to community of residence, while the space between lines in different clusters represents the impact that multimorbidity has on the time until a patient experiences an unplanned repeat hospitalisation. These disease profiles represent the extremes of potential variation in effect. Different profiles would likely result in smaller effects.
Discussion
Our work has shown that, after adjustment for patient case-mix, where one lives is significantly associated with the risk of a URH. Our work has also shown that these effects can be estimated and mapped for individual communities to identify those that deviate significantly from the population average. We have demonstrated that estimates of community risk of readmission may provide a useful geographical quality indicator for community-based care following discharge, which can be used in much the same way that hospital performance measures have been used for decades.1–4 Furthermore, identifying communities with higher case-mix adjusted risk of readmission can stimulate and focus the efforts of healthcare systems to understand and address the inter-related patient, family and environmental and health system factors leading to poorer discharge outcomes.
An important consideration when estimating variation in case-mix adjusted community risk of readmission is how ‘community’ is defined. There is no ‘right’ definition of community, and we acknowledge that our results could change if we defined community boundaries differently (the so called ‘modifiable areal unit problem’).42 From an estimation standpoint, communities should be suitably small to avoid excessive aggregation of heterogeneous community differences, sufficiently large to enable suitably precise community-level estimates, and readily geocoded with available data. From a policy perspective, communities should be defined to delineate culturally and socially meaningful areas, and to facilitate planning and performance improvement. No single definition can meet all of these criteria. Based on geography designed to facilitate mail delivery, the FSAs used in this study do not necessarily delineate communities best suited for planning, however, they were the most reliable measure available. Some rural FSAs have small population sizes, which in our modelling approach, results in estimates with large CIs that are shrunk to the provincial average, thus increasing risk of type II error. This is a well-known problem in small-area estimation.
One way to address this problem would be to amalgamate small FSAs with their neighbours, thereby increasing the population size for analysis. While this could improve the precision of our results, the gains in population size would be modest while risking considerable aggregation bias. Rural FSAs encompass large geographical areas containing diverse small communities, and pooling estimates may obscure important heterogeneity between communities. In larger urban centres, however, FSAs tend to have larger populations and correspond well with meaningful neighbourhoods. FSAs have the advantage of accurate geocoding in our data sources, and nearly all have sufficient sample sizes. Moreover, mapping estimates reveals a mosaic of larger geographical patterns, enabling insights across different levels of geography. Ultimately, a small percent of communities, containing a very small percent of the population, are affected by small sample size.
We employed an established modelling and estimation approach which is widely used for community-level estimation, as well as for estimating hospital performance in the US Medicare programme.29 However, some important limitations and considerations should be noted. First, the AFT model assumes that estimated effects have a constant multiplicative effect over time, which corresponds to the proportional hazards’ assumption in the more commonly used Cox hazards model. Although the AFT model is more robust to a violation of the proportionality assumption than the Cox hazards model, it is possible that some community differences in case-mix adjusted risk of a URH are not proportional and change with time since discharge. This could result, for example, from community differences in transitional care services versus disease management supports. This should be explored in future research.
Second, it is important to note that we were unable to adjust for the effect of hospital on the time to URH in each community. As such, our results do not reflect the effect of community alone. Subsequent work done by our group has shown that the effect of a given hospital varies depending on the community of discharge and vice versa. We have explored models that aim to partition community and hospital effects; however, the complex interaction between hospitals and communities means that modelling cannot readily separate the effect of community from the effect of the hospital from which a patient was discharged. This makes intuitive sense because hospitals may take on a greater role in transitional care depending on the community to which they are discharging a given patient. For example, a large tertiary hospital in Nova Scotia will treat patients from across the province, as well as acting as a local care centre for those living nearby. It is reasonable to assume that the hospitals’ discharge planning would be different depending on whether they were discharging a patient down the street, or to a small community many hours away. It is also safe to assume that discharge planning is done in such a way as to take available community resources into account. This highlights the major challenge of separating hospital from community effects—that the effect of the hospital will change, depending on the anticipated effect of the community. Put differently, we have found that community and hospital effects are not independent, and as such very complicated to separate in any sort of reliable way. Our inability to adjust for hospital effects highlights the necessity of a more nuanced study of how community factors influence people’s care after they are discharged from hospital, and we will be examining this issue in future research projects.
Finally, it is important to acknowledge that in this study, we did not adjust for socioeconomic status (SES) variables. Individual-level SES data were not available, and while ecological variables were considered for this purpose, they are likely a poor alternative since persons discharged from hospital are a select group of the population who are likely to have different SES attributes than others in their community. That being said, our methods are easily adapted to include individual-level SES data if they become available.
Conclusion
This work offers insight into the potential of the AFT model as a practical approach to addressing a key limitation of value-based funding for hospitals based on case-mix adjusted readmission rates: that many factors outside of hospitals’ control, in community settings, affect readmission rates, and thus that hospitals discharging patients to communities with less capacity to address these factors may be unfairly penalised. Estimates of community risk of readmission, used in conjunction with traditional hospital performance indicators, may help to reduce penalties for hospitals that are disproportionately affected by a lack of resources in the communities to which they are discharging their patients. That being said, this project also highlights some of the challenges with community-level adjustment—namely our inability to properly adjust for hospital effects, SES characteristics and our acceptance of the proportional hazards’ assumption. We are working to refine the model to resolve these concerns and will be addressing them directly in future research studies. Despite these limitations, the methods discussed in this paper can provide health system administrators with a measure that can be used to identify communities that are associated with a higher case-mix adjusted risk of URHs. This information can then be used to coordinate with communities, tailoring transitional care planning and coordination to better support the needs of patients being discharged from hospital. By contextualising readmission rates through a community lens, our methods have the potential to help hospitals and policymakers improve discharge planning, reduce penalties, and most importantly, provide higher quality care to the people that they serve.
Data availability statement
Data may be obtained from a third party and are not publicly available. The data used in this report were made available by Health Data Nova Scotia (HDNS). Although this research is based on data obtained from the Nova Scotia Department of Health and Wellness, the observations and opinions expressed are those of the authors and do not represent those of either Health Data Nova Scotia or the Department of Health and Wellness. Access to the data may be obtained by researchers working in Nova Scotia through HDNS. The application process can be found here: https://medicine.dal.ca/departments/department-sites/community-health/research/hdns/services/data-access-guidelines.html.
Ethics statements
Ethics approval
This research project was approved by the Nova Scotia Health Authority Research Ethics Board (File #1021997).
Acknowledgments
The authors would also like to acknowledge the support of Dr Tara Sampalli, Dr Rick Gibson and Dr Jonathan Ross over the course of this project.
References
Supplementary materials
Supplementary Data
This web only file has been produced by the BMJ Publishing Group from an electronic file supplied by the author(s) and has not been edited for content.
Footnotes
Contributors All four listed authors certify that they have participated sufficiently in the work to take public responsibility for the content, including participation in the concept, design, analysis, writing or revision of the manuscript. Initial conception, design and acquisition of data were undertaken by MR and GK. Analysis and interpretation of data were done by MR, GK, AR and PA. Drafting of the manuscript was undertaken by MR, while its revision for important intellectual content was completed by MR, PA, AR and GK.
Funding This project was supported through funding from the Canadian Institutes of Health Research and Research Nova Scotia though the Maritime SPOR SUPPORT Unit and the Building Research for Integrated Primary Healthcare (BRIC-NS) Network. Funding for this project was provided by the Maritime SPOR SUPPORT Unit (Student Award: PSO-MSSU-2019-2217) and two separate grants from the Canadian Institutes of Health Research (Operating Grant #410513 and Operating Grant #414388).
Map disclaimer The depiction of boundaries on this map does not imply the expression of any opinion whatsoever on the part of BMJ (or any member of its group) concerning the legal status of any country, territory, jurisdiction or area or of its authorities. This map is provided without any warranty of any kind, either express or implied.
Competing interests None declared.
Provenance and peer review Not commissioned; externally peer reviewed.
Supplemental material This content has been supplied by the author(s). It has not been vetted by BMJ Publishing Group Limited (BMJ) and may not have been peer-reviewed. Any opinions or recommendations discussed are solely those of the author(s) and are not endorsed by BMJ. BMJ disclaims all liability and responsibility arising from any reliance placed on the content. Where the content includes any translated material, BMJ does not warrant the accuracy and reliability of the translations (including but not limited to local regulations, clinical guidelines, terminology, drug names and drug dosages), and is not responsible for any error and/or omissions arising from translation and adaptation or otherwise.