Article Text

Abstract
Background One way to provide performance feedback to hospitalists is through the use of dashboards, which deliver data based on agreed-upon standards. Despite the growing trend on feedback performance on quality metrics, there remain limited data on the means, frequency and content of feedback that should be provided to frontline hospitalists.
Objective The objective of our research is to report our experience with a comprehensive feedback system for frontline hospitalists, as well as report the change in our quality metrics after implementation.
Design, setting and participants This quality improvement project was conducted at a tertiary academic medical centre among our hospitalist group consisting of 46 full-time faculty members.
Intervention or exposure A monthly performance feedback report was distributed to provide ongoing feedback to our hospitalist faculty, including an individual dashboard and a peer comparison report, complemented by coaching to incorporate process improvement tactics into providers’ daily workflow.
Main outcomes and measures The main outcome of our study is the change in quality metrics after implementation of the monthly performance feedback report
Results The dashboard and rank order list were sent to all faculty members every month. An improvement was seen in the following quality metrics: length of stay index, 30-day readmission rate, catheter-associated urinary tract infections, central line-associated bloodstream infections, provider component of Healthcare Consumer Assessment of Healthcare Providers and Systems scores, attendance at care coordination rounds and percentage of discharge orders placed by 10:00.
Conclusions Implementation of a monthly performance feedback report for hospitalists, complemented by peer comparison and guidance on tactics to achieve these metrics, created a culture of quality and improvement in the quality of care delivered.
- healthcare quality improvement
- hospital medicine
- performance measures
- quality improvement
This is an open access article distributed in accordance with the Creative Commons Attribution Non Commercial (CC BY-NC 4.0) license, which permits others to distribute, remix, adapt, build upon this work non-commercially, and license their derivative works on different terms, provided the original work is properly cited, appropriate credit is given, any changes made indicated, and the use is non-commercial. See: http://creativecommons.org/licenses/by-nc/4.0/.
Statistics from Altmetric.com
Introduction
The Institute for Healthcare Improvement’s triple aim approach to optimising health system performance includes improving the patients’ experience (including quality and satisfaction) and population health and reducing the per capita cost of healthcare.1 Since its inception more than 20 years ago, hospital medicine has been integral to providing high-quality care in the inpatient setting.2 Hospitalist participation in achieving local quality priorities is recognised by hospital executives as a key area of collaboration between hospital medicine groups and hospital administration.3
Healthcare spending constitutes nearly 18% of the gross domestic product in the USA.4 An estimated 30% of this expenditure is considered wasteful.5 The emphasis on quality was operationalised with the Center for Medicare Services’ 2016 Inpatient Prospective Payment System (IPPS). IPPS paved the way for a shift in reimbursement from quantity to quality with a reimbursement model based on quality metrics.6 Providers and hospitals have a significant opportunity for financial gain through focusing on improving quality metrics, as well as a substantial risk of losing money if they fail to meet quality goals.7
While outcomes on many quality metrics are related to hospital-based factors,8 variability in physician performance is also associated with variation in quality outcomes.9 10 Despite the emphasis and focus on life-long self-directed learning and improvement, research has consistently shown that physicians have a limited ability in accurately assessing their individual performance.11 12
Gerteis et al13 asserted that performance feedback is pivotal to data-driven models of quality improvement. A Cochrane review of audit and feedback found a median absolute improvement of 4% in guideline-concordant care,14 whereas a recent systematic review15 and meta-analysis16 demonstrated that audit and feedback had a modest but significant effect on quality outcomes.
One way to provide feedback to hospitalists is through the use of dashboards that deliver data on individual performance compared with agreed-upon standards or peer comparison.14 The research regarding the impact of improvement on quality of care with the use of dashboards is mixed.15 17 18 While dashboards have so far been primarily used in the outpatient setting,6 some hospitalist groups have deployed them in the inpatient setting with improvement in performance metrics.19–21
Despite the growing trend on feedback performance on quality metrics, there remain limited data on the means, frequency and content of feedback that should be provided to physicians, particularly frontline hospitalists. In addition, there is also a paucity of published information on best practices around mentoring and support that should accompany sharing of performance metrics with hospitalists. The Agency of Healthcare Quality and Design (AHRQ) has issued guidance addressing these areas. We report our experience with a comprehensive feedback system for frontline hospitalists created and implemented using best practices for designing and operationalising confidential physician performance reports as laid out by the AHRQ.22 We also report the change in our quality metrics after the implementation of this system for the same time period.
Methods
This quality improvement project was conducted in the section of hospital medicine at the Medical College of Wisconsin in Milwaukee, USA. Our hospitalist group consists of 46 full-time equivalent (FTE) faculty members. Of the 46 members, 40 are daytime faculty, and the rest exclusively work night shifts. All daytime hospitalists were included in this project. The purpose of our performance feedback report was to provide ongoing feedback to our hospitalist faculty on their individual performance on outcome and process measures, along with a reminder of section targets and tactics for improvement. A performance feedback report for hospitalists was created based on the guidelines provided by the AHRQ. There are two documents included in the feedback report: an individual dashboard and a peer comparison report. The performance metrics chosen for this quality improvement project are presented in table 1.
Performance improvement categories and metrics used
These metrics were chosen in active discussion with hospitalists who are leaders within the section of hospital medicine and the leadership team of our hospital partner. We considered other metrics such as mortality rate and utilisation of inpatient admission order sets for specific diseases for inclusion in the performance feedback report. Mortality rate was excluded because our group has historically done very well on mortality metrics. Order set utilisation rate was excluded because we did not have a robust mechanism to capture these data on an ongoing basis.
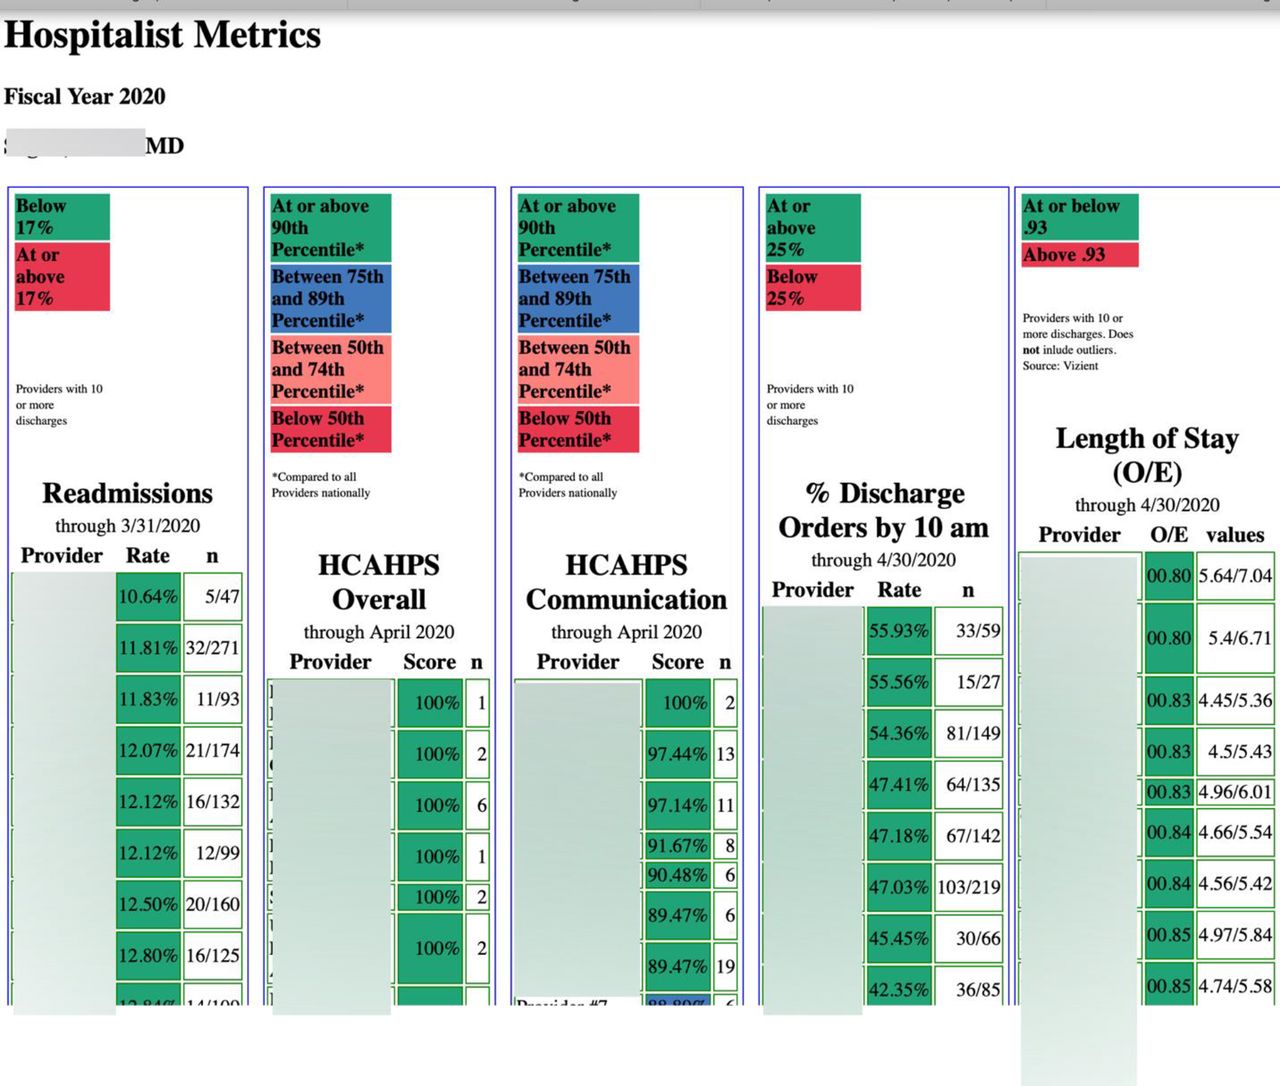
Included on each hospitalist’s dashboard are the individual provider’s performance on each metric and the fiscal year-to-date target goals for each metric (see figure 1). The rank order list arranges all faculty by performance on the following metrics: Healthcare Consumer Assessment of Healthcare Providers and Systems (HCAHPS) scores, readmission rates, length of stay (LOS), attendance at care coordination rounds (CCRs) and discharge orders placed by 10:00 (see figure 2). The names of faculty meeting quality metric targets are unmasked, along with the name of the receiving faculty member. The names of underperforming faculty are masked. At least 5 and usually 10 (or more) hospitalists underperform on each quality metric during any given month. Therefore, it is not possible to easily determine who these hospitalists are. In any case, such ‘relative social ranking’ is an accepted way to provide confidential performance feedback to physicians.22

Section of hospital medicine monthly dashboard sample. CAUTI, catheter-associated urinary tract infection; CLABSI, central line-associated bloodstream infection.
Section of hospital medicine monthly peer comparison report sample. HCAHPS, Healthcare Consumer Assessment of Healthcare Providers and Systems; O/E, observed to expected.
The methods by which data are collected and integrated to form the dashboard and rank order list are described below.
Dashboard data sources
We integrated data from multiple data sources to develop hospitalist dashboards for the specified fiscal year-to-date time period. Sources of data for the dashboard are listed in table 2. Complete data extraction and transformation was performed using Microsoft SQL Server Management Studio and R Studio.
Sources of data for the dashboard and rank order lists
Rank order list data sources
Six measures are currently displayed in the rankings. Ranked metrics include readmissions, LOS, HCAHPS scores (overall and provider communication), discharge orders placed by 10:00 and attendance at CCRs. Data for these measures are pulled from multiple sources including Vizient (readmissions and LOS), Epic Clarity (patient discharge time) and Press Ganey (HCAHPS). Each provider’s National Provider Identifier (NPI) Standard is included in the download when the data are pulled. Including the NPI ensures that there is a unique identifier for each provider. Each pulled data set is then uploaded into its own individual table within SQL Server. SQL Views are created to evaluate the ranking of each provider within each of the seven measures. The SQL Views also assign colours based on the percentile of the provider’s performance or whether the provider meets the goals established by the Hospitalist Section. Microsoft Visual Studio is then used to assemble the data from the SQL Views into an HTML page using the NPI to join the seven data sets. We then created a separate HTML page for each provider, thus allowing each provider to see their own score and where they rank while ‘masking’ the scores of other providers who have not met the established goal.
The performance feedback report consisting of both the dashboard and rank order list were sent to each individual provider on a monthly basis. Two data analysts generated the dashboard and rank order list for each hospitalist. One administrative assistant in the section of hospital medicine collated reports from both analysts and generated a performance feedback report for each hospitalist. In accordance with AHRQ guidelines, specific tactics to address each metric were shared with providers on a regular basis through a monthly newsletter and a Quality Improvement (QI) guide. The section of hospital medicine monthly newsletter listed each quality metric, the current fiscal year target for each metric, the current state of each metric and specific improvement tactics applicable to each metric. Some of these tactics were derived from existing best institutional practices. For instance, appropriate indications for inserting foley catheters, sending urine analysis samples only after replacing chronic foley catheters and not ordering a urine analysis with reflex culture were some of the tactics listed in the monthly newsletter to reduce catheter-associated urinary tract infections (CAUTIs). Tactics were also derived from existing QI projects. For instance, we had an ongoing QI project on calling primary care providers with a verbal sign-out at the time of discharging someone at a high readmission risk. A reminder regarding this tactic was included in the monthly section newsletter and in the daily QI guide. The purpose of the ‘daily QI guide’ was to provide a framework to incorporate tactics into a provider’s daily workflow by making suggestions on the best time point in the workday to incorporate various tactics. For instance, the best time to write care coordination notes is before starting bedside rounds so that discharge information is available to members of the care coordination team early in the day. Each hospitalist received his or her own laminated copy in the beginning of the year. Copies of QI guides were posted in all common work areas.
The dashboard and rank order list were complemented by peer mentorship and support that occurs during monthly faculty meetings. The status of each quality metric was discussed and specific tactics for improvement reinforced on an ongoing basis. In addition, names of the top performers on individual quality metrics were shared with the group during section meetings on a quarterly basis. Top performers were then invited to share best practices that led them to be successful in achieving high scores.
Finally, individualised in-person feedback on performance metrics was provided by the section chief via once-a-year one-on-one meetings. During these meetings, the section chief discussed with the faculty member their performance on each metric, reviewed tactics and brainstormed barriers in achieving targets. After discussing these barriers, individualised action plans were developed with each faculty member to improve his or her performance on quality metrics.
A discussion of performance metrics and tactics to achieve targets was included as part of the onboarding process for new faculty. This was key because our section onboarded 11 FTEs over the 1-year period for this report. The section chief then met with each new hire at 3 months to provide individualised one-on-one feedback and develop individualised action plans.
Results
Starting July 2018, the dashboard and rank order list were sent to all faculty members every month. An improvement was seen in the following quality metrics after the introduction of performance feedback reports: LOS index, 30-day readmission rate, CAUTIs, central line-associated bloodstream infections (CLABSIs), provider communication component of HCAHPS scores, attendance at CCRs and percentage of discharge orders placed by 10:00. Table 3 shows the section’s performance on these metrics before (July 2017 to June 2018) and after (July 2018 to June 2019) the introduction of the performance feedback report.
Change in quality metrics between FY 2018 and FY 2019
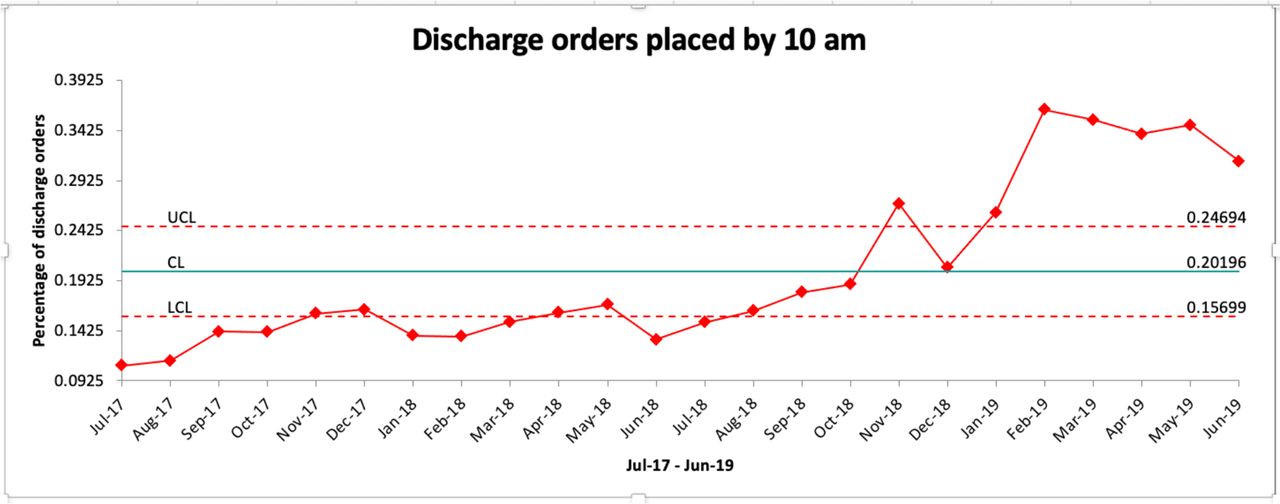
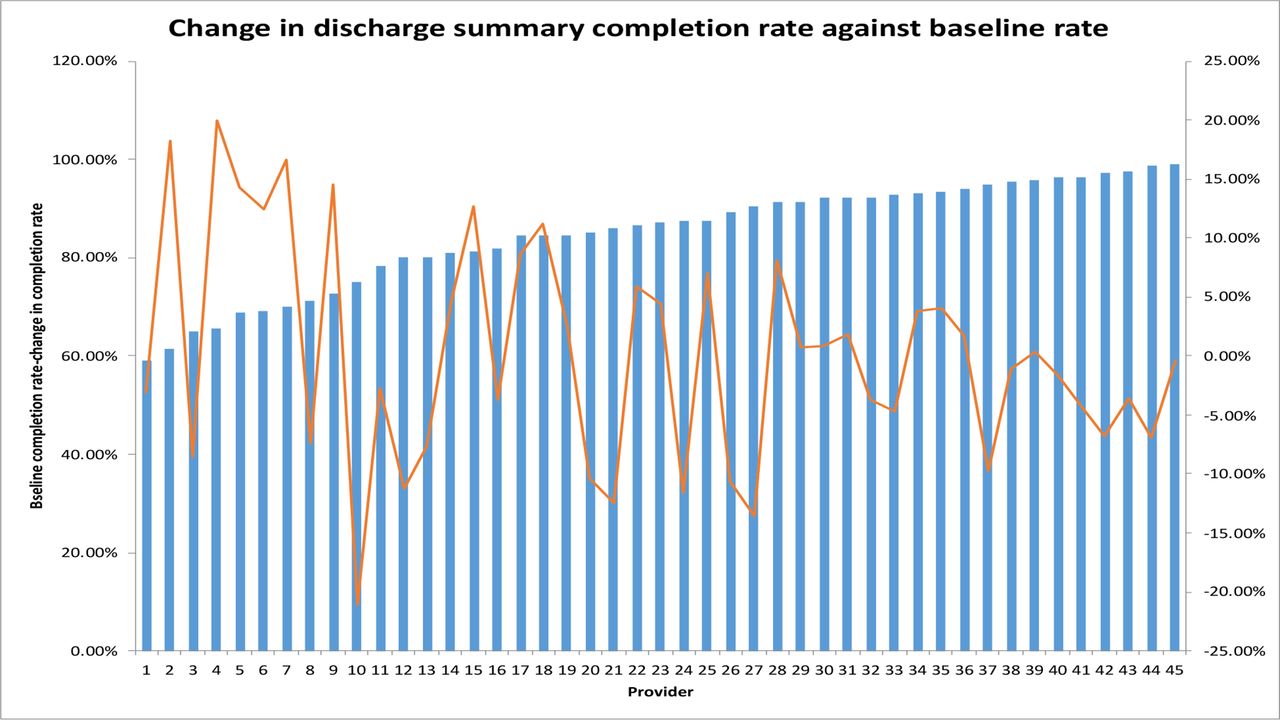
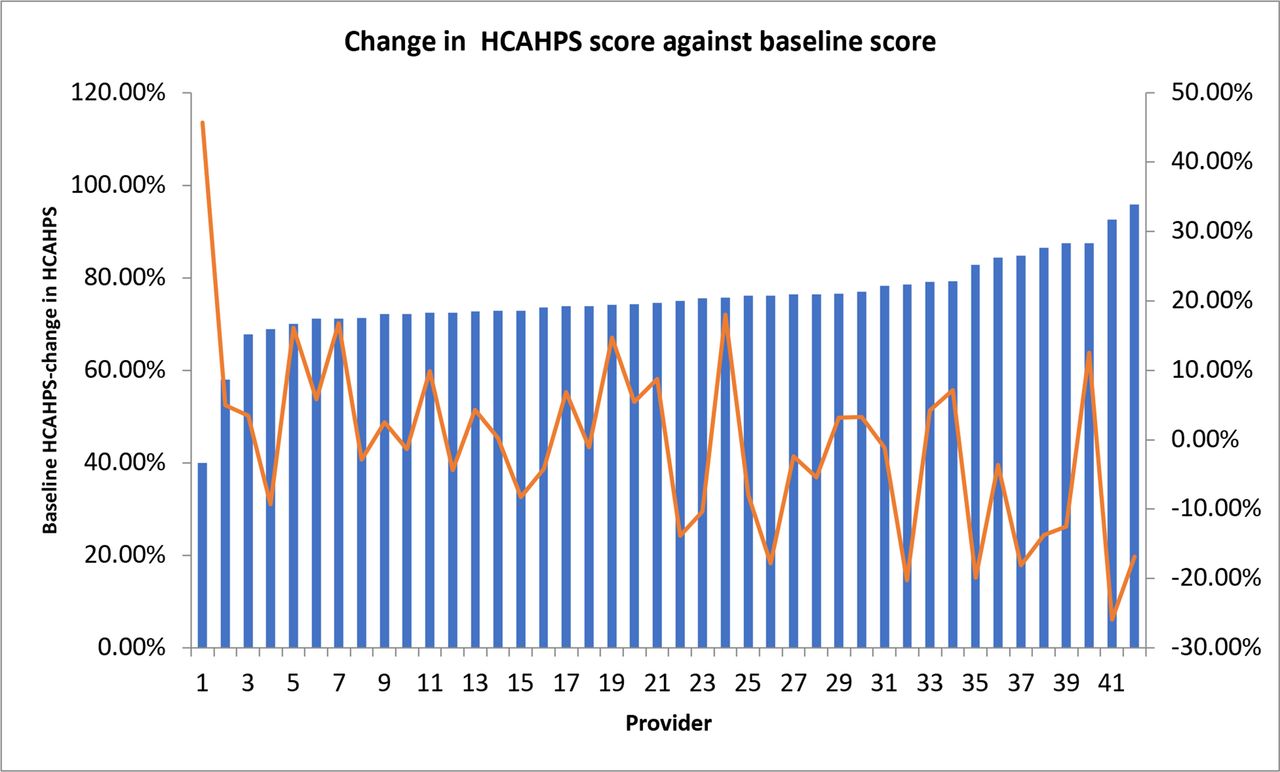
Control charts show trends in 30-day readmission rate (figure 3), number of CAUTIs (figure 4), attendance at CCRs (figure 5), discharge orders placed by 10:00 (figure 6) and discharge summaries completed in 24 hours (figure 7) in the 1 year before and after the introduction of performance feedback reports. A run of six or more data points on control charts is called a ‘shift’ and indicates that the variation is due to a non-random change in the process and not due to random variation inherent in that process.23 Due to changes in how data are extracted and reported in our healthcare system, we did not have access to month-by-month data on HCAHPS by provider, CLABSIs and LOS index. We also correlated change in performance for individual providers on discharge orders placed by 10:00 (figure 8), 24-hour discharge summary completion rate (figure 9), provider HCAHPS scores (figure 10) and 30-day readmission rate (figure 11) to baseline performance on these same metrics. Using the Pearson’s correlation coefficient, there was a trend towards a negative correlation between baseline and change in proportion of discharge orders placed by 10:00 (r=−0.2675, p=0.08) and a statistically significant negative correlation between baseline and change in provider HCAHPS scores (r=−0.6713, p<0.00001), baseline and change in readmission rates (r=−0.8127, p<0.00001) and baseline and change in 24-hour discharge summary completion rate (r=−0.3327, p=0.02). We did not have provider-level data for LOS index and attendance at CCRs, and the number of CAUTI/CLABSI events per provider was too low to calculate a meaningful correlation.

Trend in readmission rates. CL, control limit (median); LCL, lower confidence limit; UCL, upper confidence limit.
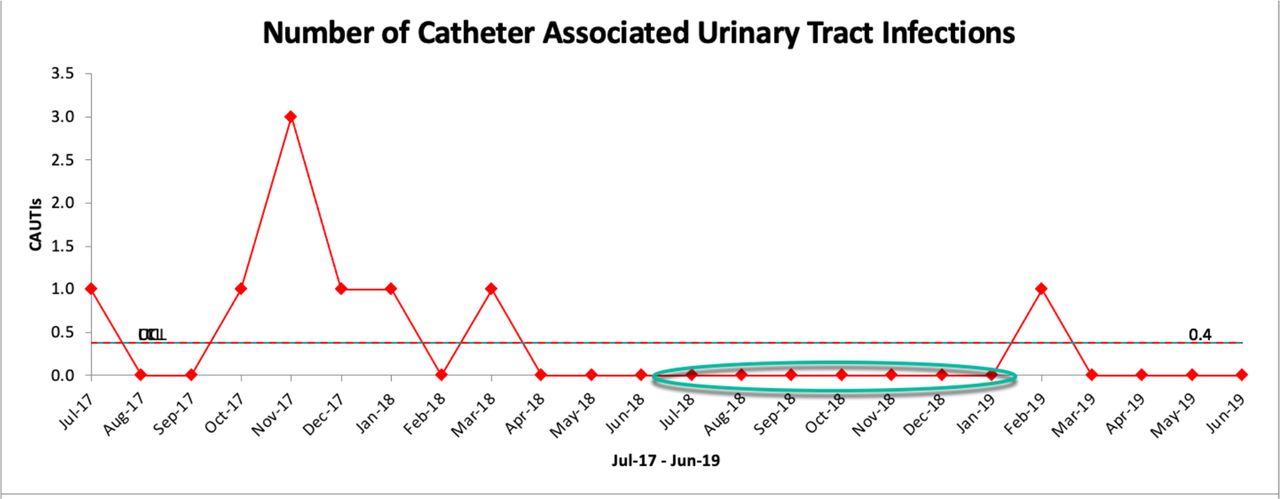
Trend in CAUTIs. ‘Shift’ is circled in green. CAUTIs, catheter-associated urinary tract infections.
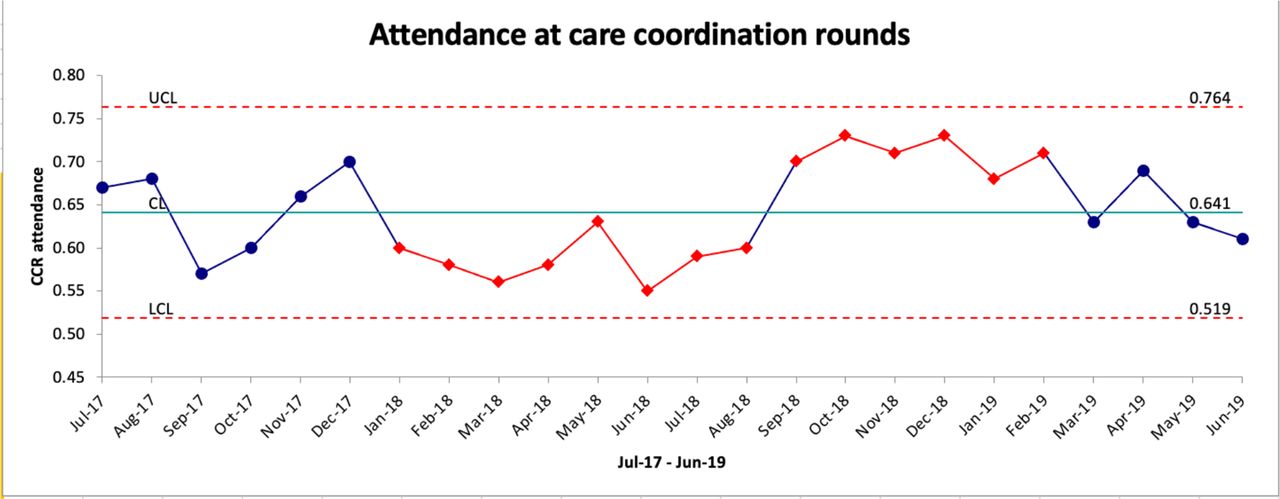
Trend in attendance at CCRs. ‘Shifts’ in performance are shown in red. CCR, care coordination round; CL, control limit (median); LCL, lower confidence limit; UCL, upper confidence limit.

Trend in discharge orders placed by 10:00. ‘Shifts’ in performance are shown in red. CL, control limit (median); LCL, lower confidence limit; UCL, upper confidence limit.
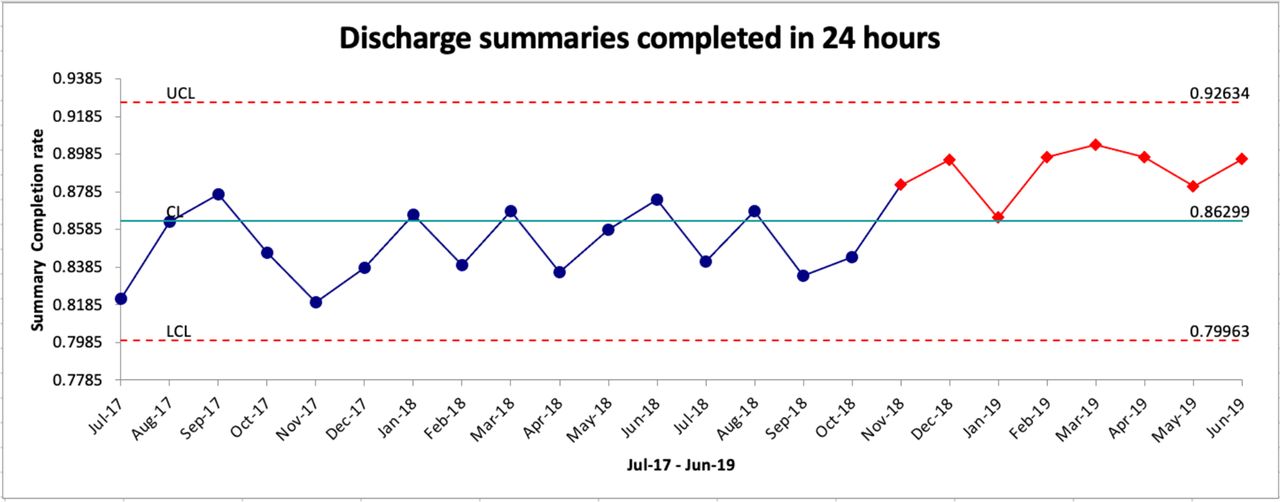
Trend in discharge summaries completed in 24 hours. ‘Shift’ in performance is shown in red. CL, control limit (median); LCL, lower confidence limit; UCL, upper confidence limit.

Change in percentage of discharge orders placed by 10:00 (orange line) against baseline discharge percentage of discharge orders placed by 10:00 (blue bars) for individual hospitalists.

Change in discharge summary completion rate (orange line) plotted against baseline discharge summary completion rate (blue bars) for individual hospitalists.

Change in provider HCAHPS score (orange line) plotted against baseline provider HCAHPS scores (blue bars) for individual hospitalists. HCAHPS, Healthcare Consumer Assessment of Healthcare Providers and Systems.

Change in readmission rate (orange line) plotted against baseline readmission rate (blue bars) for individual hospitalists.
Discussion
Our study provides a practical approach to providing feedback that can help improve quality outcomes.18 The time spent by analysts generating the dashboard and rank order lists, once the templates to do so had been set up, was considered manageable by their respective divisions. By spreading the tasks for generating and disseminating the feedback report among three individuals, we were able to create a sustainable process for auditing and disseminating feedback data.24
The goal of our feedback system, in combination with tactics for improvement, was to help faculty identify areas of workflow and practice improvement and provide faculty the opportunities to implement tactics in quality domains in which they are consistently and significantly underperforming. While there is no consensus on the most effective way to implement provider feedback, some factors that have been correlated with effective feedback systems include the following: having a low baseline performance,11 15 18 provided by a supervisor or trusted colleague,15 18 provided more than once,15–18 and delivered in verbal and written formats and includes explicit targets and action plan.15 16 18 We incorporated many of these elements by brainstorming tactics to help improve performance in one-on-one meetings between frontline hospitalists and the section chief and through peer-mentoring during monthly section meetings, and by sending out performance feedback data and improvement tactics on a monthly basis. Anecdotal feedback on performance feedback reports and one-on-one meetings was positive, particularly from hospitalists straight out of residency training. These hospitalists reported they found these reports and meetings helpful as an objective guide to potential areas of improvement.
We provided feedback to our hospitalists on readmission rates, overall and provider-specific HCAHPS scores, CAUTI/CLABSI events, LOS index, discharge orders placed by 10:00 and discharge summaries completed in 24 hours. The choice of these metrics was driven by a discussion between the section of hospital medicine and our hospital management and reflected the top financial and operational priorities of our hospital, namely, patient satisfaction, readmissions, healthcare-associated infections, LOS and hospital capacity. As the average financial support provided by hospitals is as high as $166 806 per FTE academic hospitalist (State of Hospital Medicine 2020 report, Society of Hospital Medicine),25 it is important to align performance improvement efforts to the needs and goals of the health system. We saw an improvement in all metrics included in performance feedback reports except for overall HCAHPS scores. Overall HCAHPS scores are determined by patient responses to 19 different questions on 7 different domains ranging from the quietness of the hospital environment to communication with doctors and nurses.26 We saw a slight improvement in our provider HCAHPS scores despite registering a decline in the overall HCAHPS score for our section during the before and after time periods of our study.
We saw an inverse correlation in improvement on performance metrics and baseline performance on these metrics. This is consistent with previous literature that suggests greater improvement in performance with feedback when baseline performance is low.15 We saw a weak correlation between baseline proportion of discharge orders placed by 10:00 and improvement in discharge orders placed by 10:00, a moderate correlation between baseline discharge summaries completed in 24 hours and improvement in proportion of discharge summaries completed in 24 hours, and a high correlation between low baseline provider HCAHPS scores and improvement in provider HCAHPS scores. We also saw a high correlation between high baseline 30-day readmission rates and decline in 30-day readmission scores in the 1 year after the introduction of performance feedback reports. These findings suggest that the potential for performance improvement is the highest among hospitalists with the lowest baseline performance.
We made active efforts to engage the group as we started providing monthly feedback around performance metrics. This was particularly important as our inpatient census increased significantly over the same time period as we introduced this feedback system. We were able to work with our hospital management to increase our workforce allocation, increase the number of hospitalist teams and bring patient encounter numbers down to levels that were considered safe and manageable by the group. This allowed the group to focus on tactics to improve performance metrics.
We solicited and incorporated feedback on ongoing additions and changes to the feedback system. Subsequently, several changes were implemented. For instance, a monthly readmission meeting was created for patients with readmissions within 72 hours. The purpose of these meetings was to discuss what could have been done differently for these patients from both a clinical and systems-based perspective to prevent the readmission. In addition, each hospitalist was provided Medical Record Numbers (MRNs) of their patients with 30-day readmissions. The addition of these MRNs to the monthly feedback report was to give faculty the opportunity to review the chart and reflect on what could have been done differently. We also changed the target on discharge summaries completed in 24 hours from 90% to 85%. All of these changes were suggested by frontline faculty.
We actively emphasised to the group in electronic and in-person communication that performance on many quality metrics was based on systems of care rather than solely on individual performance. In particular, 30-day readmissions,27 LOS index,28 hospital-acquired infections and HCAHPS29 were specifically identified as metrics that cannot be ‘fixed’ solely by an individual provider. For example, 30-day readmission rates tend to be multifactorial in nature and may be based on system factors such as the ability of a patient to obtain and attend a follow-up appointment, as well as refilling medications after discharge. The emphasis in faculty communication was on incorporating clearly identified tactics assigned to addressing each metric rather than the metric itself. For example, an individual faculty member has more control on attendance at CCRs rather30 than LOS. Process metrics that are under greater control of an individual provider were identified and communicated as such. These included percentage of discharge orders placed by 10:00, CCR attendance and percentage of discharge summaries completed within 24 hours. In addition, we tied a nominal portion (1%–2%) of total faculty compensation to meeting targets on these three-process metrics. Faculty compensation was not affected by performance on systems-based metrics.
Our project has several limitations. First and foremost, this project was conducted at a single tertiary academic medical centre, and this impacts generalisability. However, our group is fairly representative of other academic hospital medicine groups as our hospitalists practise at a tertiary care hospital with both medical students and resident physicians. Another limitation of this project was that other quality improvement projects were simultaneously conducted surrounding these same quality metrics. Subsequently, we are unable to determine a causal relationship between performance feedback reports and the improvement seen in several of the quality metrics. An increase in the number of hospitalists hired by the section made our census per team more manageable. This could also have resulted in an improvement in quality metrics by allowing staff more time to focus on their patients. The lack of information on balancing measures for each quality metric is also a limitation of our study. For instance, completing discharge summaries within the 24 hours’ time frame can result in poorly constructed discharge summaries. We did not evaluate the quality of our discharge summaries and are unable to determine whether this occurred. We did see an improvement in our LOS index despite an improvement in the proportion of discharge orders placed by 10:oo. This was reassuring, as one study on improving the timing of discharge orders found an increase in LOS with patients staying longer so that they could be discharged early the following day.31 A final limitation to consider is that we did not formally survey our hospitalists on their reaction to the performance feedback reports. While faculty feedback was sought and incorporated via one on-one and group meetings on an ongoing basis, it may be valuable to survey faculty on the impact and utility of feedback reports.
Conclusion
We designed and implemented a monthly performance feedback report containing individual performance metrics and peer comparison for our frontline hospitalists. Feedback reports were complemented by ongoing guidance on tactics to help achieve quality targets, celebration of individual successes and peer mentoring on best practices by high performers. We saw an improvement in our group’s performance on almost all targeted process and outcome metrics. A performance feedback report that delivers individual performance metrics complemented by guidance on tactics to achieve these metrics can help create a culture of quality that can improve the quality of care delivered by a hospitalist group.
References
Footnotes
Twitter @ankursegon
Contributors BB contributed to the drafting of the paper, literature review and data analysis. SN contributed to the drafting of the paper and data collection and analysis. NW contributed to the drafting of the paper and data collection and analysis. RW contributed to the drafting of the paper and data collection and analysis. YS contributed to generating the project idea and drafting of the manuscript. AS contributed to generating the project idea, project implementation, data analysis and drafting of the manuscript.
Funding The authors have not declared a specific grant for this research from any funding agency in the public, commercial or not-for-profit sectors.
Disclaimer This project was deemed IRB exempt by our institution.
Competing interests None declared.
Patient and public involvement Patients and/or the public were not involved in the design, or conduct, or reporting, or dissemination plans of this research.
Patient consent for publication Not required.
Provenance and peer review Not commissioned; externally peer reviewed.
Data availability statement Data are available upon request.