Article Text

Abstract
Background Failure mode and effects analysis (FMEA) is a method of risk assessment increasingly used in healthcare over the past decade. The traditional method, however, can require substantial time and training resources. The goal of this study is to compare a simplified scoring method with the traditional scoring method to determine the degree of congruence in identifying high-risk failures.
Methods An FMEA of the operating room (OR) to intensive care unit (ICU) handoff was conducted. Failures were scored and ranked using both the traditional risk priority number (RPN) and criticality-based method, and a simplified method, which designates failures as ‘high’, ‘medium’ or ‘low’ risk. The degree of congruence was determined by first identifying those failures determined to be critical by the traditional method (RPN≥300), and then calculating the per cent congruence with those failures designated critical by the simplified methods (high risk).
Results In total, 79 process failures among 37 individual steps in the OR to ICU handoff process were identified. The traditional method yielded Criticality Indices (CIs) ranging from 18 to 72 and RPNs ranging from 80 to 504. The simplified method ranked 11 failures as ‘low risk’, 30 as medium risk and 22 as high risk. The traditional method yielded 24 failures with an RPN ≥300, of which 22 were identified as high risk by the simplified method (92% agreement). The top 20% of CI (≥60) included 12 failures, of which six were designated as high risk by the simplified method (50% agreement).
Conclusions These results suggest that the simplified method of scoring and ranking failures identified by an FMEA can be a useful tool for healthcare organisations with limited access to FMEA expertise. However, the simplified method does not result in the same degree of discrimination in the ranking of failures offered by the traditional method.
- FMEA - failure modes and effect analysis
- Surgery
- Hand-off
Statistics from Altmetric.com
Introduction
For more than a decade, the US Joint Commission, an independent, not-for-profit organisation that accredits hospitals based on quality standards, has required hospitals to conduct proactive risk assessments of high risk care processes, as part of a nationwide effort to reduce patient harm due to medical error.1 One commonly recommended proactive risk assessment method is a failure mode and effects analysis (FMEA), a methodology developed in 1949 by the Department of Defense and widely used in industries such as aviation and nuclear energy.2–,4 Over the past decade, the FMEA approach has increasingly been used to examine high-risk processes in healthcare, such as medication administration, surgical procedures and emergency care.5–7
An FMEA is typically performed by assembling a multidisciplinary team involved in and knowledgeable about a process of care of interest. In FMEA sessions, the team describes all of the steps in the systems and processes of care which are then graphically depicted in a process map. The team then systematically examines each step in the process to identify potential failures. Next, three failure mode attributes are identified, assessed and scored: (a) frequency of the failure, (b) severity of the consequence(s) of the failure and (c) safeguards or detection ability to mitigate the consequences of the failure. These scores are then used to rank the risk of each failure scenario. A brief summary of steps involved in an FMEA is shown in figure 1.

Steps involved in the failure mode and effects analysis (FMEA) process.
Traditional FMEA methods from the US Army and the Automotive Industry Action Group use 10-point scales to assign scores for each failure attribute (ie, frequency, severity, safeguards).8 A risk priority number (RPN), calculated as the product of three scores (ie, frequency x severity x safeguard), is used to rank failures. In most high-risk industries, reliability engineers customise each 10-point scale through imputation and interpretation of historical data about failures in the systems and processes under examination. However, healthcare differs substantially because this field often lacks (a) historical data about failures in systems and processes of care and (b) reliability engineering expertise to interpret the existing data. Consequently, there is substantial variation in scoring methods for a given healthcare process, which can affect the external validity of FMEA results.9–13
Applications of the traditional FMEA commonly used in healthcare include failure mode, effects and criticality analysis (FMECA) and healthcare failure mode and effect analysis (HFMEA). FMECA was the term used in the original description of FMEA methodology by the US Army. Although inconsistently referenced in its designation, many traditional applications of FMEA still include Criticality Indices (CIs), calculated as the product of severity and frequency, as part of the overall risk assessment. HFMEA was developed by the Veterans’ Affairs National Center for Patient Safety in 2001 to address the logistical challenges of traditional FMEA and its applicability to healthcare.14 HFMEA substantially modifies several steps of the traditional FMEA methodology and also adds two additional steps: hazard scoring and a decision tree.14
In an effort to make the FMEA approach more accessible to healthcare while also remaining consistent with the original methodology, Coles et al15 published a simplified method of scoring and ranking failures using abridged scales for the three failure attributes (ie, frequency, severity, safeguards). A comparison of the simplified and traditional scoring methods is shown in table 1. Although numerous studies have reported results using various scoring methods, there has been, to our knowledge, no prior comparison of simplified versus traditional methods.6 ,16–20 The goal of this study is to compare a simplified scoring method with the traditional scoring method to determine the degree of congruence in identifying high-risk failures. Both simplified and traditional scoring methods were applied to the failures identified in a specific, complex process of care: operating room (OR) to intensive care unit (ICU) postsurgical patient handoff.
Comparison of traditional and simplified scoring methods
Methods
FMEA setting and topic
For this study, we conducted an FMEA of the OR to ICU handoff. A patient handoff includes the physical transfer of the patient (eg, patient is transferred between units within a single institution or from one institution to another), as well as a communication of clinically relevant patient information for the purpose of imparting responsibility to a new clinician or team (eg, nursing shift handoff, resident sign-out).21 Inadequately performed handoffs lead to increased rates of medical errors that, in turn, can lead to complications and ultimately, to poorer long-term outcomes. Communication breakdowns, in particular, are at the root of over half of all sentinel events.22 ,23 Not surprisingly, the susceptibility for error in the handoff process is increased for critically ill patients, including those receiving solid organ transplants. ICUs have a higher rate of adverse events as a result of medical errors when compared with other hospital units, and a more than half of the adverse events occurring in ICUs are potentially life threatening.21 In particular, the transfer of a patient from the OR to the ICU involves (a) providing acute care for the critically ill patient and (b) transferring critical information about the patient to the ICU team.24
The FMEA focused on the hand off of deceased donor liver transplant recipients from the OR to the ICU at a tertiary academic hospital. Deceased donor liver transplant recipients were chosen as a model of the critically ill surgical patient population due to the complexity of their condition, necessity of a dedicated OR team and nearly universal postoperative transfer to the ICU. The Northwestern University Institutional Review Board, whose role is to protect the rights and welfare of human subjects involved in research, approved this study prior to data collection.
FMEA process
Preliminary observations and process mapping
Two members of the research team (LMM and RK) conducted five observations of OR to ICU handoffs to capture key steps of the process and to ascertain all pertinent clinical roles (eg, transplant surgeon, scrub nurse, anaesthesiology fellow) for inclusion in the FMEA. Any observed failures or safeguards were also noted and used as prompts during the FMEA sessions. The research team then created a preliminary process map of the OR to ICU handoff process that was reviewed and validated during FMEA sessions (figure 2).

Steps involved in the operating room (OR) to intensive care unit (ICU) handoff process.
FMEA sessions
A total of 14 sessions were conducted by the first author (LMM) after training in the conduct of FMEA by the system engineer and senior author (RK and JH). A total of 27 clinicians participated including three liver transplant surgeons, three transplant fellows, three trauma/critical care surgeons, two trauma/critical care fellows, three transplant anaesthesiologists, three anaesthesia residents, three surgical ICU nurses, three OR nurses and three surgical residents. Interviews with attending transplant surgeons, trauma/critical care surgeons and transplant anaesthesiologists were conducted individually to ensure accurate representation of failures, as substantial variation in care was noted during initial ethnographic observations based on individual attending physician/surgeon direction. All other interviews were conducted in groups of three clinicians, based on specialty with the exception of trauma/critical care fellows which only has two fellows at any point in time.
During the sessions, clinicians were asked to describe in their own words, each of the steps in the OR to ICU handoff, including tasks assigned to their specific role. Next, they were asked to identify all potential failures (ie, any aspect of the patient handoff that does not go as planned or that presents a challenge to handoff completion) associated with each step. The potential failures were generated in a systematic manner by asking clinicians to think about four themes when conceptualising the failures: how this process step can be (a) done incorrectly, (b) done incompletely, (c) omitted or (d) delayed?
For each identified failure, clinicians were then asked to estimate or report the (a) frequency of the failure, (b) severity or impact of the failure and (c) any existing safeguards in place to mitigate the impact of the failure. Each session lasted approximately 1–2 h and was audio-recorded in its entirety and transcribed verbatim by a professional transcription service specialising in medical transcription (LeePerfect Transcribing, Chicago, Illinois, USA). The information was reviewed and used to update the process map and hazard table. Discrepancies or omitted information were resolved through additional interviews with clinicians, the scientific literature and existing reliability tables for occurrence of human error.
Failure scoring and ranking methods
The traditional FMEA scoring method uses a customised, 10-point scale for each of the three failure attributes.8 ,25 For frequency, a low score of ‘1’ indicates infrequent occurrence (1/10 000) and a high score of ‘10’ indicates nearly every time (≥1/10); for severity, a low score of ‘1’ indicates ‘minimal risk’ (eg, no effect) and a high score of ‘10’ indicates ‘maximum risk’ (eg, death) and for safeguard, a low score of ‘1’ indicates ‘almost certain detection’ and a high score of ‘10’ indicates ‘no known means of detection’. Failures are then ranked by CI, which is the product of the frequency and severity scores, and RPN, which is the product of frequency, severity and safeguard scores. The top 20% of failures by CI were designated ‘critical’ based on the Pareto Principle (80/20 rule).25 An RPN of 300 was chosen as a threshold above which failure modes would be designated ‘critical’ based on prior literature and research team consensus.26 ,27
The simplified FMEA scoring method, based on the description by Coles et al,15 uses simplified descriptions of scores for each of the three attributes of a failure. Scores range from F1: ‘remote’ to F4: ‘frequent’ for frequency; C0: ‘no consequence’ to C4: ‘death’ for severity and S1: ‘formal checks to S3: ‘no regular checks for safeguard. Failures are then ranked as high, medium or low risk, using a scoring matrix (figure 3). Any failure ranked as ‘high risk’ was designated ‘critical’ based on the original description by Coles et al and research team consensus.
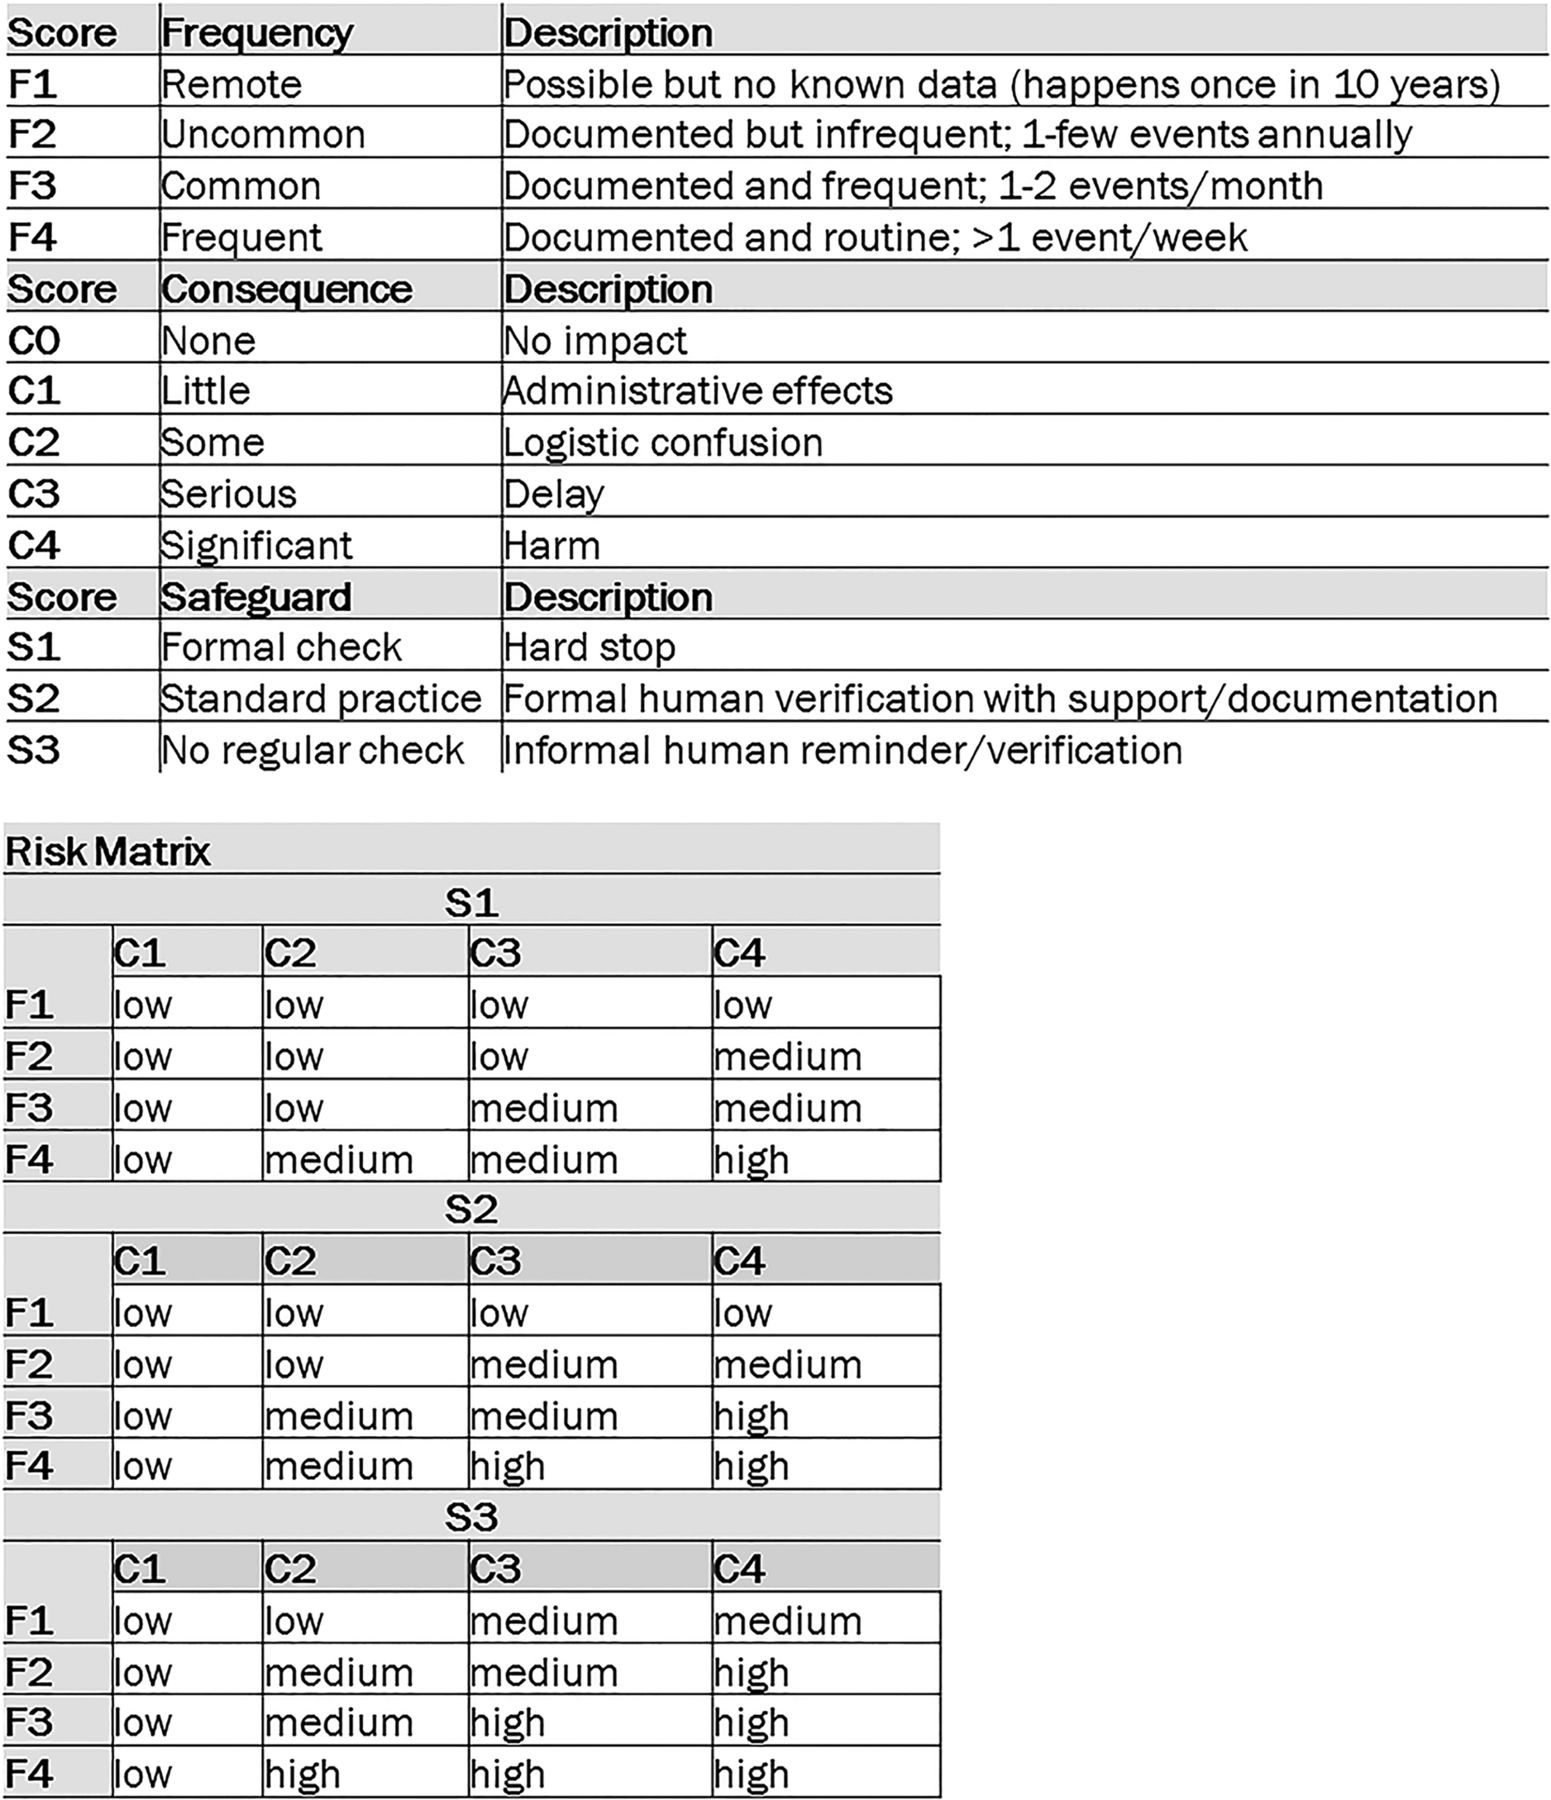
Overview of the simplified scoring method.
Most notably, the scales for each method's respective frequency and severity scores differ. For example, the simplified method's frequency scale does not specify any unit of time (denominator) and, therefore, an FMEA team must standardise the units of time between clinician estimates, whereas the traditional method's frequency scale specifies a unit of time (eg, one in 10 transfers; once a week). Standardisation of the unit of measurement is important because, for example, a transplant nurse who works one shift per week may report a different frequency than a nurse who works six shifts per week. When using the simplified method, the FMEA team must pay careful attention to standardise the unit of time for clinicians’ frequency estimates. The severity scales also differ between the simplified and traditional scoring methods. The simplified method's severity scale does not differentiate between temporary and permanent harm, thereby restricting the ability to identify those failures with the most severe consequences, whereas the traditional method clearly delineates between the two (temporary: S6–S7; permanent: S8–S10).
Failures for the entire OR to ICU handoff process were scored via a series of 90 min meetings between the systems engineer (RK) and first author (LMM), with oversight and input from the senior author (JH) as needed. Scores were assigned to each identified failure for the three attributes (frequency, severity, impact), based on the data obtained in clinician interviews and recorded in a hazard table (see online supplementary digital content 1); those failures are related solely to technical skills or clinical judgment (eg, incorrect fascia closure, incomplete skin closure) rather than processes or systems of care. First, failures were scored using the simplified scoring method, based on the description by Coles et al.15 Next, failures were scored using the traditional scoring method. Three members of the research team (RK, LMM and JH) customised the severity and safeguard scales by (1) reviewing the scales, as described in FMEA methodological resources and (2) identifying OR to ICU handoff process outcomes for each safeguard and severity score (figure 4).8 ,25 ,28 As part of the customisation, scores remained mutually exclusive and encompassed all possible outcomes. Frequency scores were not changed from the original description.3 Once the attribute scales were customised, scores were assigned to each identified failure for the three attributes (frequency, severity, impact). Approximately 4 weeks passed between the completion of scoring session via the simplified method and the beginning of scoring session via the traditional method; the simplified scores were removed from the hazard table prior to applying the traditional scores. Once scoring was complete, the two scoring methods were compared by first identifying those failures determined to be critical by the traditional method (RPN threshold of 300 and Pareto principle) and then calculating the per cent congruence with those failures designated critical by the simplified methods (high risk).

Overview of traditional 10-point failure mode and effects analysis (FMEA) scoring scales for frequency, severity and safeguard, customised by the research team for the operating room to intensive care unit handoff.
Results
In total, 37 individual steps in the OR to ICU handoff were identified, mapped and depicted in a comprehensive process map (see online supplementary digital content 2). Most steps had multiple failures identified and 63 of 79 failures were scored with16 failures not scored as they related solely to technical skills or clinical judgment (eg, incorrect fascia closure, incomplete skin closure) rather than processes or systems of care. Table 2 shows the scores assigned to each failure by both the simplified and traditional methods for selected high-risk failures. The overall congruence between the two systems is shown in table 3.
Top failures by traditional and simplified scoring methods
Overall congruence between scoring methods
Criticality Index
The traditional method yielded CI ranging from 18 to 72. The highest 20% of CI (≥60) encompassed 12 failures. Of the 12 failures, six were designated high risk and six were designated medium risk by the simplified method (50% agreement). An additional 15 failures were included in the next 20% of CI (49–56), of which seven were designated high risk and eight of which were designated medium risk by the simplified method (52% agreement, highest 40%). Medium risk failures pertained to process steps involving preliminary communication from the OR to the ICU to inform receiving clinicians of the patient's critical care need, the verification of the ICU room preparation by the ICU nurse, the notification of the need for a ventilator and postoperative lab draws.
Risk priority number
The traditional method yielded RPNs ranging from 80 to 504. The highest 20% of RPNs (RPN≥400) encompassed 14 failures, all of which were designated high risk by the simplified method (100% agreement). There were an additional 10 failures when the threshold was lowered to an RPN ≥300 (a total of 24 failures with RPN≥300). Of the 24 failures, 22 were designated high risk and two were designated medium risk by the simplified method (92% agreement). The failures designated as medium risk pertained to process steps involving the final communication from the OR to the ICU to inform receiving clinicians of the patient's departure from the OR.
Necessary resources
Approximately 80 h were required to conduct the observations and to create the process map and template hazard table. This included 2.5 h per observation (ie, 30 min of preparation and transport time, 90 min of active observation, 60 min of debriefing and documentation) for a total of 15 h, 30 h to create and revise the process map and 35 h to create and revise the hazard tables prior to scoring. The simplified scoring method required a total of 11 labour hours with 1 h devoted to a review of the scales and 10 h devoted to scoring each failure independently. The traditional scoring method required approximately 45 labour hours with 5 h devoted to the development and customisation of the scoring scales and 40 h devoted to scoring of each failure independently (table 1).
Discussion
We sought to compare a simplified FMEA scoring method with the traditional RPN-based scoring method to determine the degree of congruence in identifying high-priority failures. An FMEA of the OR to ICU handoff was performed at a large academic medical centre to identify failures in the systems and processes of care. The attributes of each failure were then scored and ranked, using both the simplified and traditional FMEA scoring methods. Although there was significant agreement in the ranking of the failures based on RPN (92% congruence), the simplified method was less likely to identify high-risk failures based on CI alone, for example, without the consideration of level of safeguard (50% congruence). In addition, there are notable differences between the two methods. The traditional scoring method requires customisation of the 10-point scales used to score each attribute (frequency, severity and safeguard). The customised scoring scales used in the traditional method are specific, comprehensive and result in more precise scoring; a key limitation of the simplified scoring method is the imprecision of each score. For example, a failure scored with a frequency of F2 or F3 may occur weekly or quarterly, while failures scored F1 may occur as infrequently as once every 5 years. While the simplified scoring method identifies high-risk failures quite well, it cannot differentiate between failures that result in permanent versus temporary harm.
FMEA is increasingly being used as a method of risk assessment for clinical processes. However, when examined closely, there is significant variation in the scoring, and therefore, prioritisation of failures.10 ,18 ,26 ,27 ,29–32 To our knowledge, there has been no prior comparison of any simplified scoring method with the traditional method. Determining the degree of congruence between the two methods in identifying high-risk failures is an important step to better understand the application of FMEA to healthcare. The traditional method, given the needed resources, may only be feasible for larger, well-resourced healthcare organisations. The simplified method, while potentially more feasible for smaller healthcare organisations to identify higher risk failures, is limited in its ability to differentiate between failures with the highest potential risk for resulting in temporary or permanent harm. As a result, smaller or less resourced organisations using the simplified scoring method may potentially develop interventions that do not address the highest risk failures. One option may be for smaller, less resourced healthcare organisations to first use the simplified method and then repeat the scoring of high-risk failures using the traditional method with customised 10-point scoring scales. Organisations and teams considering the use of an FMEA as part of a quality improvement initiative should weigh the advantages and disadvantages of each scoring method to select the method best suited to their circumstances.
FMEA is an effective, proactive method of identifying failures in the systems and processes of healthcare that increase risk of patient harm.6 ,19 A primary criticism of the traditional scoring method is the significant expertise, time and resources required for customising the attribute scales and ranking of the failures using the scales.10 ,20 Frequency, severity and safeguard scale customisation and associated labour differed substantially between the simplified and traditional scoring methods (1 h vs 5 h, respectively). Although prior studies have suggested ways to decrease the time required to conduct an FMEA, most of the suggested approaches involve the omission of selected team members or forgoing the creation of a process map.20 While the FMEA process is time-consuming, process maps and hazard tables are useful to track process improvement progress over time. Process maps and hazard tables can also be shared across specialties and institutions. Results of an FMEA are invaluable for developing risk-informed, reliable interventions to prevent or mitigate failures that are most likely to lead to patient harm.33 ,34 Healthcare organisations can also use the FMEA method to iteratively assess the effectiveness of implemented interventions.35 ,36
This study is subject to the general limitations of the FMEA method, such as subjective experiences of the individual clinician participants, in which steps or failures may be unrecognised (‘missed’), underestimated or exaggerated.37–39 Further, this approach has some inherent limitations because it cannot include all staff or clinicians involved in a single process of care and therefore, must rely on convenience sampling. Finally, the scoring scales are ordinal, with uneven intervals between values, which has led to criticism of the traditional FMEA scoring and use of RPN as a method of ranking failures. Both simplified and traditional methods of ranking failures are affected by this limitation. In addition, we reported estimates of resources required for each scoring method as part of the FMEA process, but this may not be the most accurate reflection of the overall effort required to conduct an FMEA. Additionally, this study was conducted at a single, urban, academic institution and therefore, the results may not be generalisable to other types of institutions.
Conclusion
In conclusion, these results suggest that a simplified method of scoring and ranking failures identified through an FMEA may be a valuable tool for healthcare organisations with limited access to expertise of a systems engineer or experienced facilitator. While it appears that both of the simplified and traditional scoring methods can score and rank failures, the simplified method does not allow for the same degree of discrimination in the ranking of failures, particularly with regard to leading to temporary or permanent harm, when compared with the traditional method, using 10-point scoring scales and calculation of a RPN.
Acknowledgments
The authors would like to thank Adela Mizrachi and Amna Daud for their assistance with on this work.
References
Supplementary materials
Supplementary Data
This web only file has been produced by the BMJ Publishing Group from an electronic file supplied by the author(s) and has not been edited for content.
- Data supplement 1 - Online supplement
Footnotes
Contributors LMM acquired and analysed data, drafted and revised the manuscript. AB, APN and RK assisted with data analysis and critically reviewed the manuscript. DPL coconceived of the study and assisted with data collection. JH conceived of the study, critically revised the manuscript and assisted with data collection and analysis.
Funding This work is funded in part by T32 Training Grants from the Agency for Healthcare Research and Quality and the National Institute of Diabetes and Digestive Diseases (5T32HS78-15, T32DK077662).
Competing interests None declared.
Ethics approval This study was approved by the Northwestern University Institutional Review Board (Study number CR1_STU00071472) and all participants provided informed consent prior to participation.
Provenance and peer review Not commissioned; externally peer reviewed.