Article Text

Abstract
Background A multidisciplinary working group applied the Healthcare Failure Mode and Effects Analysis (HFMEA) approach to the flow of kits and specimens for the first-level test of a colorectal cancer screening programme using immunochemical faecal occult blood tests.
Methods HFMEA comprised four steps: (1) identification and mapping of the process steps (subprocesses); (2) analysis of failure modes and calculation of the risk priority numbers (RPNs); (3) identification of corrective actions; and (4) follow-up and evaluation of corrective actions.
Results The team identified 9 main failure modes, 12 effects and 34 associated causes. RPN scores ranged from 2 to 96. Failure modes within the first five positions in the ranking list ordered by RPN concerned: ‘degraded haemoglobin in the specimen’, ‘mixed-up kits’ and ‘anonymous specimen’. All of these could lead to false-negative results and/or subjects with positive tests not being recalled for assessment. The team planned corrective actions for those failure modes. As a result, the follow-up of corrective actions showed a significant decrease in the proportion of anonymous kits from 11.6 to 4.8 per 1000 (relative reduction of 59%). The HFMEA exercise led to a reduction in: missed positive tests; missed cancer and high-risk adenomas; complaints about the communication of test results to a person who never did the test; and false-negative results due either to haemoglobin degradation or an expired sampling tube.
Conclusions HFMEA is a useful tool for reducing errors in colorectal cancer screening programmes using faecal occult blood tests and is characterised by a straightforward interpretation of results and ease of communication to healthcare managers and decision makers.
- failure modes and effects analysis (fmea)
- healthcare quality improvement
- quality improvement
This is an Open Access article distributed in accordance with the Creative Commons Attribution Non Commercial (CC BY-NC 4.0) license, which permits others to distribute, remix, adapt, build upon this work non-commercially, and license their derivative works on different terms, provided the original work is properly cited and the use is non-commercial. See: http://creativecommons.org/licenses/by-nc/4.0/
Statistics from Altmetric.com
Introduction
The Failure Mode and Effects Analysis (FMEA)1 2 is a technique for proactive analysis of failure modes and their causes and effects, aimed at eliminating the possibility of unacceptable hazards and minimising the impact of unavoidable risks. The Healthcare FMEA (HFMEA)3 was introduced in 2001 by the US Department of Veterans Affairs National Center for Patient Safety, in response to the new proactive risk assessment requirement from The Joint Commission.4 Since then, several publications have reported data on improvements in the quality of services after an HFMEA in different healthcare areas, such as radiotherapy,5 nephrology,6 chemotherapy,7 surgery8 and medical laboratories,9 but not for population-based screening programmes for colorectal cancer.
A population-based cancer screening programme10 implies that the target population is actively invited at each screening round to participate in the screening test and then that any positive subjects are referred to a second-level assessment. This results in a very complex process, in which the plurality of care providers and actors, plus the significant number of citizens receiving the service each day, may result in a high likelihood of errors and mistakes. Despite this, although the recording of adverse events in screening programmes is a routine monitoring activity, the literature on a proactive analysis of errors in the area of screening is poor. Federici et al11 performed an HFMEA in 12 mammography screening programmes in the Italian region of Lazio, covering several screening procedures (eg, invitation and screening mammography).
The colorectal cancer screening programme organised by Milan’s local health authority (now the Health Protection Agency, Metropolitan Area of Milan)12 has been monitoring errors and incidents since it began its activities in 2005. Every 2 years, around 400 000 citizens are invited to take part in the screening using an immunochemical faecal occult blood test (FIT), and around 75 000 tests are analysed by the laboratory each year. Around 2200 colonoscopies are performed in associated endoscopy centres on FIT-positive subjects referred by the screening programme. Although the number of adverse events after colonoscopy has always been below the recommended standard and only one major event was reported in 2011, the programme’s management team was concerned by the number of errors related to the flows of FIT kits, taking into account the fact that no acceptable or desirable standards for this measure were set. In 2011, for instance, the number of anonymous (ie, not linked to a specific person) specimens was over 1000, and the Screening Communication Centre received 305 complaints (63% of the total) relating to lost kits and specimens, mix-ups and so on. Therefore, while the safety of the assessment process seemed to be under control, apparently there was room for improvement in the first-level test procedure. The decision to implement the HFMEA methodology was motivated by some of the process’ characteristics:
vulnerability to errors: this is demonstrated by data from the programme’s quality system and monitoring of indicators;
complexity: many actors are involved (approximately 700 people with different responsibilities within the process) and are employed by different entities (local health authority, pharmacies, wholesalers and so on) with different missions and priorities;
high dependence on the human factor: each person involved in the process must pay strict attention to performing their tasks and, in many cases, specific training and skills are required (eg, knowledge of the screening programme software).
The programme managers therefore decided that a method such as HFMEA, which is characterised by a multidisciplinary approach with a systemic focus on errors and their causes, would be a useful tool for improvement. The possibility to get a list of failure modes graded according to the magnitude of risk, hence easier to prioritise, was also considered as an advantage of this methodology. The HFMEA results were used for a quality improvement project, the results of which are also presented in this paper. The description of such a project is reported according to the Standards for QUality Improvement Reporting Excellence (SQUIRE) checklist.13
Methods
Organisation of a colorectal screening programme
The HFMEA methodology was used in Milan’s population-based colorectal cancer screening programme, in which eligible people between the ages of 50 years and 69 years are invited to be screened every 2 years for colorectal cancer using FIT. Subjects receive an invitation letter to participate in the programme and to acquire a FIT kit at their local pharmacy. The pharmacist provides the kit, together with an informed consent form, associating the person’s unique identifier (ID) with their kit by means of a barcode scanner. FIT kits are regularly delivered to every pharmacy by the same wholesalers that are in charge of the supply of medication for sale.
Once the test has been completed in the privacy of the person’s own home, the kit must be returned to the pharmacy which then sends it, via the wholesaler, to the laboratory associated with the screening programme (Milan’s public health laboratory). Returned sampling tubes are stored in refrigerated containers and tested within 1 week of collection. Analyses follow a completely automated procedure using the equipment provided by the manufacturers (OC-Sensor, Eiken (Tokyo, Japan) and NS-Plus, Alfresa Pharma (Japan)), depending on the company providing the tests at that time. During the study period (2011–2016), the threshold for positivity was set at 100 ng/mL haemoglobin for both tests.
People are informed of a negative-test result by post. Positive results are communicated personally by a programme healthcare operator in a phone call, and positive subjects are referred for a colonoscopy. Participation in the programme is voluntary, and there is no cost for completing the test (first level) or the colonoscopy (second level).
Subjects with negative FIT results are invited for a repeat screening after 2 years and to visit their general practitioner for any bowel complaints occurring in the interval between screenings.
Rolling out HFMEA
The HFMEA methodology applied to the process was developed in five consecutive stages, following the methodology proposed by the Department of Veterans Affairs National Center for Patient Safety.3 This exercise took place in the second half of 2011.
Choice of process
The process that this analysis focuses on extends from the purchase of the FIT kit from the supplier to communication of the test result back to the user.
Establishment of a multidisciplinary team to conduct the analysis
The HFMEA team involved subject-matter experts in the process, that is, people who work for the programme on a daily basis and people from outside the programme. Before starting the exercise, the experts carefully revised the programme’s risk management indicators, as well as feedback collected from programme users and other people involved in the process (eg, pharmacists and wholesale companies). This would enable them to provide a contribution that was informed by the relevant quantitative and qualitative information relating to the programme’s performance. The internal members of the team were:
a health visitor and coordinator of the screening communication centre (ET)
the person responsible for the screening programme’s IT system (NGL)
a medical doctor trained in HFMEA, acting as facilitator and leader (SD)
the director of the programme, as a member of the team with decision-making capacity in the process (LB, then ARS).
The team member who is not an expert in the process was represented by a medical doctor working as an epidemiologist in another healthcare facility (DC).
Identification and mapping of the process steps
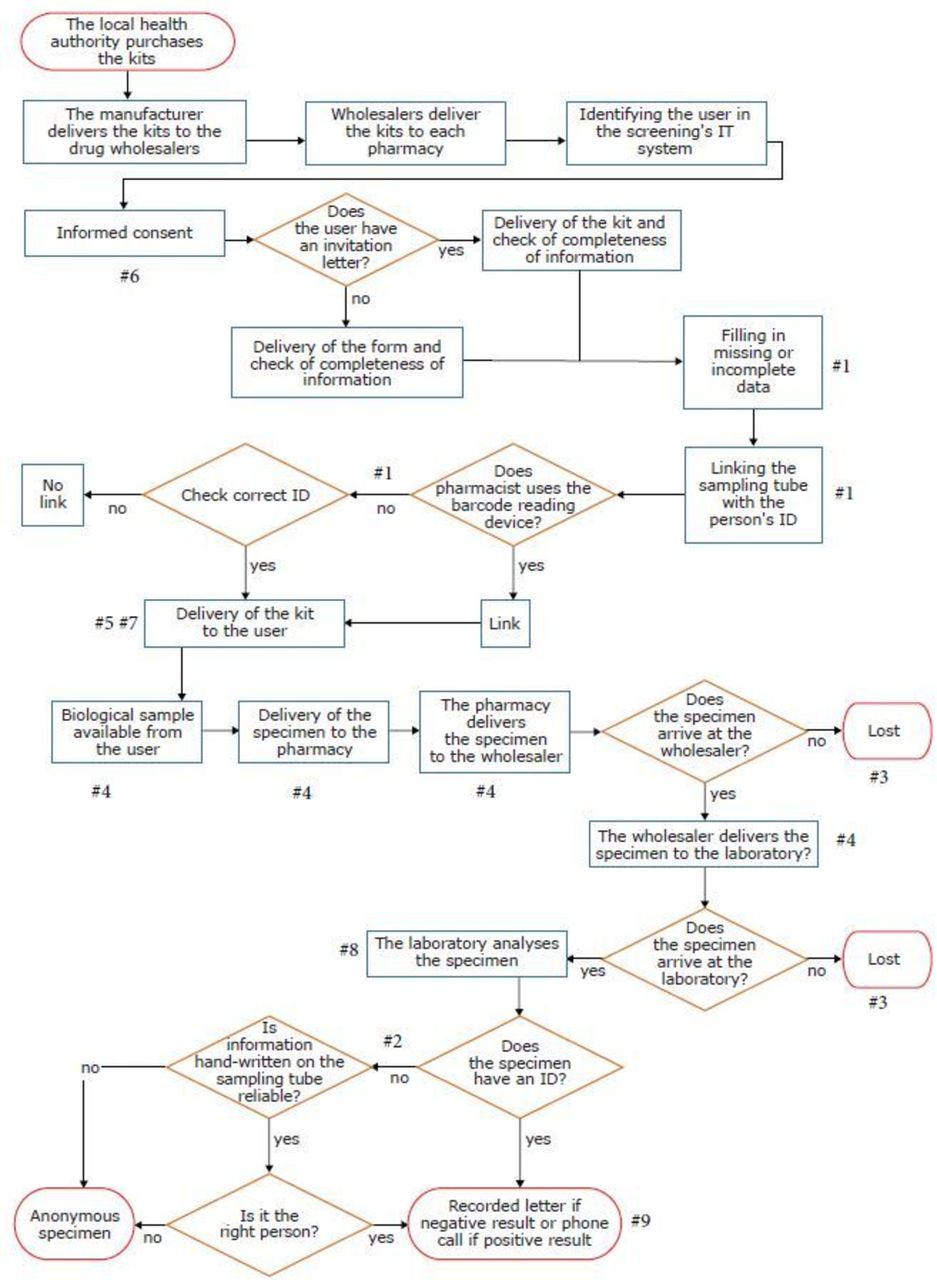
The team’s first activity involved breaking down the process into its subprocesses in terms of time and responsibility and communicating the output of this exercise in a flow chart. For reasons of presentation and improved readability, a simplified version of the HFMEA flow chart is shown in figure 1.
Analysis of failure modes
During a brainstorming session, the team identified ‘ways of error or failure’ (failure modes) for each of the subprocesses, namely all of the omissions or mistakes that could lead to failure. According to DeRosier et al,3 failure modes were operationally defined as ‘the different ways that a particular sub-process can fail to accomplish its intended purpose’. The team identified the potential causes and effects for each failure mode and arranged them in a worksheet, with each cause–failure–effect relationship shown in an individual record.
Calculation of the risk priority number (RPN)
For each failure mode, the team considered:
the severity of its consequences (S)
the frequency (or probability) of occurrence (P)
the possibility of it being detected and intercepted before it occurs (D).
To each failure mode, the team assigned a numerical score proportional to the severity of the failure mode, its probability and its detectability. For severity and detectability, they adopted a four-level scale.3 The team also decided to rate error frequency according to the scale proposed by Federici et al,11 based on the expected occurrence out of the total number of screening tests carried out, as it was considered more appropriate within the context of a population-based programme. For most of the failure modes, quantitative estimates of the occurrence were retrieved in the programme’s IT system. In the other cases, the experts provided an opinion based on their knowledge of the process, and any disagreements were resolved by consensus. Estimates of severity were also mapped out using the classification adopted for a screening programme by Federici et al11, translating their 10-point scale into a 4-point scale. The team estimated the severity of consequences not present in Federici et al, because they are specific to colorectal cancer screening by consensus. The rating scales used are summarised in table 1. While the scores for the seriousness of the effects and the probability of occurrence are directly proportional to the severity and likelihood (minimum: severity and probability low; maximum: severity and probability high), the scores are computed the other way round for detectability, so higher scores are attributed when it is more difficult to identify the error. The RPN for each record in the worksheet (cause–failure–effect) was obtained by multiplying the values (RPN=S×P×D).
Identification of corrective actions
Due to the big number of failure modes identified, the team decided to prioritise the first five (RPN >half of the highest RPN) and worked out a possible solution (corrective action), with the objective of reducing or eliminating the failure mode and its effects. Each action has been reassessed by applying the same failure analysis and recalculating the RPN to highlight possible new ‘ways of error’ as a result of redesigning the organisational processes. For each corrective action, the team assigned measurable outcomes and professional profiles to be responsible for implementation and monitoring. The statistical analyses for anonymous kits reported in this paper were planned at this stage of the project.
Follow-up of corrective actions
For each corrective action, the quarterly trend for the quantitative indicator has been described for the periods before and after implementation of the actions, extending the follow-up to 2 years after completion of the previous action.
As the project did not involve human subjects, authorisation from the local ethical committee was deemed unnecessary.

Flow chart of the selected processes and failure modes identified.
Rating scales used to compute the risk priority number
Statistical analyses
Data were computed from March 2011 onwards, because the IT system in place before that date was different and we could not guarantee the comparability of the information extracted. We compared the proportions of anonymous kits before and after the intervention by calculating the prevalence ratio, the prevalence difference and their 95% CI. Then, given the complex pattern of the proportions of anonymous kits before intervention, we fitted a polynomial logistic regression containing the covariate time (in trimesters; linear, quadratic, cubic and quartic components), intervention (0 before, 1 after) and an interaction term between time (linear component) and intervention, centred on the trimester when the intervention began.14 As a sensitivity analysis, we also fitted a simpler linear logistic model including time (in trimesters; linear component only), intervention and their interaction. Finally, we also evaluated the trend in the proportion of anonymous kits after the intervention, using a simple linear logistic regression model that included time only (in trimesters). The number of advanced lesions (cancers and advanced adenomas) missed because of anonymous kits was estimated based on the programme’s known positive predictive value (PPV) for FIT and adjusted for PPV time trend. We have estimated the difference in the number of missed advanced lesions (per 100 000; postintervention vs preintervention) by calculating risk difference (RD) and 95% CI. These analyses were performed with the Stata V.14 software.
We also assessed the impact of the intervention on the number of lost specimens by means of a run chart, interpreted according to the rules set out by Perla et al.15 The analysis was performed with the Excel tool made available on the Institute of Healthcare Improvement website.16
Results
Implementation of the HFMEA methodology
During brainstorming, based on the process flow chart, the team identified nine failure modes: (1) a kit is associated with the wrong ID code (‘mixed-up kits’); (2) the laboratory is provided with a specimen viable for analysis but without an ID identifier (‘anonymous specimen’); (3) a kit with a specimen returned to the pharmacy is never received by the laboratory (‘lost specimen’); (4) the specimen analysed by the laboratory has a haemoglobin concentration lower than that which could have been detected if the specimen was preserved within the recommended time and temperature (‘degraded specimen’); (5) the user receives an expired sampling tube (‘expired sampling tube’); (6) the laboratory is provided with a specimen viable for analysis but without the informed consent signed by the user (‘specimen without consent’); (7) the user cannot receive the kit from the pharmacy because kits are sold out (‘kit out of stock’); (8) the laboratory cannot analyse the specimen because the material is not suitable for processing (eg, the tube is too full or too empty) or the sampling tube is dirty (‘inadequate specimen’); and (9) a user cannot be reached to communicate the results of their test (‘user not reachable’). These failure modes are also mapped in figure 1.
There were 12 effects of the failures identified and 34 relevant causes (22 single and 12 associated with more than one failure). The RPN scores ranged from 2 to 96 (average 32, median 11), and failures were ranked according to their RPN score, with values from 1 to 18. The failure modes in the first five positions in the ranking list, ordered by their RPN (between 64 and 36), concern: ‘degraded specimen’, ‘mixed-up kits’ and ‘anonymous specimen’ (table 2).
Worksheet with risk priority numbers (RPNs): first five ranks
The failures ‘degraded specimen’ and ‘anonymous specimen’ have given rise to the consequences that the team considered to be most serious, that is, a false-negative result and an actual positive test, the result of which has not been communicated to the user. These consequences would affect the programme’s detection rate, which is a proxy for the programme’s final outcome (cause-specific colorectal cancer mortality reduction). A ’degraded specimen’ may result from two different causes: (A) the environmental temperatures are inadequate for preservation of the specimen (ie, at the user’s home, in the pharmacy, during transport in the wholesaler’s vehicle or in the laboratory); and/or (B) the period of time between sampling and the laboratory’s quantitative analysis is too long. Both phenomena may lead to a reduction in the concentration of haemoglobin in the sample,17 and quantitative results that are above the cut-off may therefore go below instead (false-negative result). The lack of a procedure linking the sampling tube code to the user’s ID, either when the kit is delivered to the pharmacy or when it is collected (‘anonymous specimen’), or loss of the specimen after it is collected from the pharmacy or while in the wholesaler’s vehicle (‘lost specimen’), may also result in a failure to refer positive subjects to assessment.
Lastly, ranked higher are the RPNs related to minor/moderate events (inadequate sample leading to repetition of the test) and/or less frequent causes (kits mixed up between spouses, change in the laboratory equipment and so on) (see online supplementary appendix).
Supplementary file 1
Corrective actions
For the first five rankings, the team planned corrective actions that resulted in reducing the RPN for all the failure modes considered (table 3 and table 4). The corrective actions involved a modification in the IT system, improvement of communication with the users and modifications of the procedures within the pharmacies and the laboratory.
New Risk Priority Numbers (RPNs) and improvement programmes
Tubes and inadequate monitoring of anonymous specimens before and after changing the return link
The action with the greatest impact on reducing the RPN concerned the traceability of the kits/specimens and involved implementation of a complete tracking system for them using IT tools, from delivery to the user to analysis in the laboratory. The addition of a checkpoint when the specimen is returned to the pharmacist enables a reduction in both the frequency of the ‘degraded specimen’ error (by making it possible to calculate the time elapsed between specimen collection and laboratory processing automatically), and the ‘mixed-up kits’ and ‘anonymous specimens’ errors, because there is an additional control step in the link between the user’s ID and the sampling tube code, when it is returned to the pharmacy. However, while planning this action, the team noted that its implementation would lead to the introduction of a new failure mode when the time between sampling and analysis is shown to be longer than 6 days, either at the pharmacy (‘specimen not accepted’) or at the laboratory (‘inadequate specimen’). The team therefore estimated the RPN of this new failure mode to assess the appropriateness of the corrective action. The team allocated a probability of between 1/100 and 5/100 to the occurrence of a ‘specimen not accepted’ and an ‘inadequate specimen’. As the new RPN was greater than the eighth ranking, the action was implemented. With regard to the increase in ‘specimen not accepted’ and ‘inadequate specimen’, the team suggested monitoring this phenomenon alongside a reduction in anonymous tests. The local health authority therefore purchased the new functionality for the programme management software enabling the full electronic traceability of kits/specimens. The new procedure linking the specimen to the return path was introduced in October 2014 (quarter 3 of 2014, in table 4).
The aim of improving the information available to users by updating the kit’s leaflet was principally to reduce the likelihood of the occurrence of ‘degraded specimen’ as the result of inadequate temperatures at home by giving users better information about storage standards for specimens. The new information kit also included clearer information on other aspects such as the correct sampling of faeces, which could, in turn, potentially have beneficial effects on another failure mode: ‘inadequate specimen’.
The intervention for pharmacists was multifactorial and was delivered in the form of training aimed at harmonising the procedures that lead to the ‘degraded specimen’, ‘anonymous specimen’, ‘mixed-up kits’ and ‘expired sampling tube' failure modes, as well as on-site visits to assess implementation of the correct procedures. The training was mostly focused on implementing a consistent procedure for the identification of samples and users (including use of the new IT system) and on more careful participation of pharmacists in the programme, paying greater attention to the storage of samples (temperature, time and so on) and control of stocks. The intervention for the laboratory consists of a revision of the procedures aimed at guaranteeing prompt analysis of the sample.
Within 2 years of completing the HFMEA, all of the actions had been finalised, and a continuous process to assess results through the quarterly measurement of indicators had been put in place.
Follow-up, monitoring and evaluation of corrective actions
The frequency of the ‘anonymous specimen’ failure was assessed before the action was implemented, and for a further 2 years afterwards, in order to evaluate the effectiveness of the intervention (table 4 and table 5) and whether the improvement had been sustained over time. Direct monitoring was not possible for the ‘mixed-up kits’ and ‘degraded specimen’ errors. ‘Mixed-up kits’ cannot be distinguished from the total number of ‘anonymous specimens’ and a ‘degraded specimen’ can only be assessed by monitoring false-negative results that may also recognise other causes. False-negative tests, in particular, can only be assessed through the analysis of interval cancers.
Comparison of proportions of anonymous specimens before and after the intervention
In the period 2011–2016, the screening programme witnessed a volume of activity ranging from 70 000 to 80 000 tests per year (table 4). The anonymous kits represented 1.5% of the total tests in 2011 (data available from quarter 2 only), 0.7% in 2012, 1.3% in 2013 and 0.7% in 2014, with wide variability in the different quarters, ranging from 0.3% in the third quarter of 2013 to 2.3% in the second quarter of 2011. Since the third quarter of 2014, when the new procedure for kit traceability was implemented, the percentage of anonymous specimens has not exceeded 0.6%. It fell from 1.2% in the preintervention period to 0.5% after intervention, corresponding to a relative reduction of 59% (prevalence ratio of 0.41) and an absolute reduction (prevalence difference) of 0.7% (table 5). The result obtained even went beyond the target that the team set for this indicator:<1% (table 4). The proportions of anonymous kits preintervention fell sharply from the first to the second trimester, before becoming more or less stable (although with considerable variability from one trimester to another) until the 13th trimester (figure 2: solid line). From the 14th trimester (the first after the intervention), the proportion of anonymous kits dropped (P<0.0001) and then continued in a gradual linear decline (figure 2: solid line). The intervention effect was confirmed (P<0.0001) after fitting a simple linear logistic regression (figure 2: dashed line). Following the intervention, we calculated a relative linear decrease of 10% in the proportion of anonymous vials per trimester, that is, a prevalence ratio of 0.90 per trimester (95% CI 0.87 to 0.92; P<0.0001). We also estimated a reduction in the number of advanced lesions missed, with an RD of −5.3 per 100 000 between the preintervention and postintervention periods (95% CI −0.6 to −10.1 per 100 000).
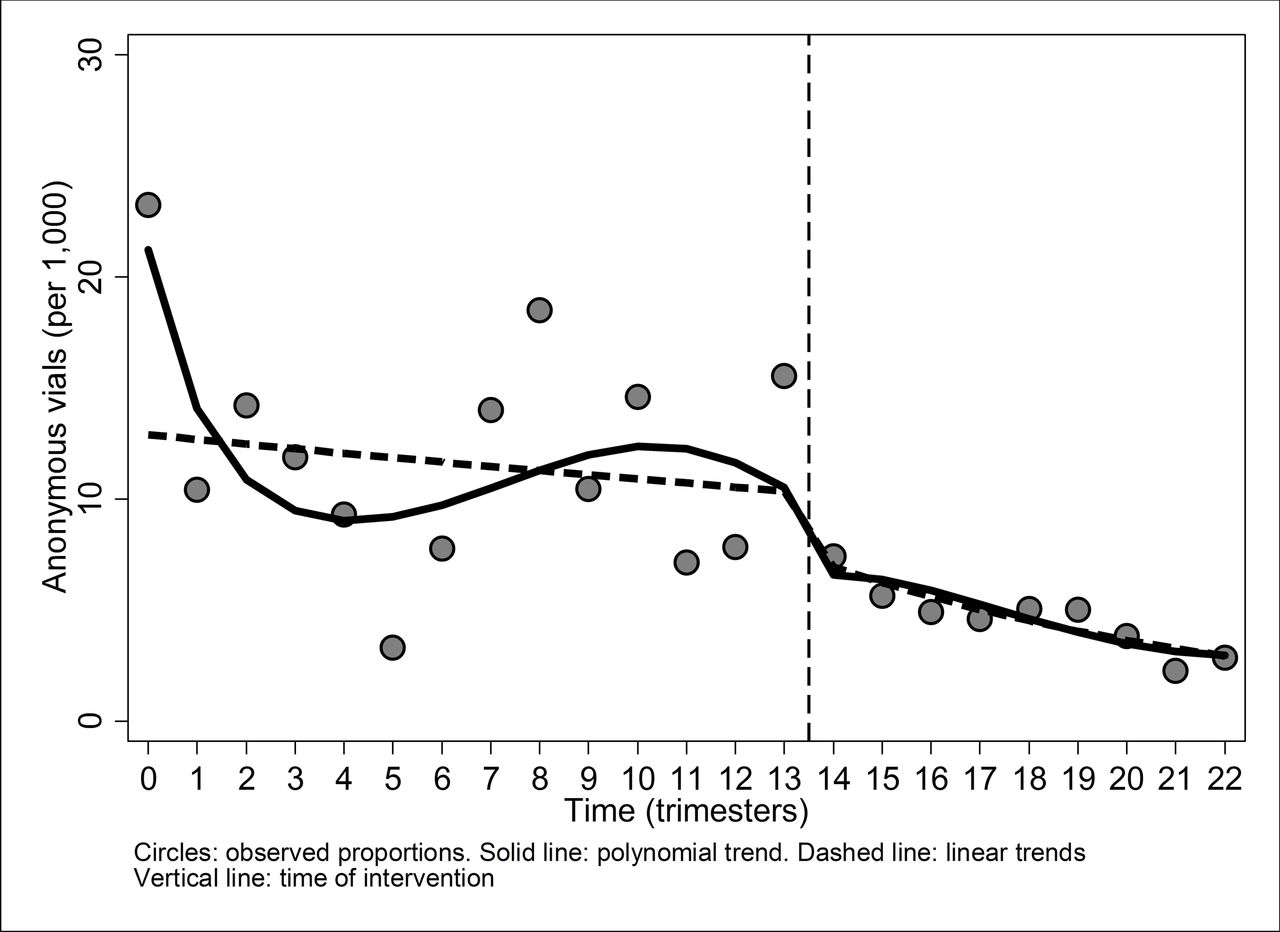
Trend in the proportions of anonymous specimens (per 1000) before and after intervention.
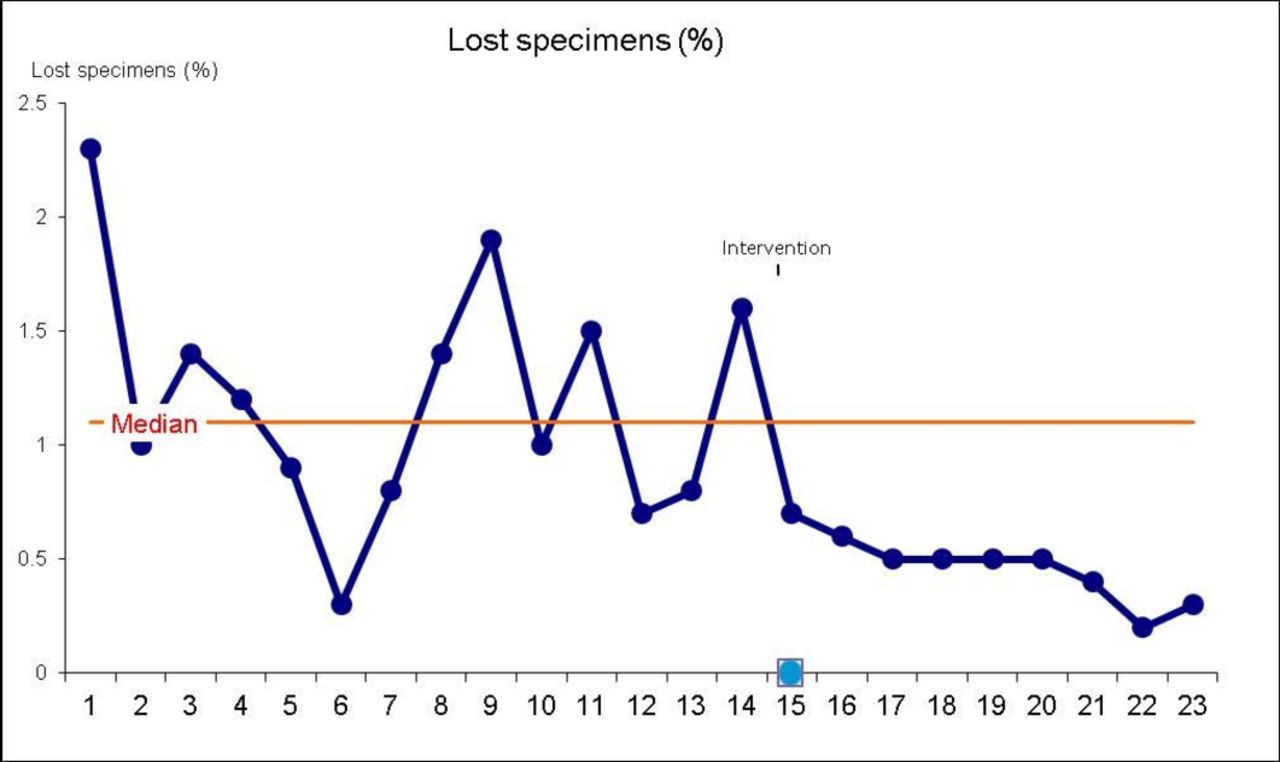
When the process was also assessed with a run chart (figure 3), the detection of a shift after the intervention was implemented confirmed the results obtained through the statistical analysis. The run chart also showed a trend in the postintervention period (only interrupted by the last observation), suggesting that the change was not only sustained over time but was also dynamic, as there was a further improvement in the period after intervention.
Run chart of the lost specimens process.
The number of tests not accepted because of an excessive interval between sampling and processing (‘specimen not accepted’ and ‘inadequate specimen’ when the reason stated by the laboratory was an excessive time interval) represented 3.6% of the total in 2015 and 2.9% in 2016. The team considered this percentage to be acceptable in view of the fact that, in the past, the same number of tests would have been processed even with the risk of false-negative results. However, a new action designed to reduce the number of tests refused by improving the information given to users is in place. The percentage trend seems to be improving, after a peak that was possibly caused by the checkpoint being introduced at the pharmacy. Furthermore, the target of 100% of tests analysed by the laboratory within 6 days of sampling has been met. Complaints about the communication of a test result to a person who did not take the test were received less than once a year after the improvement actions were implemented.
Discussion
The full HFMEA cycle (analysis of the process—HFMEA exercise—corrective actions—monitoring results) resulted in (A) a significant reduction in the proportion of anonymous specimens from 1.2% to 0.5% (relative reduction of 59%); (B) a reduction (although still not fully quantifiable) of false-negative results due to haemoglobin degradation or an expired sampling tube; (C) fewer complaints about the communication of a test result to a person who did not take the test; (D) better compliance with the correct instructions for taking the test by improving the information leaflets given to users; and (E) more effective communication with the pharmacies and the laboratory, thanks to improved procedures. These results are consistent with the project’s initial aims to reduce the errors related to the kits/specimens flow. The improvement projects implemented could lead to better performance of the programme through a reduction in the number of lesions missed as a result of positive samples being lost, or the degradation or inadequate preservation of samples. This would enable errors that may have a major impact on citizens’ trust in the programme (eg, communicating the result of a test to a person who did not take it) to be controlled.
Strengths and limitations based on the study’s design
No other improvement projects were implemented in the period 2011–2015 that had an impact on both the first-level test and the specimen flow, which would have led to a confounding bias.18 In November 2012, after a new tender, the FIT brand changed from NS-Plus to OC-Sensor. This change had consequences in terms of the percentage of positive tests resulting from the different characteristics of the test,19 but there were no differences in the sampling device or instruction sheet that could have led to a change in the number of anonymous specimens. It is therefore reasonable to assume that the differences observed in the number of anonymous specimens are entirely attributable to changes in the tracking procedure prompted by the HFMEA exercise. The number of anonymous specimens is automatically recorded by the IT system without the need for human intervention, so we can assume that the results collected in this way are not biased, particularly by expectations of improvement following implementation of the new strategy (detection bias).18 As the whole of the screened population was included in the analysis and continuous follow-up, this study would seem not to be biased as a result of incomplete follow-up (attrition bias) and a lack of representativeness of the sample (selection bias).18
Our study shares the same limitations as the HFMEA method itself, namely the low external validity and reproducibility of results obtained in a certain context,20 the subjectivity of judgements,21 as well as the diversity of scales applied to calculate the RPN.21 In particular, the choice of a different occurrence scale, although required because of the specificity of the context, may hamper comparability with other HFMEA exercises conducted using the De Rosier method. This study considered the risks relating to the specimen’s route without taking into account the effect of other programme procedures on the population, such as the selection of the test type and cut-off,21 as well as the different characteristics of the various tests, such as varying sensitivity to high ambient temperatures.17 22 Although these issues fall outside the scope of this study, they have to be taken into account in a comprehensive assessment of the risks of a screening programme based on FITs.
Study findings in the context of current research
Population-based screening programmes have a long tradition of evaluation and a different set of indicators is currently in use for monitoring purposes, performance evaluation and impact assessment. Most of the reports of adverse events from colorectal cancer screening programmes are related to the endoscopy test, for exampe, bleeding following polypectomy and large bowel perforations.23 To our knowledge, systematic monitoring and studies on errors related to the FIT or guaiac test are still scarce and errors are, most likely, managed in the context of the daily quality management of a screening programme (eg, laboratory non-conformities) rather than being systematically reported as with other aspects of the screening test, such as diagnostic accuracy.
So far, our study is a unique example of a quality improvement project that used the HFMEA methodology in a mass screening programme and showed a statistically significant improvement in performance as a result. This experience was useful for retrieving a scale for the occurrence of errors that is meaningful for a health intervention with a large target population. Unfortunately, other findings are not comparable with ours as, for example, mammography screening11 is based on an imaging technique performed on women who actually attend a healthcare facility, while a colorectal cancer screening test involves self-sampling at home and returning the sample to a laboratory for analysis. Similarly, HFMEA experiences such as that of Flegar-Meštrić et al9 focus on internal laboratory steps and do not involve the transportation of specimens from the producer to the user and from the user to the laboratory.
HFMEA on FITs in the colorectal cancer screening quality assurance scenario
The changes implemented allowed the standards set out in the first edition of the European Guidelines for Quality Assurance in Colorectal Cancer Screening and Diagnosis24 to be met, in particular, Recommendation 4.9 on user identification, and Recommendation 4.18 on quality assurance for laboratory performance, which explicitly includes uptake, undelivered mail/samples, time from collection to analysis and lost and spoiled kits. The implementation of the HFMEA methodology also meets the requirements of ISO standards specific to testing activities (eg, International Organization for Standardization 15189 for laboratories)25 and healthcare accreditation systems, such as The Joint Commission.26
The impact and generalisability of the study’s findings
Currently, colorectal cancer screening is recommended worldwide as an effective public health tool for cancer prevention. In the European Union, colorectal cancer screening programmes have been implemented nationally or regionally in 20 Member States, with a total of 4 302 916 faecal occult blood tests performed annually27 in 2015. It may not be possible to generalise our results entirely with programmes using a different procedure for sending out and collecting kits (eg, by post) or using the guaiac faecal occult blood test. However, as some features are common among different test modalities, such as the need for full traceability, temperature control and so on, and the types of incidents detected may be the same, our study could still provide useful indications for programmes based on faecal occult blood testing, as each programme should guarantee that the management of users’ specimens is as safe and effective as possible.
Implications for costs and sustainability
As a multidisciplinary analysis of the process highlighted the weaknesses of the specimen path, a comprehensive improvement plan was set up, which took into account the priorities and actions that may have a greater impact on quality. In the context of a scarcity of resources within healthcare systems, particularly in the quality field, this proved to be a very suitable method for improving quality and for receiving adequate funding (owing to its clear impact on outcomes). The results, along with the expected effect of corrective actions, were also shown to be reported in a way that policymakers and healthcare management outside of the process could understand. The corrective actions were endorsed by all of the stakeholders, at an acceptable cost. In fact, all of the corrective actions were implemented without additional costs, with the exception of the integration of the linkage procedure in the software. That corresponded to just 4.7% of the total amount spent on the screening programme (largely overestimated as the total does not include personnel and laboratory costs) [data not shown].
Conclusions
In conclusion, the HFMEA methodology reported in this paper has enabled Milan’s screening programme to reduce the number of specimens lost significantly, with a resulting increase in the programme’s effectiveness, risk reduction and user satisfaction. New applications of the HFMEA methodology in screening programmes and further technical development could constitute new challenges for the future and could offer an affordable tool for the overall improvement of health interventions, with only positive consequences for the population concerned.
Acknowledgments
First of all, we are indebted to the Screening Communication Centre’s team for its role in collating the issues related to the programme and users’ feedback and its meticulous reporting, which enabled this improvement programme to be planned and executed. In particular, we would like to thank Ms Antonella Pitzalis for her support in collecting detailed technical information on the FIT kits flow. We are also indebted to Liisa Pylkkanen and Donata Lerda for providing their comments on the first draft of the paper. We would also like to thank Richard Scoville for allowing us to use the tool that he developed for run charts, from which we also extracted the graph in figure 3.
References
Footnotes
Contributors SD designed and conducted the project analysis. ARS and LB were involved in supervising the project. ET was the project lead. AB, DC and NGL collected data and performed analyses. All the authors assisted in drafting and editing of the manuscript. All the authors have had the opportunity to draft and revise this manuscript and have approved it in this final form.
Funding SD working time on this project (from March 2012 to January 2018) and the open access fee were funded under Administrative Arrangements 17.030600/12//SI2.635313 and 17.030100/16//SI2.746515 between the European Commission Directorate-General Health and Food Safety and the Directorate-General Joint Research Centre.
Competing interests None declared.
Provenance and peer review Not commissioned; internally peer reviewed.