Article Text

Abstract
Prolonged wait times at the emergency department (ED) are associated with increased morbidity and mortality, and decreased patient satisfaction. Reducing wait times at the ED is challenging. The objective of this study is to determine if the implementation of a series of interventions would help decrease the wait time to consultation (WTC) for patients at the ED within 6 months. Interventions include creation of a common board detailing work output, matching manpower to patient arrivals and adopting a team-based model of care. A retrospective analysis of the period from January 2015 to May 2016 was undertaken to define baseline duration for WTC. Rapid PDSA (Plan, Do, Study, Act) cycles were used to implement a series of interventions, and changes in wait time were tracked, with concurrent patient load, rostered manpower and number of admissions from ED. Results of the interventions were tracked from 1 October 2016 to 30 April 2017. There was improvement in WTC within 6 months of initiation of interventions. The improvements demonstrated appeared consistent and sustained. The average 95th centile WTC decreased by 38 min to 124 min, from the baseline duration of 162 min. The median WTC improved to 21 min, compared with a baseline timing of 24 min. The improvements occurred despite greater patient load of 4317 patients per month, compared with baseline monthly average of 4053 patients. There was no increase in admissions from ED and no change in the amount of ED manpower over the same period. We demonstrate how implementation of low-cost interventions, enabling transparency, equitable workload and use of a team-based care model can help to bring down wait times for patients. Quality improvement efforts were sustained by employing a data-driven approach, support from senior clinicians and providing constant feedback on outcomes.
- root cause analysis
- quality improvement
- emergency medicine
- workload
This is an Open Access article distributed in accordance with the Creative Commons Attribution Non Commercial (CC BY-NC 4.0) license, which permits others to distribute, remix, adapt, build upon this work non-commercially, and license their derivative works on different terms, provided the original work is properly cited and the use is non-commercial. See: http://creativecommons.org/licenses/by-nc/4.0/
Statistics from Altmetric.com
Problem
Timeliness and efficiency form two of the six domains of healthcare quality as defined by the Institute of Medicine.1 At the emergency department (ED), prolonged wait times have been found to be associated with increased morbidity and mortality, and decreased patient satisfaction.2 3 Increasing attendances to the ED, an ageing population and greater disease complexity, coupled with manpower and physical infrastructural limitations, have made reducing wait times at the ED more difficult.
A team-based approach to care of patients has been found to be associated with better patient outcomes and improved patient satisfaction,4–6 likely due to closer communication and coordination between patients and care providers. When implemented at the ED, a team-based patient care has been shown to have positive outcomes.7–9
Within the department, there have been prior efforts to decrease patients’ wait time to consultation (WTC), which did not attain the desired outcome due to manpower and space limitations, fragmentation and variability of care, the lack of tracking and auditing of work output, and the absence of feedback mechanisms to staff regarding individual work output.
Background
Singapore General Hospital (SGH) is the largest public hospital in Singapore, with 1600 inpatient beds. The Department of Emergency Medicine (DEM) sees more than 135 000 patients annually. On arrival at DEM, patients are triaged according to specific patient acuity categories (PAC) as defined by the Ministry of Health of Singapore (MOH),10 ranging from priority 1 (P1) patients who are critically ill and require immediate management and resuscitation, P2 patients who have acute medical conditions or severe symptoms that require very early medical attention, and the P3 and P4 patients who have minor emergency and non-emergency conditions, respectively.
Depending on the patient’s condition and assigned PAC score, the patient is assigned to various treatment areas within the department for consultation with attending doctors. There is senior doctor supervision of all treatment areas within the department. P1 patients are usually seen at the resuscitation area, P2 patients at the critical care area and P3 patients at the ambulatory care area. The department staffing is structured towards patient acuity, with 70% of doctors staffed to cover P1 and P2 patients. The close proximity between each treatment area allows doctors to cross-cover areas during periods of surge when there may be a resultant imbalance of attendances between each treatment area.
One of the MOH key performance indicators for DEM is the P2 patients’ WTC. The clock begins when patients register on arrival at DEM and ends when the consultation begins. The SGH target for the 95th centile WTC is currently 76 min, with a threshold waiting time of 122 min. The targets are derived from a moving average of monthly institutional WTC over a predetermined period. Over the years, increasing attendances to the ED, an ageing population and greater disease complexity, coupled with manpower and physical infrastructural limitations, have made achieving the target more difficult.
As prolonged wait times and ED crowding are associated with poorer patient outcomes, the quality improvement team aimed to reduce the 95th centile WTC for P2 patients to less than 76 min in 6 months.
The team first embarked on a root cause analysis to identify reasons for prolonged wait time. The main cause identified was inefficiencies in the consultation model for P2 patients after they were triaged and assigned to their respective treatment areas. The lack of a standardised consultation model meant that interactions between junior doctors and supervising senior doctors regarding patient management plans can vary as much as up to 2 hours when comparing between different shifts within the same day, corrected for patient load. Another significant cause identified was a lack of real-time feedback regarding the work output of doctors on the floor in helping clear the queue of unseen waiting patients.
Baseline measurement
Baseline data from January 2015 to May 2016 was collected, and analysis of 32,420 P2 patient visits was done. To understand the processes and problems faced on the ground, an actual state analysis was performed. All work processes were assessed and extensive data analysis was conducted over a month. A value stream map of the P2 patient journey was created, detailing the process flow, time elements and analysis of limitations. This helped to highlight possible operational constraints and areas for improvement.
Effort was focused to understand the processes that affected WTC directly. Rework and chaos were notable during the consultation stage of the value stream map. With the current consultation practice in ED, care management plans may be modified (rework) when junior doctors seek the opinion of the supervising senior doctors only at the later stage of patient care. It was estimated that an average of 7.3% of orders were cancelled, with each of them amounting to an average of 34 min delay for a P2 patient.
In a dynamic (chaos) environment of ED, it is also very easy for staff to get lost in their own list of tasks before attending to a new patient, and hence there is little command and control of how each area is coping with their queue and workload. Exacerbated further by a lack of manpower during peak periods, the chaos was represented by an average delay of 1 hour before a doctor reviews a patient in the critical care area.
The baseline preintervention median WTC was 24 min and the 95th centile WTC was 162 min. The 95th centile WTC was found to be largely dependent on how fast DEM doctors attend to the P2 patients after they have been triaged. A comparison of the hourly patient arrival pattern with the hourly WTC performance revealed that a significant backlog of patients formed after 11:00, which lasted for the rest of the day. This problem was exacerbated by the slow outflow of admitted patients to inpatient wards. As a result, more ED resources were used to care for these patients.
Design
The team was led by an emergency physician, with two emergency nurse clinicians and an analyst from the hospital’s Operations and Performance Management department. The team was further supported by IT analysts, who provided data for baseline analysis, and backed by senior clinicians who approved interventions and ensured their smooth implementation. Members of the team assisted in the dissemination of information and instructions, and encouraged compliance during implementation. They also gathered ground feedback to identify issues faced and for ideas to further improve processes.
To ensure the sustainability of interventions, feedback was extensively sought from the ground to shape implementation. Although the main goal for the team was to decrease the WTC, all interventions were made with the prevailing aim of improving patient safety. We focused on three areas for improvement and used rapid PDSA (Plan, Do, Study, Act) cycles: the real-time reflection of patient flow and work output, the levelling of workload to staff ratio, and the implementation of a team-based model of care.
Strategy
PDSA cycle 1
Doctors and nurses did not have visibility to the department’s overall workload, as well as how each area was coping with their patient load. To tackle the issue, a board was constructed and placed within the care area for P2 patients. This board detailed the names of the junior doctors on shift with accompanying columns for the patients seen by them. On initiating consultation with a patient, the junior doctors would place the patient’s sticker within their personal column during their shift.
The board, although manual in nature, enabled real-time visibility of workload distribution and patients seen, and allowed senior doctor in the team to identify and aid junior doctors who may be bogged down by patients with complex medical conditions or requiring difficult procedures. Reminders were given to doctors, verbally and via email feedback, emphasising the importance of complying with the logging of the patients seen. Implementation cost was negligible, mainly secondary to the stationery used.
PDSA cycle 2
A review of the department manpower and throughput showed a mismatch between patients’ arrival pattern and junior doctor manpower on shift. The mismatch in the demand and supply of junior doctors resulted in a challenging workload of up to 3.4 new patients hourly and an accumulation of patients from 11:00 until the end of the day.
We sought to adjust the roster to match the supply of doctors on shift to the anticipated patient arrivals by time of day. This would greatly reduce any backlog of patients waiting for consultation and allow doctors to see patients at a manageable pace.
Based on the ideal junior doctor output of seeing 1.5 new patients hourly over a shift, the junior doctors’ roster was modified to match patients’ arrival pattern. This resulted in more doctors being deployed during the day when patient arrivals tend to peak, and allowed junior doctors to see patients at a manageable rate. This allowed more time to be devoted to complex medical cases without being overwhelmed by a huge backlog of patients waiting for consultation.
PDSA cycle 3
The team found that it was common practice among junior doctors to seek the opinion of the supervising senior doctors only at the later stage of patient care, leading to additional time spent on modifying care management plans and ordering additional investigations. To encourage junior doctors to seek the inputs of senior doctors in the early stage of patient care, a team-based model of care was implemented as a solution.
Previously, senior doctors, junior doctors and nurses mostly worked in silos. The team-based model of care grouped a senior doctor, junior doctors and nurses into a team. Two teams were assigned to the care area for P2 patients and received triaged patients in an alternating manner to ensure equitable workload for each team. With this model, staff will have to work with each other in teams, bringing about better division of labour and more effective communication within each team.
Junior doctors were given the mandate to seek the senior doctor’s input upfront so that patient management plans can be initiated and carried out with minimal deviation. Nurses were encouraged to participate in patient care by initiating department protocols, such as providing analgesia for patients in pain and carrying out investigations for other selected conditions.
The team-based model of care enhanced the clarity of patient care between doctors and promoted ownership and accountability for patients. Between shift changes, patients were handed over within teams, therefore strengthening the coherence and continuation of patient care. Furthermore, with the aid of the board in PDSA 1, staff were able to see how each team was coping and manage their queue accordingly.
To sustain the interventions, daily wait times and individual doctor output were tracked. The team actively looked for significant deviations in the tracked data and sought to identify system issues early. Individual doctors were fed back regarding their work output and counselled by their supervisors when required.
Results
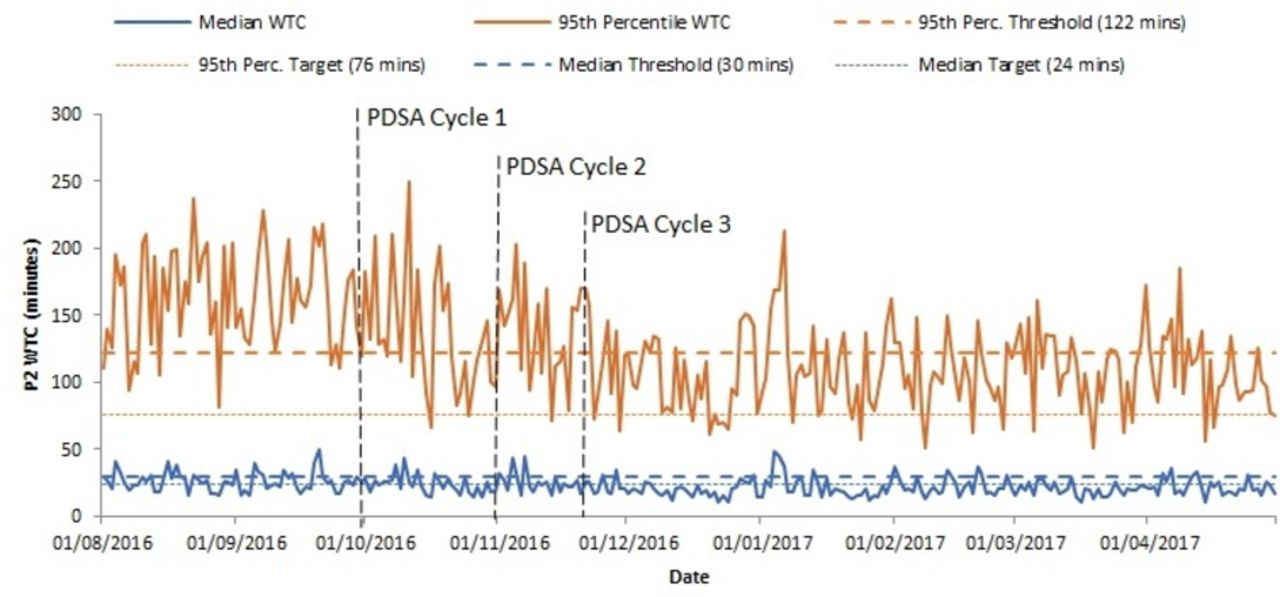
The period from the initiation of intervention on 1 October 2016 up to 30 April 2017 was evaluated. During this period, there were two rotations of junior doctors into the department. The median and 95th centile WTC were calculated over the said period, as represented by a control chart (figure 1).
Daily Department of Emergency Medicine priority 2 (P2) wait time to consultation (WTC) median and 95th centile performance. PDSA, Plan, Do, Study, Act.
The 95th centile WTC saw the greatest positive effect from implementation of the PDSA cycles. Over the period of intervention, the average 95th centile WTC was 124 min, which was a decrease of 38 min from the baseline duration of 162 min (table 1). The implementation of PDSA cycle 3 saw significant and sustained improvements in the WTC, with an average of 114 min during the period after PDSA cycle 3, lower than the threshold target of 122 min. This further supports the utility of a team-based care model at the ED.
Comparison of intervention period with baseline period
The median WTC improved to 21 min, compared with a baseline timing of 24 min (table 1). The effect on median WTC was seen with implementation of PDSA cycle 1 and maintained through the study period. The implementation of PDSA cycles 2 and 3 resulted in further marginal improvement in median WTC.
The improvements in wait times occurred during the period with an average P2 patient load of 4317 patients per month, which was greater than the baseline monthly average of 4053 patients (table 1). Department manpower remained stable. After the implementation of all three PDSA cycles, improvement was observed in several process outcome and measures. There was a 15% decrease in inpatient admissions from ED of P2 patients compared with the prior period (66% pre-intervention to 52% post-intervention; P<0.05), thereby relieving the daily requirement of an average of 20 beds.
The flow of patients through the consultation stage has improved. Time to review by a doctor in critical care area has improved by 14 min (60 min pre-intervention to 46 min post-intervention; P<0.05). There is also a 0.6% decrease in the cancellations of orders for patients’ management plan (7.3% pre-implementation to 6.7% post-implementation; P<0.05).
There was a 1.6% decrease for patient admissions from the ED compared with the prior period (56.0% post-intervention and 57.6% pre-intervention; P=0.004). The total time duration to ED disposition also saw a decrease of 17 min during the study period, compared with the prior period (145 min post-intervention and 162 min pre-intervention; P<0.001).
Feedback from doctors and nurses within the department was uniformly positive. Commonly cited reasons included increased efficiencies, greater clarity and a transparent yet equitable workload. Feedback was markedly positive for the group of junior doctors who experienced the pre-intervention phase and post-intervention phase within the same posting period. As the study was focused on quantitative outcomes, no formal pre-intervention and post-intervention comparison on feedback was carried out.
To ensure patient safety and outcomes were not compromised, reattendances to SGH ED within 72 hours were tracked as a balancing measure to make sure the quality of care for all ED patients would not be compromised for pursuing a faster process time. This indicator was measured with patients who were discharged home and subsequently returned to SGH ED within 72 hours. Comparing with the rates of reattendances 6 months prior to implementation, the rates during post-implementation have remained steady at an average of 3.4% (P>0.1).
Lessons learnt
Data analytics played a significant role in the successful implementation of PDSA cycles. The team could identify significant areas for improvement with in-depth analysis of baseline data, and results were corroborated with root cause analysis findings. The ability to identify patterns in patient arrivals allowed us to match department manpower to periods of surge. Expected work output, based on frequently refreshed data, was communicated to staff, enabling clarity and equitable workload.
To gain constant buy-in from staff on the ground and ensure sustainability of the interventions, results and findings were shared with doctors and nurses regularly through the study period. We identified best practices and encouraged staff to share positive actions that contributed to better team-based care for the patient. Feedback was also constantly received from staff during the study period and has helped to further adjust interventions.
Numbers and data gleaned were distilled into easy-to-understand charts and tables, and disseminated to the department, to keep everyone updated on the progress of the quality improvement effort. Having regular feedback to stakeholders and department staff helped to allay concerns early and allowed a visual translation of the hard work performed on the ground. This helped improve acceptance and compliance to the interventions. Senior clinicians were extremely supportive of interventions and enabled the smooth implementation of measures taken.
Using a simple board that highlighted everyone’s workload contribution for the day was effective, as the transparency it offered allowed juniors on shift to keep pace with one another, allowed fairer sharing of load and gave them the psychological effect of wanting to keep up with their peers’ output. There was clarity into the distribution of work done within the area by individual, and allowed seniors on shift to visualise the tempo of their shift and easy identification of junior doctors in need of assistance.
Limitations
Although the median WTC target was achieved, we were not able to meet the 95th centile target of 76 min, and thus did not attain the stated goal of this study. WTC starts from the time the patient is registered. Subsequent analysis postintervention has identified the wait time to triage now as a significant contributor to both median and 95th centile WTC. We are currently conducting a separate quality improvement effort to decrease the wait time for triage.
During periods of prolonged wait for inpatient beds for patients admitted from ED, the increased workload due to boarded patients places strains on the team-based care model, as teams need to care for both incoming and boarded patients at the same time. This manifests in increased WTC during days with higher proportion of boarded patients.
Despite initiatives on the ground to improve processes within the ED, wait times also depend on the smooth flow of admitted patients out of the ED into the inpatient wards. Studies have shown that boarded patients at the ED contribute to overcrowding, affect the delivery of care and may lead to increased costs and length of stay.11 12
Currently, data on daily WTC and individual work output are retrospectively collated every 2–4 weeks for feedback and analysis. To have to manually paste patient stickers on the board also contributes to time spent by doctors, which may be better used on actual patient care. We are looking to develop an intelligent electronic version of the board, which removes the need for use of stickers, and that also allows for real-time capability for feedback and automated reporting.
Conclusion
Implementing the package of changes to improve the P2 WTC was a major effort that required a data-driven approach, catalysed by the staffs’ conviction to improve patient outcomes. We demonstrated how implementation of low-cost interventions, enabling equitable workload and how breaking down work silos with the use of a team-based care model can help to bring down wait times for patients.
The insights gleaned from the analysed data allowed the team to make quick and informed decisions, while teamwork and staff buy-in ensured the sustainability of the project. The team is currently looking to further decrease the total time duration to ED disposition for patients by implementation of further quality improvement initiatives targeting other aspects of the patient’s journey at the ED.
Acknowledgments
The authors would like to acknowledge the following: Dr Evelyn Wong, Head DEM; Tan Puay Hwang, Nurse Clinician, DEM; Muqtasidatum Binte Mustaffa, Nurse Clinician, DEM; and Ryan Koh Zhao Yuan, Hospital Executive, OPM.
References
Footnotes
Contributors All authors contributed to the design and writing, data collection and interpretation of the results of this study.
Competing interests None declared.
Ethics approval The SingHealth Centralised Institutional Review Board exempted the study from ethical approval as the work was deemed a quality improvement study and not a study on human subjects.
Provenance and peer review Not commissioned; externally peer reviewed.