Article Text

Abstract
Cardiac arrests are often preceded by a period of physiological deterioration. Preventing potentially avoidable cardiac arrests therefore depends on reliable recognition of, and response to, those deteriorations. Our hospital’s acute medical unit had one of the highest rates of cardiac arrest in our organisation at baseline. The aim was to reduce our unit’s cardiac arrest rate by over 50%. Pareto chart analysis identified unreliable processes in the recognition and response to deteriorating patients. Process mapping exercises were performed, then the model for improvement and rapid cycle tests of change were used to develop standardised processes for clinical observations, recognising deteriorating patients and responding to hypoxia. Multidisciplinary learning from what went well, incorporating resilience engineering principles, helped to identify good practice and then test ways of making good practice happen more reliably. Learning from success also addressed some of the psychological barriers to change by encouraging pride in work and a positive focus within our unit. The cardiac arrest rate reduced from 4.3/1000 (October 2014 to February 2016) to 1.1/1000 (March 2016 to end of 2016), associated with improved reliability of the following process measures: reliability of clinical observations, documentation of target oxygen saturations, identification of hypoxia and completion of structured response to hypoxia. This study is an example of a multidisciplinary team engaging in quality improvement, identifying their own local problems and testing their solutions scientifically. Learning from what went well had a positive impact on the project, and the team plans to spread the successful interventions across the organisation.
- collaborative, breakthrough groups
- checklists
- quality improvement
This is an Open Access article distributed in accordance with the Creative Commons Attribution Non Commercial (CC BY-NC 4.0) license, which permits others to distribute, remix, adapt, build upon this work non-commercially, and license their derivative works on different terms, provided the original work is properly cited and the use is non-commercial. See: http://creativecommons.org/licenses/by-nc/4.0/
Statistics from Altmetric.com
Problem
This project took place as part of our local National Health Service (NHS) organisation’s deteriorating patient collaborative. Seven wards across three district general hospitals within the organisation were identified as having the highest cardiac arrest rates (a cardiology ward, a high dependency unit, a gastroenterology ward, an acute surgical ward and three acute medical units (AMUs)). A collaborative approach has been found to be useful by other organisations doing similar projects previously.1
This project focuses on one AMU and took place between July 2014 and June 2016.
Our aim was a greater than 50% reduction in cardiac arrests in our AMU by June 2016.
Background
Cardiac arrests are often preceded by 8–12 hours of physiological deterioration, detectable by measurement of patients’ vital signs.2–4 Moreover, patients’ prognosis deteriorates with increasing numbers of abnormal physiological parameters.5 Inadequate clinical monitoring and failure to act on deterioration has been found to be associated with preventable deaths in hospital.6 7 Previous studies of hospital patients,8 9 National Reporting and Learning System data7 and National Confidential Enquiry into Patient Outcome and Death’s 2012 report, ‘A Time to Intervene’,10 have all found similar deficiencies in care, including failure to undertake observations, recognise deterioration and failure to intervene.
In addition, the 2012 Royal College of Physicians report, National Early Warning Scores (NEWS): standardising the assessment of acute-illness severity in the NHS,11 found that in relation to the deteriorating patient, current evidence suggests there are three critical elements that define clinical outcomes: early detection of deterioration, timely response and competent clinical response.
These issues were highlighted again by Sir Bruce Keogh in The Review into the quality of care and treatment provided by 14 hospital trusts in England,12 which reported that, “One consistent theme throughout almost all of the organisations reviewed was the management of complex deteriorating patients and the monitoring of Early Warning Scores. The basic failure of observation at ward level gives rise to multiple problems”.
Some healthcare systems have successfully reduced the chance of patients suffering a cardiac arrest in the UK, USA and in Europe, including Salford Royal Hospitals Trust,1 NHS Forth Valley13 and University College London NHS Trust.14 They have used local teams, improvement methodology and elements of the model for improvement15 to understand failures in their own setting, and improved the reliability of their care processes. In each case, improvements had been designed and tested locally, and early recognition of deterioration and reliable response were found to be crucial.
This project therefore aimed to improve the management of deteriorating patients by improving the reliability of clinical observations, recognition of deterioration and response to deterioration, using some of the principles used in the previous studies mentioned above. The hypothesis being that improved reliability of these key processes would lead to a reduction in the outcome measure of cardiac arrest.
Attempting to reduce the number of cardiac arrests by improving care of deteriorating patients was one of the aims of the Scottish Patient Safety Programme (SPSP)’s Acute Adult programme,16 which helped to provide a framework and reference for this project.
Baseline measurement
Our baseline cardiac arrest rate was 4.3/1000 (October 2014 to February 2016).
Outcome measure was cardiac arrest rate per 1000 deaths and live discharges. The operational definition of cardiac arrest is all individuals in eligible clinical areas receiving chest compressions and/or defibrillation and attended by the hospital-based resuscitation team in response to a cardiac arrest call.
Convenience sampling of five patients per week was used to collect data on process measures of:
Reliable observations (temperature, pulse, respiration, saturations, blood pressure and frequency).
Reliable recognition of deterioration. Recognition of hypoxia was defined as either applying oxygen in response to low oxygen saturations and/or documentation of drop in oxygen saturations below target level. Low oxygen saturations were defined as less than 94%, unless alternative acceptable oxygen saturation range is specifically documented, for example, 88%–92%.
Documentation of target oxygen saturations.
Oxygen prescribing.
Completion of hypoxia structured response.
All aspects of the observations and response bundles had to be complete (yes or no) for data collection.
These elements were plotted against time to produce run charts in order to ascertain whether or not any significant improvement had been made following any intervention.
Different members of ward staff collected the data at different times during the project. At one point, when the reliability of clinical observations deteriorated, stratified sampling was used to identify if the issue was with patients from the emergency department (ED) or general practitioner (GP) referral pathway. This helped to identify that the issue was with patients referred from ED. This was addressed by standardising the process for obs documentation on arrival to the unit using visual aids and instructions for bank/new staff. This meant there was clarity on the frequency of obs whether patients had arrived from ED or the GP referral pathway. The data subsequently started to improve and convenience sampling was reintroduced.
Design
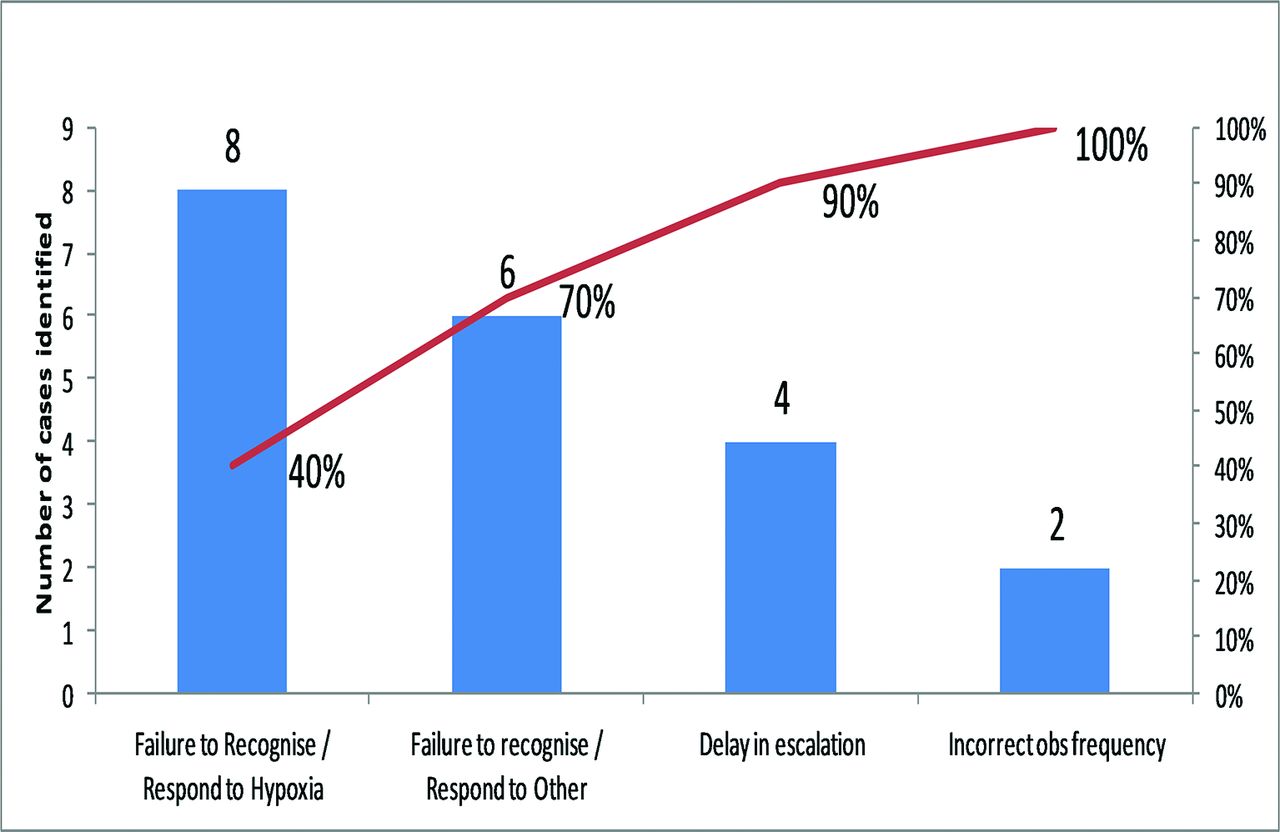
Pareto chart analysis of case notes (figure 1) identified hypoxia as the most frequently missed sign of deterioration within our unit, and this was therefore a focus of the project.

Pareto chart analysis of case note review findings. Hypoxia is identified as the most frequently missed cause of deterioration.
A driver diagram was developed, loosely based on the SPSP’s national deteriorating patient driver diagram,17 but with a local focus on hypoxia.
Process mapping, involving multidisciplinary tabletop exercises and observing work as done rather than work as imagined, provided evidence of unwanted variation in our unit within the primary drivers outlined below:
Reliable clinical observations.
Recognising deterioration.
Responding to deterioration.
Effective team working.
Our project identified local problems, then applied the quality improvement principles of small tests of change using Plan–Do–Study–Act (PDSA) cycles and the model for improvement to try to improve.
For example, patients’ target oxygen saturations were found to be documented in one of four locations, the medical notes, nursing notes, observation charts and/or the drug chart, depending on the individual clinician’s preference and usual practice. The staff who recorded oxygen saturations (clinical support workers) only ever looked at the clinical observation chart; therefore, if the target saturations were documented in any location other than on the clinical observations chart, they would never be seen by the staff member recording the oxygen saturation result. This variation in the location of documentation of target saturations could lead to hypoxia going unnoticed and/or inappropriate oxygen therapy being applied.
Crucially, members of all grades of staff, and all disciplines, actually doing the work within the unit were involved in designing solutions where problems such as the target saturations issue were identified.
There were 6 days over the course of a 2-year period from June 2014 to June 2016 where clinical staff from the pilot wards met in learning sessions. This helped to generate ideas from each other, learn what worked and keep momentum going.
The team in our AMU met weekly for approximately 1 hour. The meeting would take place prior to the unit’s daily safety brief, and ward staff could then be updated at the safety brief. A quality improvement board in the ward was introduced, with annotated run charts displaying our performance in relation to the outcome, process and balancing measures shown in the Results section. Daily updates and/or instructions on that day’s testing also took place at the safety brief.
Our quality improvement (QI) team consisted of a medical consultant, an anaesthetist, senior charge nurses, charge nurses, clinical support workers and an improvement adviser.
Strategy
This section is split into five key elements of the project. There were multiple PDSAs on each intervention—some PDSAs are summarised below. Our main hypothesis was that standardisation of care processes in clinical observations, recognition of deterioration and response to deterioration would improve process measures and reduce unwanted variation. We were mindful throughout the project of the QI principle, ‘Make it easy to do the right thing’. Defining the most effective processes required multiple tests and the full involvement of multidisciplinary team.
Reliable completion of clinical observations
PDSA 1
Standardised observation times were introduced after they were tested on another pilot ward, with the hypothesis that if observations were done at predetermined times, 08:00, 12:00, 16:00, 20:00, then it would help task allocation in the ward, with the aim of achieving >95% reliability. Reliability 60%.
Feedback
Staff noted that 08:00 was a difficult time to do clinical obs, as other competing tasks (eg, washing, feeding, medication rounds) occurred at that time.
PDSA 2
Standardised obs times moved from 08:00, 12:00, 16:00, 20:00 to 06:00, 10:00, 14:00, 18:00. Reliability improved to 70%. Feedback: Noted that standardised obs times did not work for patients on obs more frequently than 4 hourly, and staff highlighted that the process for initiating obs on those patients relied on human memory.
PDSA 3
Boards introduced outside each room in the ward, with ‘time next obs due’ documented, and then wiped after each observation. Reliability improved to 90%. Feedback that patients could move before next obs due, and therefore potential for missing set of obs.
PDSA 4
Boards adjusted to include patients’ initials, with the hypothesis that this would address the concern in PDSA 3 by helping with identification of patients while maintaining confidentiality. In addition, the writing on the boards was colour coded by triage category, allowing for easy identification of high triage, and therefore potentially deteriorating, patients. Reliability improved to 95%, then subsequently showed a significant shift—seven data points of 100% (see figure 2—Results section).
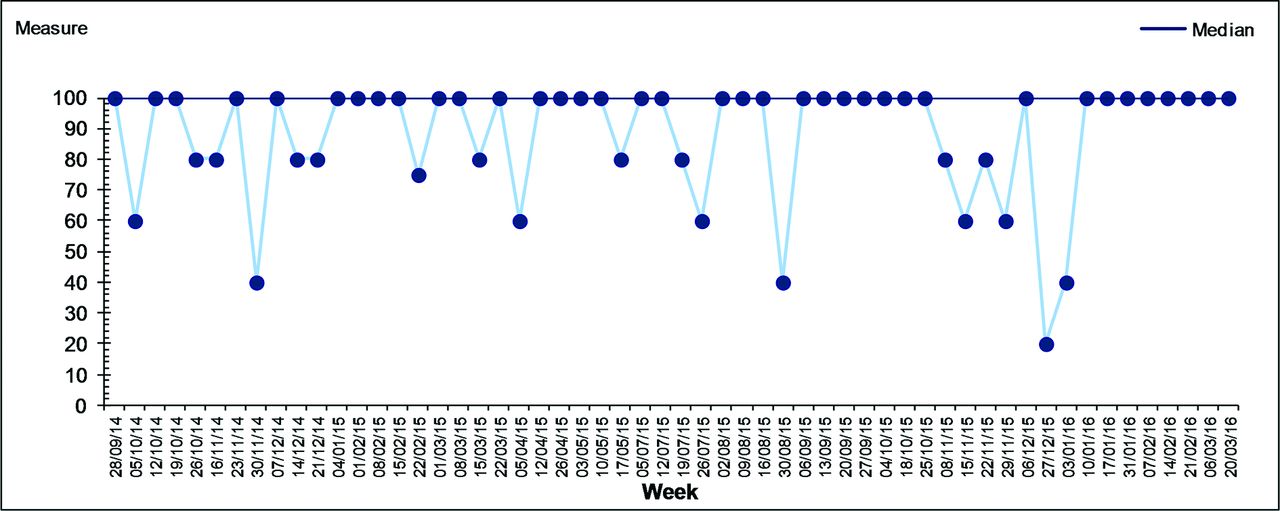
Reliability of clinical observation bundle completion.
Reliable recognition of deterioration
PDSA 1
Visual aids with generic target saturations on them (>94% or 88%–92% if chronic obstructive pulmonary disease (COPD)) were developed to aid recognition of hypoxia and were clearly displayed at patients’ bedside and on the clinical observation machines. Reliability remained at baseline (70%). Staff highlighted discrepancies between generic and individual target saturations for some patients with chronic lung diseases such as COPD.
PDSA 2
To address this issue, and facilitate identification of hypoxia in individuals with different target oxygen saturations, junior doctors were made aware of computer database of patients with known abnormal oxygen saturations. Results: 0 patients with COPD identified as having target sats outwith 88%–92%. Feedback: It was noted that the database was difficult to access, and only three patients were registered on the database. Respiratory specialist nurses informed and brought into project group. The respiratory nurses continued to develop the COPD database during the project, but formal measurement was not continued as part of this project.
PDSA 3
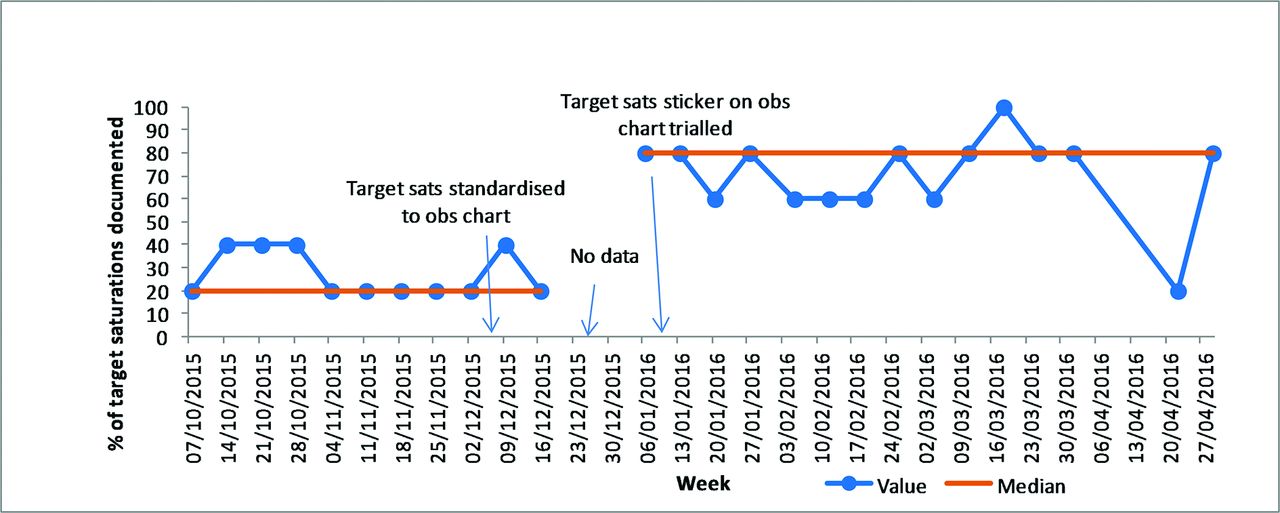
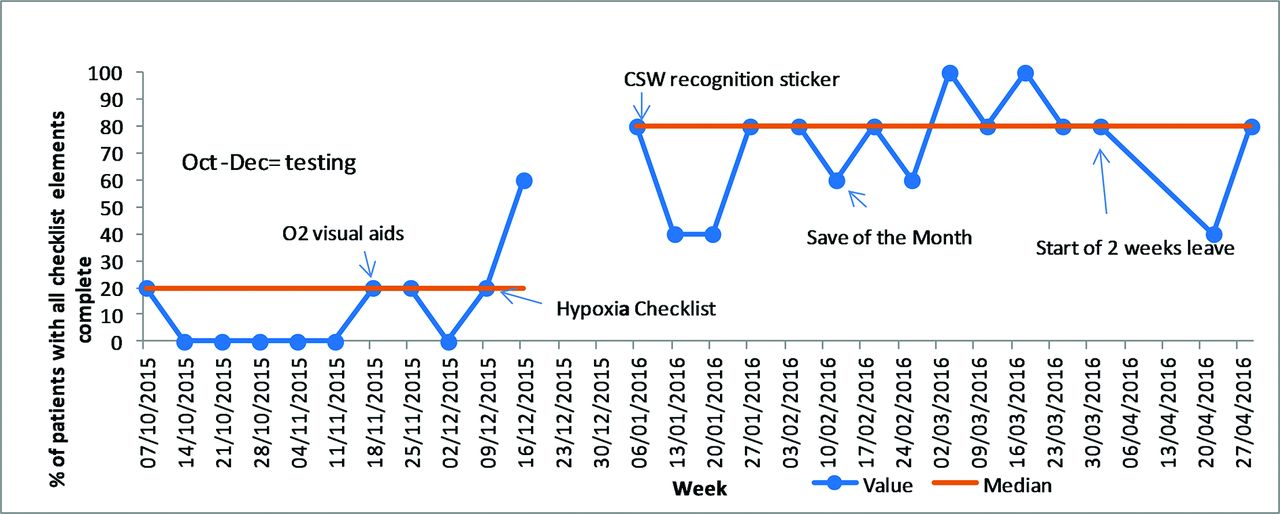
Documentation of target oxygen saturations was standardised to the clinical observation chart. The hypothesis was that this would make the target saturations visible to everyone recording target saturations and would address the wide variation in documentation location described earlier in this paper. Reliability of detection of hypoxia improved from 60% to 90% and showed a sustained shift by run control chart rules thereafter (see figures 3 and 4—Results section).

Target oxygen saturation documentation on clinical observation chart.

Recognition of hypoxia. COPD, chronic obstructive pulmonary disease; CSW, clinical support worker.
PDSA 4
Clinical support worker (CSW) recognition of deterioration sticker. A checklist in sticker format was developed (following multiple small tests) with tasks that the CSW should perform when a patient’s physiological parameters deteriorated (essentially increase frequency of obs and inform nurse in charge). The hypothesis was that this would help to define deterioration and therefore make recognition of deterioration more reliable. Reliability of hypoxia recognition did not change (90% to 90%).
Reliable response to deterioration
PDSA 1
Hypoxia response. For patients who were identified as having oxygen saturations below their target range, a structured response (checklist) to hypoxia was tested, refined and introduced. The checklist consisted of the agreed minimum requirements for health professionals to complete when hypoxia was identified. It was tested in sticker, proforma and poster formats. Final components:
Apply oxygen to achieve target saturations.
Inform nurse in charge.
Repeat saturations after oxygen applied, then increase frequency of clinical observations accordingly.
Request medical review.
The hypothesis was that this structured response would reliably ensure that patients had an early senior review, appropriate early treatment and increased monitoring.
Result
Reliability improved from 25% to 60%, with sustained shift in reliability by run chart rules thereafter (see figure 5—Results section).

Hypoxia response. CSW, clinical support worker.
Patient-centred team working:
PDSA 1
Daily safety brief prioritising most unwell patients, led by the nurse in charge of the ward that day. Our hypothesis was that this enabled identification of deteriorating patients, and having deteriorating patients first on the agenda re-enforced the message that they are our priority. Nurse in charge awareness of all patients in ward with high early warning score improved from 60% to 90%.
PDSA 2
Patient-activated consultant response, allowed patients and their relatives to contact their consultant directly if they noticed any deterioration. The hypothesis was that this would help to identify deteriorating patients earlier, and patients would have a prompt senior review. Results: no patients phoned during testing.
Study—Although no patients phoned and the intervention was not implemented, the test demonstrated a willingness to flatten the medical hierarchy within the unit, and a willingness of the project leader to change their pattern of work, not just ask other members of staff to change. In addition, feedback was collected from patients asking why they decided not to phone, and this was very positive; for example, ‘Felt safe’, ‘was being well looked after’, which was then used in a positive way to show staff that they were doing a good job.
Resilience engineering:
PDSA 1
We attempted to address some of the psychological aspects of quality improvement. We introduced ‘Save of the Month’, which is a concept of multidisciplinary learning from what went well. We identified a real patient’s journey where processes of care had been performed very well, and then displayed the anonymous story in our staff room, and then reviewed the case with the multidisciplinary team. Feedback from staff was that they appreciated positive feedback and helped make them feel proud of the care they gave.
PDSA 2
Successful ‘Save of the Month’ structure adjusted to help identify test of change ideas. Multidisciplinary team were asked to identify key factors in why processes worked well in this case. Ideas were then generated to attempt to make that desirable factor happen more reliable, using further PDSA cycles. Data not collected, but this formed the basis for some of our change ideas.
Results
Outcome measure
The cardiac arrest rate was analysed using statistical process control chart rules and was reduced from 4.3/1000 during the baseline period (October 2014 to end of February 2016) to 1.1/1000 in 2016 (figure 6).

Cardiac Arrest Rate in ECU per 1000 discharges/deaths.
During the baseline period, our AMU accounted for 26% of cardiac arrests in the hospital; from March 2016, the AMU accounted for 11%. This improvement corresponded with improved reliability of process measures, analysed using run charts, as demonstrated below.
Process measures
Clinical observation data show seven data points in a row at 100% in September/October 2015 (figure 2). The subsequent deterioration corresponded with a shift in focus of the project; from reliable clinical obs to testing recognition and response change ideas. As mentioned previously, stratified sampling enabled us to identify that the problem lay with one particular stream of patients, and following a simple process change there, the reliability of clinical observations showed a significant improvement again (eight data points at 100%). Improved reliability was also seen in documentation of target oxygen saturations, recognition of hypoxia and response to hypoxia. Oxygen prescribing did not improve (figures 3–5, 7, 8).

Oxygen prescription.
Reducing time to antibiotic had been the focus of a large quality improvement project in our unit prior to starting this one, hence it was chosen as a balancing measure during this project. This showed a deterioration in early 2016 but has subsequently returned to normal variation (figure 8).
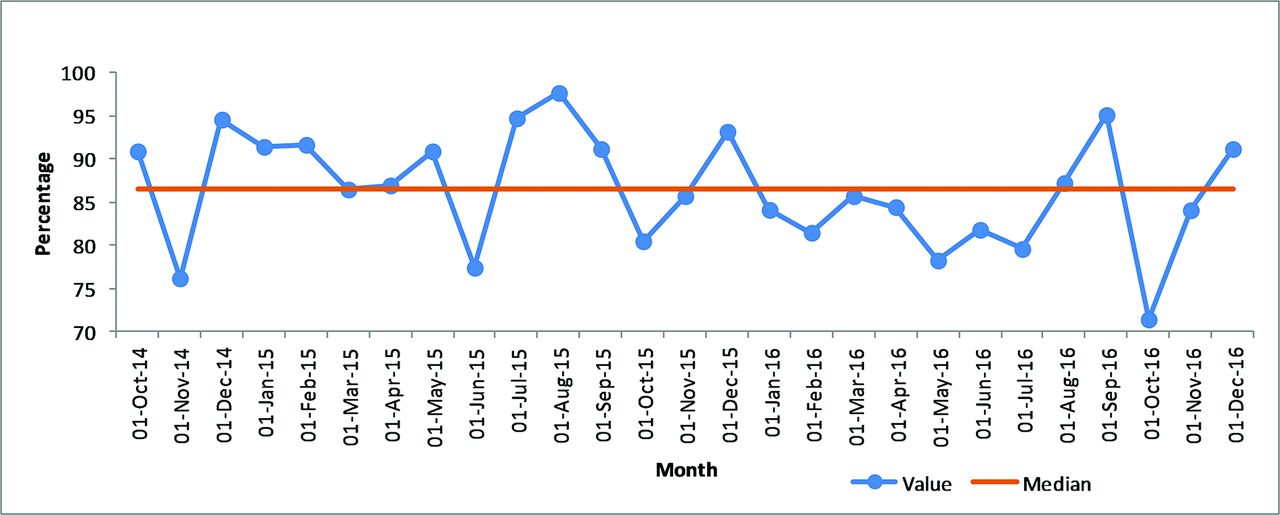
Percentage of septic patients receiving intravenous antibiotics within 1 hour.
Lessons and limitations
Acknowledging Deming’s system of profound knowledge,18 there was a deliberate attempt to address the psychology of change as part of this project and develop the intrinsic motivation of staff rather than external priorities. Our intervention, ‘Save of the Month’, was inspired by the resilience engineering work of Hollnagel et al on safety 1 versus safety 2,19 by trying to make systems safer by learning from what went well, and then test interventions that make the desirable ‘thing’ happen more reliably.
Hypoxia was found to be the most commonly missed cause of deterioration in our unit. Previous studies8 9 also identified problems with identification and management of hypoxia in medical patients; therefore, the issues described are not unique to our unit.
The hypoxia response described in this paper was an example of a checklist, which consisted of a small number of straightforward steps that could benefit patients if performed reliably. Checklists have been shown to be very successful in other areas of medicine, for example, the surgical pause and central line insertion bundle.20–22 A structured response for deteriorating patients has been advocated by the SPSP and is in line with Scottish Intercollegiate Guidelines Network guideline 139.23
Importantly, we attempted to apply learning from previous studies regarding producing the optimum conditions for a checklist to be effective; that is, having co-ordinated efforts to explain the rationale for the introduction of the checklist to all staff in the ward and giving clear instructions for its use.24 To achieve this, we had daily safety briefs to explain why the intervention was being trialled, and the checklist was discussed, tested and refined with the full involvement of staff doing the work.
NHS improvement have found that ‘there is no one quick-fix’ to address the problem of the timely detection and management of the deteriorating patient.7 They advocate whole system approaches, which we attempted in this study. Furthermore, focusing on the processes of care within NHS systems was a recommendation of Don Berwick’s 2013 report into the NHS.25
Convenience sampling was used, and this may have led to difficulties in identifying issues early when there were two different processes occurring, for example, observations reliability during day shift compared with night shift. However, convenience sampling did allow meaningful data to be collected over time without putting a large data collection burden on staff. Combining this with stratified sampling where appropriate helped to identify and address issues when the data did suggest a problem.
There were a large number of interventions in this study, which makes it impossible to tease out which intervention individually made the biggest difference.
Some of the interventions made in this study may not be generalisable to other wards or facilities. For example, differing skill mix in the staff taking clinical observations in different healthcare systems, or different IT systems, may mean that some of our interventions would be unnecessary. However, the principles of planning and structuring QI projects, standardisation of processes, involving all grades of staff in QI work and addressing the psychology of change are relevant to all QI work.
The team involved in this project were learning as the project took place, both in terms of quality improvement theory through the Scottish Patient Safety Programme fellowship and in effective teamwork. There was more sustained engagement of a stable team towards the end of the project. This resulted in a more cohesive project in the final 8 months compared with the start of the study.
The deterioration in the reliability of clinical observations after the focus shifted from clinical obs in October and November 2015 may indicate that our clinical observation processes were not as reliable as we thought and were being maintained through hard work and vigilance, and therefore when the focus was removed, the performance deteriorated. However, we believe it is a strength of the project that we were able to identify this and make further changes, which resulted in significant improvements in the reliability of clinical observations.
The processes measured in this study were not highly reliable even at the end of the study, as evidenced by a drop-off in reliability of the hypoxia response when the project lead went on leave; therefore, further work is required to improve reliability.
Oxygen prescribing showed no significant change over the course of the project (figure 7) suggesting that oxygen prescribing is not the only important factor in the management of hypoxic patients. However, by improving the documentation of target saturations and having a structured response to hypoxia, we have addressed some of the concerns around oxygen therapy highlighted in the British Thoracic Society oxygen guideline.26 Specifically, standardising the documentation of target sats to the obs chart addressed the problem outlined in the design section and was associated with improved recognition of hypoxia. This is an example of taking a guideline and adapting it to a local context, a variation of an approach successfully implemented at Intermountain Healthcare.27
Previous studies in the UK healthcare setting have shown reductions in cardiac arrest rates.1 13 They have shown the benefits of using a structured response for all deteriorating patients, including early decision-making regarding appropriateness of escalation of care.
We did not measure any aspects of resuscitation orders, end-of-life care or ceiling of treatment decisions, which is a limitation of the study. It is therefore not possible to determine if the reduction in cardiac arrest rate has been achieved by better DNACPR (Do Not Attempt Cardio-Pulmonary Resuscitation) decision-making or improved survival through early intervention in deteriorating patients. The hospital’s standardised mortality rate, or HSMR (figure 9), has shown a downward shift during the period of time covered by this project, but it is not possible to determine whether or not this project had any significant impact on the HSMR. HSMR data are produced by the National Information Services Division.28

Wishaw General Hospital’s standardised mortality rate (SMR).
The improvement in cardiac arrest rate was not seen in the other pilot wards within the organisation. However, the collaborative approach helped with generation of ideas for testing, and regular meetings helped provide support throughout the project.
Some aspects of the project, for example, clinical observations, recognition of deterioration, resilience engineering and ward safety briefs, apply to all patients within the ward. Our study suggests that focusing on a locally relevant aspect of the deteriorating patient, in this case hypoxia, is important, and that the cardiac arrest rate can be reduced through application of quality improvement principles.
Conclusion
A whole systems multidisciplinary approach, focusing on reducing unwanted variation in processes of care and improving team working through introducing simple interventions, can lead to a reduction in cardiac arrest rate.
Identification of methods of improving the reliability of key processes can be achieved by learning from previous suboptimal performance and from learning from what went well.
This study used quality improvement principles that are applicable across a variety of settings. Identifying local issues (hypoxia in this case) and then applying simple interventions can result in large improvements. These interventions can be found from learning from local examples of good practice and by addressing barriers to good practice though genuine engagement with the multidisciplinary team. Testing and refining the ideas generated by staff involved in performing the processes, rather than top–down interventions, can facilitate reliable delivery of effective care.
Further work is required to see whether the specific interventions introduced here can have the same impact when spread across the organisation. It also remains uncertain as to whether or not the strategies adopted in planning and leading this study will be effective when applied to other quality improvement projects.
However, our experience in this study was that frontline clinical staff already have the solutions to some of the challenges in delivering reliable healthcare. If their ideas are supported and appreciated, and data on their performance are used for improvement rather than judgement, then engagement increases massively and improvements in clinical outcomes can be huge.
Acknowledgments
The authors thank Julie Coyle, Lesley McGoldrick, Jane Murkin, Joe Hands, Liz Anderson and all of the respiratory specialist nurses in Wishaw General Hospital. We would also like to thanks all the doctors, nurses and clinical support workers in Wishaw General’s Acute Medical Unit, and all the patients who gave valuable feedback during the project. Finally we would like to thank the Scottish Patient Safety Programme for their support.
References
Footnotes
Competing interests None declared.
Provenance and peer review Not commissioned; externally peer reviewed.